DSC 2001 Proceedings of the 2nd International Workshop on Distributed Statistical Computing March 15-17, Vienna, Austria http://www.ci.tuwien.ac.at/Conferences/DSC-2001 K. Hornik & F. Leisch (eds.) ISSN 1609-395X
Embedding S in Other Languages and Environments Duncan Temple Lang
∗
Abstract Interfaces to other languages such as C and Fortran have provided S users access to a vast collection of existing software. Adding general interfaces to other languages allows us to access the software developed for those languages. In addition to providing S users with easy and immediate access to the functionality in languages such as Java, Python and Perl, these interfaces also work in reverse, providing users of those environments with access to S. This allows us to export high-quality statistical software to a larger and broader audience than data analysts and statisticians and have a greater impact on the way statistical methodology is used. In this talk, we illustrate how embedding R can be used in a variety of different applications. We focus on a single example – dynamic and interactive report generation. This shows how we can make use of S directly from within Perl, XML and XSL, Netscape and JavaScript and the Postgres database server. As well as widening the audience, embedding S within these languages allows S programmers more flexibility in choosing the correct tool for any particular task. Much of the flexibility and expressiveness of this inter-language mechanism comes from • using references rather than copying data between the systems, and • using direct function calls rather than evaluating strings in the other system. Interfaces to each of the languages and systems mentioned is made available via an Omegahat package for R. ∗ Bell
Labs, Lucent Technologies
Proceedings of DSC 2001
1
2
The Goal of Integration
Programmers frequently choose to use a particular language for a task simply because interfacing to just one facility developed in that language is too hard. Instead, they use an often sub-optimal environment for programming the remainder of the task simply to make using just one specific aspect feasible. This is essentially allowing the tail to wag the dog and leads to poor software. The code is unnaturally complex, non-extensible, non-reusable and maintainability is severely challenged. A very large audience is excluded from domain-specific or specialized software such as S, Matlab simply because the overhead of learning the philosophy, syntax and nuances of these languages are excessive for casual use. Instead, this type of potential user requires facilities that are in her familiar, day-to-day software environment, where she has managed and organized her data. Both of these situations would be greatly improved if we could use the functionality developed in one language directly and easily from within another. We would like to be able to express what we want done (i.e. the functionality) in whichever language is appropriate and ignore the details of integrating the functionality across the different systems. As part of the Omegahat project, we have developed a simple but general approach to this seamless connectivity for a variety of different languages, including Java, Perl, Python, JavaScript, SQL and XSL (the eXtensible Stylesheet language). Each of these uses the same general facilities for embedding functionality developed in one language (e.g. S) into other languages and applications. The result is that software the each of us develops is available to a wide audience of users of other systems. Additionally, it gives us more flexibility in developing new code. We can choose the most appropriate environment for programming each task while seamlessly accessing the necessary functionality in the different systems in which each was developed. This concept of invoking functions in other languages and applications is familiar to all of us in different forms. The S language provides interfaces to C and Fortran and these languages can access S functionality. Distributed computing via CORBA, Java’s Remote Method Invocation or Microsoft’s DCOM is another example. In this paper, we will talk about a simpler and more direct way of accessing functionality in different systems. Specifically, we will consider just a single process and treating the R engine as a C level library which can be loaded into other applications. This idea of running the R interpreter within another application is usually called embedding. With a general and dynamic approach to invoking functions in S and converting data structures as references between the two systems, we can make all S functions available to the other system as if they were local to that system.
2
An Example: Report Generation
We will introduce a lot of different technologies in this presentation. The way in which we use each of them shares a common theme, namely accessing statistical
Proceedings of DSC 2001
3
functionality from other applications as part of a larger task. To try to simplify the presentation, we will use just a single example or scenario throughout the discussion. The idea is report generation and we will focus on creating and displaying a reasonably simple report to potentially different groups of readers. The report is to be constructed daily with newly collected data. The contents of the report consists of text, tables and graphics. The content of each of these elements is dynamically generated when the report is created. We also want parts of the report to be interactive, allowing readers to explore the data and results in their own way, limited by the controls that we give them. Finally, we will discuss how the interactive components can offload computations by having them done in a database. This allows the client’s viewer to be essentially a “thin” client. In the presentation, we will show how we can use, and even need, a myriad of different programming languages and tools. We use S, Perl, XML, XSL, Xalan, HTML, JavaScript and Java. Each of these is well-suited to doing a particular task in the report generation and rendering. Most importantly, however, we show how these tools can take advantage of an embedded R interpreter to access high quality statistical functionality and graphics in order to provide the specific content. Report generation is an example of where we typically use ad hoc methods to create a document that contains text and different numerical and graphical output generated in data analysis application. We sometimes do all the formatting and string manipulation in S simply because that is where the data and statistical methodology lives. Another approach is to use Perl or some such language which is better suited to text manipulation but then we have to invent ways to access the output from the statistical environment.
2.1
Chip Manufacturing
So far, our example of report generation is still general. We will focus on a real task involving the creation of computer chips in a wafer fabrication plant. In a previous project, the goal was to create summary reports for engineers so that they could explore the results from each day’s production process, allowing them access to the different levels or resolution of details The organization is simple. For each day, we have a collection of approximately 150 “lots”. Within each lot, there are on the order of 50 wafers and each of these contain numerous chips. Each of these chips is tested at the end (or during) the production process and either passes or is assigned a failure type. The engineers are interested in the proportion of good chips that are created for each wafer and each lot. They can examine the spatial patterns of the failures to try to understand and correct difficulties in the production process. The report that we generate is intended to be hierarchical, presenting at the top-level just a basic summary of the day’s activities. These summaries are • a paragraph providing this particular day’s results, detailing the number of lots, and how many passed the quality control levels and • a histogram giving the distribution of yields across the lots.
Proceedings of DSC 2001
4
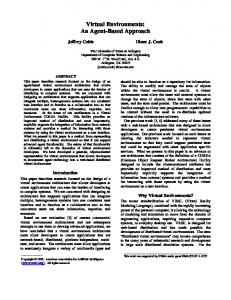
• a table listing each of the different lots and the average yield of the wafers within that lot. The reader can delve further into the details and interactively examine each lot and the distribution of its failure types. This is done with both numerical and graphical summaries. The simplicity is appealing from a human-interface perspective, but is also surprisingly effective in identifying interesting features quickly. The content of the first page of the report is dynamically generated from the data for the day in question. It is however, essentially static after it has been created. The histogram and numbers remain fixed. The interactivity comes in the subsequent pages and allow the reader/user to dynamically update the contents of the display. These two types of dynamic content are different stages of the process and require different tools. One is done off-line and the other directly within the browser. The stages involved in the report generation and rendering are shown in Figure 1.
Generation
Rendering Netscape Forms
XML File
Javascript S−xslt
HTML File R
XSL File
Java Tcl/Tk
Figure 1: The stages in the report generation and rendering
We us the RWafers library to perform the statistical analysis and generate the output. The overall architecture illustrates how easy it is to use existing software in new ways. The work on the wafer library was originally done by David James and Mark Hansen. It was ported to R by David and Vadim Kutsky.
Proceedings of DSC 2001
3
5
Generating the Report
We start by focusing on the first stage in the creation of the report, namely the fixed or static summary page. Ideally, we want the author of the report to be able to specify what components should appear and where, that is the layout. They do this by referencing the output of computations that are to be performed in other languages (e.g. S) when the document template is converted to an actual document or instance and using a language like TEX or HTML to specify the layout. There are several ways to arrange for executing the commands and substituting or replacing these with the output from those commands. We start by considering how we might do this in Perl which might seem to be an obvious tool.
3.1
Using Perl
Perl’s regular expression matching and powerful text processing facilities make it a good choice for iterating over the contents of the document looking for elements that are to be executed. For each of these elements that it identifies, it must determine the appropriate command and language in which to invoke it. Then it must execute the command and put the return value into the text of the document being created. It is reasonably straightforward to specify this setup in Perl. The author of the report would use a special tag to identify code sections in the document. For example, we might identify S code as @S: summary(x)@ As Perl processes the document, using regular expressions, it would extract the expression summary(x) and evaluate it in S and insert the result as text into the document. A difficulty arises in executing the commands in S. We can do this by calling R as a sub-process and having it write the results on standard output. There are two drawbacks to this. One is that we must restart R for each of the computations within the document. Of course, this is inefficient, but it can also make computations quite complicated. The values used in one computation are not immediately accessible to subsequent computations as they are in a different session. Each code section must arrange to assign those values permanently to make them available in future sessions. Also, the results can only be returned as strings and this is a significant restriction. S must generate the appropriate text to be displayed in the report and so must do significant string manipulation. It is also hard to ensure consistency as other languages can also be used. A more efficient, flexible and convenient mechanism is to embed R within Perl and allow the Perl code to evaluate S commands and access S objects directly within the same process. The results of evaluating the S commands can be returned as regular Perl objects or references to more complex S objects. Perl can then manipulate these to format them appropriately and insert them into the text of the document. Assignments from one command remain available for subsequent commands but not future sessions. We avoid the overhead of starting R for each command. The new versions of the RSPerl package [6] allows this embedding.
Proceedings of DSC 2001
6
The ability to embed the S language within Perl allows us to get the benefits of both languages and to use the most appropriate tools in each for doing different tasks. To complete this approach, we still have to write the code that iterates over the document, identifying the the different commands and performing the substitution. While this is, in principal, not very difficult, the are a myriad of details. We have to handle line breaks, escaping characters, etc. carefully within the regular expression matching and this can be tricky if one wants to produce robust software. It also requires familiarity with Perl and therefore can be hard for others to extend and maintain.
3.2
XML, XSL and XAlan
Given that the solution using Perl requires a non-trivial amount of work to create the code that identifies the commands in the document, we can ask whether there is a better tool. The essential characteristics of what we want are simple. We need a way to • identify elements within a document that are to be evaluated, • evaluate the code, and • insert the result into the document in that location. The first is a form of markup in which we identify the different elements and so something like XML, the eXtensible markup Language, is appropriate. Creating a document by transforming elements of another document by matching these elements with transformation rules is exactly the task of XSL, the eXtensible Stylesheet Language [2]. Since XML is becoming very fashionable and benefits from author’s familiarity with HTML, it is a good choice for the language to author the report. XSL is also becoming popular and allows us to separate the formatting for different target audiences, media, etc. from the content and also to reuse styles across different documents, just as we do in LATEX. So, the XML/XSL approach seems to give us the best of all worlds in that it performs the transformation for us. Additionally, XSL allows us to manipulate the entire document from within one of these rules. This is more flexible than the Perl approach we outlined above which can only insert the output of a command at the point in the document that the expression was found. The difficulty is that XSL does not support the ability to invoke S functions or evaluate S expressions. We can overcome this limitation of XSL by embedding S within an XSL translator. We have done this with the XAlan translator developed as part of the XML project within the Apache Software Foundation. This allows the creators of XSL rules to call arbitrary S functions as if they were regular, built-in XSL functions. The results of these function calls can be used as regular values in other XSL expressions or inserted directly into the document being created in the XSL transformation. XSL values can be passed as arguments to these S functions and are converted automatically. We can evaluate expressions and access S values within these that were created via earlier XSL function calls.
Proceedings of DSC 2001
7
With this ability to call S functions to create output, the XML/XSL approach fits all our needs. The author of the report specifies the text of the report and how the different elements are to be displayed in the report. We develop an XSL file which transforms the XML document into the expanded HTML version that contains the output from evaluating the S commands within the document. The author of the report might look something like the following:
Daily Report
There were
nrow(yieldTable) lots produced today. The median lot yield is
median(yieldTable$avg.yield) The idea is that we have XSL rules that convert the XML tags and their contents into the appropriate HTML elements. For instance, the XSL rule that handles the element simply calls R’s date() function and inserts the resulting string into the document in place of the that tag. Similarly, there is a general rule for
 tags whose lang attribute is "S". This evaluates the S expression within that node by calling the r:eval XSL function with that value. This is specified in XSL as    We generate the report invoking our extended version of the XAlan translator with the usual arguments: Sxslt -in report.xml -xsl report.xsl The S functions can return XML (and hence HTML) that can be directly inserted into the document. In this way, we can do the formatting in XSL and/or S, depending on the convenience of each. Support for generating XML output in S is provided by the XML [5] and RSXMLObjects [3] packages.


3.3


Histograms and Tables


We have discussed how we can create output from S that is added to the text of the document or used in XSL expression to control how the text is added and formatted. Next, we look at how we create the graphical and tabular components of the document. The histogram of the average yield of the lots will be shown as an image within HTML. For this, we need to create a PNG file containing the histogram figure and to specify this file as the src attribute. XSL allows us to create the  element. As with any inter-system interface, we have choices as to where we program the computations. And with all programming, we must trade-off complexity for the user with the need for flexibility. We can invoke each of the individual commands


 Proceedings of DSC 2001


8


for creating the histogram image in XSL. Alternatively, we can write an S function and have it perform the different steps and return the name of the file it generated. In this case, it is significantly to use the flexibility of the S language to express this and so we define an S function that creates a histogram image using the name of the variable specified by the caller. The XSL rule to add the image of the histogram is then given as:        The author of the report can position in the document as  where the VARIABLE attribute identifies which variable to use. The contents of the table giving the summary values for the different lots is also generated in S. In this case, the S function returns a string containing the HTML specification of the table. We also note that we have made each of the lot identifiers a link in the HTML document. The action associated with this link is controlled by JavaScript [4] and is used to show the composite or average wafer for that lot in a different frame of the document display.


4


Report Rendering & Interactive Components


Now that we have generated a report, we move to rendering it and allowing the user to interact with it. For example, if the lots have a large quantity of errors or are unusual relative to other days, the engineer may want to investigate a little further. We use Netscape to render the HTML file. Within this, we use HTML forms and JavaScript to control the interactive components. The reader can click on the lot identifier in the table in the summary page of the report. This brings up a new Netscape window 2 which allows the user to select any of the lots and to view not only the basic summary information, but also the distribution of the different error types for the different wafers within that lot. What is interesting about this interface is that its contents are dynamically generated, but in a different manner than the report. Instead, we are using JavaScript to handle the click on the lot identifier and create the new window. Additionally, the names of the lots are dynamically retrieved while the document in the new window is being created. JavaScript obtains these lot names by calling R. The R interpreter is running as a plugin within Netscape. The R interpreter is accessible within JavaScript code as a regular JavaScript variable offering numerous methods by which we can gain access to all the computations in R.


 Proceedings of DSC 2001


Figure 2: Interactive summary of lots.


9


 Proceedings of DSC 2001


10


We create the R interpreter for the page using the  and specifying the appropriate MIME type so that the S plugin is invoked. We initialize the R interpreter so that it can find the functions in the wafer library and also access the lot data associated with this report. We do this by specifying an S expression as the value of the INIT attribute of the  tag. We can now use the R interpreter within JavaScript code to create the contents of the interface and also in the event handlers. We create the choice menu by having JavaScript ask R for the names of the lots and then iterating over the array that R returns and using JavaScript’s facilities for creating the contents of a a choice menu ( elements). A JavaScript function to do this is the following function addLots(selectMenu) { var ids = document.seval.call("getLotIds"); for(var i = 0; i < ids.length; i++) { selectMenu.options[i] = new Option(ids[i]); } } The caller provides the selection menu to which the new entries should be added. Since there is only one R evaluator in the page, we hard code its JavaScript name as document.seval. To get the names of the lots, we invoke the S function getLotIds(). The call() method acts much like the do.call() function in S, but from within JavaScript, and allows us to call the specified function. In this case, there are no arguments. The return value is a character vector in S which is converted to a JavaScript array. And so now, we add an entry for each element in this array. For those more comfortable programming in S rather than JavaScript, we should note that we could just as easily have programmed the function in S and had it add the options selection menu. We can pass JavaScript objects such as the select menu to S and it can then access the members/fields of that object and also invoke its methods. This again, allows one to program in whichever language is most convenient. We specify JavaScript code for the event that the user chooses an lot in the  menu. This determines which lot was selected and then calls a JavaScript function, displayLotInfo(), to display the summary information. This queries S for the minimum, maximum and average wafer yield for that lot and then inserts these into the  elements in the top frame of the display. It then has S compute the table of error type frequencies and displays this by looping over the elements of the table and adding each as an entry in a simple HTML unordered list (). Note that these are displayed in a different frame within the window so that we can have dynamic text. Again, we can have S handle more of the computations and use JavaScript only to catch the event and hand control to S with the necessary JavaScript objects. We can perform exactly the same computations in S as we do in JavaScript. Additionally, just as we did when generating the report via the XSL rules, we can have S create the HTML to be displayed as an S character vector and then add that to


 Proceedings of DSC 2001


11


the frame’s document. So we have many choices in how we implement the different pieces of the application.


4.1


Graphics


To this point, we have only discussed using S to compute values that we display as text form. Of course, the graphics facilities in R and S-Plus are a powerful and attractive aspect of the environment and ideal for inclusion in reports. One might consider using R to generate plots in files and then dynamically adding these to the display. This can be done quite easily using the jpeg() or png() graphics devices and JavaScript’s ability to dynamically set the SRC attribute of an image element. We use this in 2 to create the figure in the lower right corner. This approach is adequate but unsatisfactory. It is hard to preserve get the size in R to match the available size in the HTML document and to preserve the aspect ratio. Perhaps the most important drawback is that the plots require the use of local files and are fixed/static. A different approach is to embed one or more R graphics devices directly into the HTML document, in the same way that we can embed the R interpreter. We can use the  tag to create an instance of the R graphics plugin. We use the MIME type app/x-sgraphics. Again, we can associate each instance with a JavaScript variable and invoke the different methods that each device provides. These can be used to display arbitrary S plots. We can change their contents at any point in time and in this sense, the devices can be considered live components. In our example, we use these graphics plugins to display a visual representation of the “average” wafer of a lot and also to show all the individual wafers within that lot. The RWafers library provides facilities for drawing individual wafers. We create a document that provides a choice menu to allow the user select a lot. Selecting a lot updates the two graphical displays showing the average wafer for that lot and the array of individual wafers. The result is displayed in figure 3


4.2


Other Interactive Component Types


We can use a variety of different components that are not available in HTML forms. For example, we can use any of Java’s AWT components including sliders, buttons, text widgets, etc. The Swing classes are also available in many browsers as a plugin. Similarly, the Tk widgets can be used via the Tcl plugin. The “magic” by which this inter-communication works is via LiveConnect [1]. This is Netscape’s facility for allowing plugins to be accessible from JavaScript and vice-versa. This also allows plugins to communicate with each other.


5


Embedding S in Databases


The interactive document we described above requires that the wafer data be loaded into the local R session within the Netscape browser. In many situations, it would be preferable to have the data within a remote database and to have the computations


 Proceedings of DSC 2001


Figure 3: Using R graphics devices as Netscape plugin components


12


 Proceedings of DSC 2001


13


done there. We can of course do this, but that requires rewriting much of the code developed in the RWafers in C so that it can be integrated into the database. A better and more feasible approach is to use the REmbeddedRPostgres [7] package. This allows S functions to be used within a Postgres server as if they were first-class, built-in SQL functions. Clients of the database server can invoke these functions within SQL statements. This is another example of the flexibility introduced by embedding one system within another. In this case, the data management is performed within the specialized database server and the statistical environment has access to the data and performs the specialized statistical computations.


6


Future Work


There are a variety of other places in which we might consider embedding R. Languages such as Python, Dylan, Visual Basic, etc. are obvious candidates. Other applications such as Gnumeric, SciGraphica are also interesting. We need multiple interpreters or concurrency within the S language and the implementations. This will allow different instances of the S interpreter to be used within an application. This does not require parallelism, but merely the ability to have multiple evaluations be interleaved. We also need the S implementations to be thread-safe so that we can embed them within threaded applications. We need a security model that can allow us to embed S within other systems and limit what user-level code can access, e.g. files, processor time, memory, etc.


7


Summary


It is important to recognize that while we have focused on the idea of report generation, the ideas of using XML and JavaScript within HTML are more widely applicable. The XSL translation tool allows for reproducible documents that can also be run with different inputs to examine different scenarios. The dynamic HTML and JavaScript facilities should greatly facilitate developing multi-media educational material that uses statistics. Also, they allow one to create research papers that are interactive and encourage readers to use their own data or explore the results under different circumstances. The idea of embedding is more general than report generation and is becoming more common. It is important that we provide our statistical software to others in a form that they can use. Allowing developers using other language to access the functionality we provide, without them having to understand the details will make the work that we do more widely accepted. The example has introduced numerous languages: XML, XSL, HTML, JavaScript, S, Java, C. Instead of using Java to create the interactive components, we might also use the Tcl/Tk plugin, introducing yet another language. While this may seem daunting, it is in fact a benefit. One can choose to do the programming and evaluate the computations in any of these different languages. We do not require programmers to know all of these languages, but permit them to use any of these


 Proceedings of DSC 2001


14


languages that they deem appropriate. This gives people more flexibility to balance the different constraints involved in development (e.g. familiarity, maintainability, efficiency, portability, etc.). The idea is program once, invoke anywhere


Figure 4: Overall Summary Page. The text in blue and the plot and table are computed in S.


References [1] The Liveconnect/Plug-in Developer’s Guide. URL, http://home.netscape. com/eng/mozilla/3.0/handbook/plugins/index.html, March 2001. [2] Neil Bradley. The XSL Companion. Addison-Wesley, 2000. [3] Robert Gentleman Duncan Temple Lang. RSXMLObjects: Reading and writing S objects in XML. URL, http://www.omegahat.org/RSXMLObjects, March 2001. Omegahat package for R and S-Plus.


 Proceedings of DSC 2001


15


[4] David Flanagan. JavaScript: The Definitive Guide. O’Reilly & Associates, Inc., 1997. [5] Duncan Temple Lang. The XML parser for S. URL, http://www.omegahat. org/RSXML, December 1999. [6] Duncan Temple Lang. Direct interface between the S and Perl languages. URL, http://www.omegahat.org/RSPerl, November 2000. [7] Duncan Temple Lang. R Embedded within the Postgres Database Server. URL, http://www.omegahat.org/RSXML, June 2000.