inference, she must find 3 of these statements that match with a triangle congruence rule (e.g., SSS, SAS,. ASA, AAS). There are 9 choose 3 or 84 possible.
From: AAAI Technical Report SS-92-02. Compilation copyright © 1992, AAAI (www.aaai.org). All rights reserved.
Emergent Properties and Structural Constraints: Advantages of Diagrammatic Representations for Reasoning and Learning Kenneth R. Koedinger Deparunent of Psychology Carnegie Mellon University Pittsburgh, Pa 15213 Email: koedinger @psy.cmu.edu This paper explores some general issues in diagrammatic reasoning using the domain of geometry as the primary example. Geometry has consistently played an important role as a modeldomainfor studying diagrammaticreasoning and it’s relation to humanand machineproblemsolving. In one of the early Artificial Intelligence papers, Gelernter (1963) showed how problem diagram could help prune backward search in geometrytheorem proving. Morerecently, in an article by Larkin and Simon (1987), which has been a real driving force of much of the current interest in diagrammaticreasoning, the authors turn to geometryas one source of evidence for their claims about the advantages of using diagrams in reasoning. Others have explored the role of visual images in geometric reasoning (Furnas, 1990; Kim, 1989) and learning (Suwa & Motoda, 1991). Without setting out to do so, we have found ourselves contributing to this literature as well. In trying to account for the abstract planning behavior of geometry experts, we discovered that a diagram-based representation provided a muchbetter explanation of this behavior than the standard, sententially-based approaches to abstract planning (Koedinger & Anderson, 1990). Webuilt a computer simulation called DC(the Diagram Configuration model)to demonstratethis. Westart the paper by summarizing the work of Larkin and Simon (1987) in characterizing the advantages for diagrammatic representations. Then drawing upon our own experience and the history of research in geometryproblem solving, we elaborate on these issues and, in particular, discuss in more detail someadvantages that were not fully addressed in Larkin and Simon. While there has been much said about the role of diagrams in problem solving, we also discuss their role in learning and in shaping the representations that result fromthis learning. ADVANTAGES OF DIAGRAMS Review of Larkin and Simon In their paper "Whya Diagram is (Sometimes) Worth Ten Thousand Words", Larkin and Simon present a frameworkfor understanding the role of diagrams in problemsolving. In particular, they contrast the use of diagrammatic and sentential representations. A representation is composed of a data structure that stores states or steps of problem solving and a programthat can interpret and modifythis data structure. Theydefine
151
sentential and diagrammaticrepresentations as follows (p. 68): ¯ A sentential representation has a data structure "in which elements appear in a single sequence" like the words and sentences in a text or the written steps in a problemsolution. ¯ A diagrammaticrepresentation has a data structure "in which information is indexed by twodimensional location" like the components of a diagram. The task is to explain when and why diagrammatic representations are more computationally efficient than sentential representations that contain the same information. Larkin and Simon(1987; p.98) list three reasons "why a diagram can be superior to a verbal description for solving problems": ¯ Locality aids search: "Diagramscan group together all information that is used together, thus avoiding large amountsof search for the elements needed to makea problem-solving inference." ¯ Symbolic labels unnecessary: "Diagramstypically use location to group information about a single element, avoiding the need to match symbolic labels." ¯ Perceptual ease: "Diagramsautomatically support a large numberof perceptual inferences, which are extremely easy for humans." The next three sections cover these three points. Eaeh section starts by reviewing the arguments madeby Larkin and Simon and finishes with qualifications and/or extensions to these points. Locality Aids Problem Search as well as Knowledge Search Locality and KnowledgeSearch. A familiar strategy of high school geometry students is to record proof steps by markingthe problemdiagram (see Figure 1) an alternative to writing them down in standard statement notation (see Table 1). Such an annotated diagram aids students in holding together information that they need to makefurther inferences. In contrast, information within a list of written statements maybe visually separatedand require search to identify. For instance, to use the side-angle-side rule for inferring triangle congruence a problem solver must locate three congruence relationships - two between corresponding sides of the triangles and one between correspondingangles. In searching a list of statements
for these three relationships, one might need to consider numerous possible combinations of three statements that exist in the list. Considerthe situation just before step 10 in Table 1. There are 9 already proven statements that might contribute to the next inference. If the the student is going to makea triangle congruence inference, she must find 3 of these statements that match with a triangle congruencerule (e.g., SSS, SAS, ASA, AAS). There are 9 choose 3 or 84 possible combinations to consider. In contrast, if these relationships are markedon a diagram (see Figure 1), one can quickly identify them since the side-angle-side configuration comestogether in each triangle at a single vertex. Table1. Problemand solution in sentential form. Problem statement in sententialform: "Given AC -~ ADand AXBbisects CXDI prove that ~/CBXM ~/DBX." Solution in sententialform: Statements: Reasons: 1. AC = AD 1.6|ven 2. ~ bisects 2. G|ven 3. CX = DX :3. Oef-b|se©tor (2) 4. AX -- AX 4. Reflex|re 5. AACX--- AAOX S. SSS (1 3 4) 6. Znxc-= ZnXO 6. Cerres=Perts (5) 7. nB.L C"l) 7. Eq-L|near-nngs (5) 8. LBXC --- ZBXD 8. Eq-L|near-nngs (7) 9. BX--- BX 9. Reflex|re 10. ~BCX = ~BOX 10. SnS (3 8 9) 1 I. ZCBX--- ZDBX 11. Cerres-parts (10) Locality and Problem Search. The example above illustrates the role of the diagramin aiding knowledge search - i.e., the search for applicable knowledge.The geometry diagram can also be used to aid problem search - i.e., the use of that knowledgeto search for a problem solution (Newell, 1990). Diagrams can aid problem search or operator selection using the followingheuristic. Physical Distance-Reducing Heuristic: An operation which reduces the physical distance between known and desired objects may also reduce the logical distance betweenthem. Greeno (1978) found that geometry students use this heuristic to solve a certain class of "angle-chaining" problems. Of course this heuristic does not always lead to the shortest logical solution. The problemin Figure 1 provides an example. After concluding that AnCX --- AnDX(see step 5 in Table 1), any three of the corresponding angles of these triangles might be proven congruent. The parts LBXC-- ZBXD(step 6) are closest to the goal and thus, wouldbe the ones selected by the physical distance-reducing heuristic. However,
152
as the reader may have noticed, choosing Lcnx --LDnX can lead to AnCB -- A~nDBand to a more direct solution. Nevertheless, in general this heuristic can lead to a solution more quickly. As an estimate, in this problemthe probability of directly finding any one of the solutions is 50%higher using the heuristic (.17) than it is withoutit (.11). Elaborations on Labelling Issue Larkln and Simon’s second advantage of diagrams is that they "eliminate" the need to keep track of and match symbolic object labels. This is an important consequenceof the locality feature of diagrams (as such it is not really an independentadvantage of diagrams). For example, in the diagramin Figure lb, labels are not necessary to see that the angles markedwith the 11 are part of the two triangles on the right in the diagramthis facilitates the inference from step 10 to 11. In contrast, making this inference in the sentential representation requires the use of point labels. To go from ABCXto ,ZCBX, one has to notice that both contain the same three point labels B, C, and X - this guarantees that ZCBXis a part of,~BCX. Similarly, ZOBXis a part of -*-BOXbecause they share point labels. An interesting twist on this issue is that the conventional labelling notation and formal rule set in geometryis not adequate to facilitate purely sentential reasoning. For example, from the label alone one cannot infer that A~CBXis apart of A~BCn(the bigger triangle) - the angle refers to point X but not to n while the triangle refers to point n but not to X. The claim that diagrammatic representations "eliminate" the need for object labels is too strongly stated. While the point labels in Figure lb are not a necessary part of the diagrammaticsolution (they were provided for reader to see the correspondencewith Table 1), the markings on segments and angles are. Clearly these markings are a type of symbolic label and they serve the samepurpose, "distal access" (Newell, 1990; p. 75), that the symbolic labels serve in a sentential representation. Despite the claim that diagrams group together information that is typically used together, someinformation that is needed together is not grouped together in the diagram. For example, the sides nC and ~m no are needed together as corresponding sides of triangles ,d~ncx and ,dLnDXin order to make the side-side-side inference in step 5. However,they are not grouped together in the diagram, at least they are not any more so than nc and nX which could conceivably be considered as corresponding parts of these two triangles. The single hash markings are a symbolism that directs the grouping together of nc and no. Perceptual Ease and Emergent Properties Perceptual Ease Through Practice. Larkin and Simon’s third claim about the advantages of diagrammatic representations is that diagrams allow
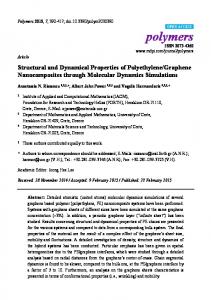
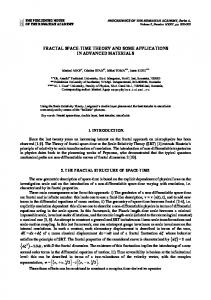
a. Problemin diagrammatic form: c
b. Solution in diagrammaticform: c
D D Figure 1. Diagrammaticversions of the problem and solution shownin Table 1. The numberedmarkingscorrespondwith the steps in the sentential solution. easy perceptual inferences to replace hard symbolic ones. This claim is based on an assumption that perceptual inferences are generally easier than symbolic inferences. While this assumption is probably true, it invites the question: why are perceptual inferences generally easier? In Koedingerand Anderson(1990), expressedthe feeling that "it is unlikely that perceptual inferences are somehowinherently easier (except in terms of the locality heuristic noted above)". Instead, we suggested that often perceptual inferences are more practiced than the correspondingsymbolic inferences and this makes them seem easier. Clearly there are cases where symbolic inferences are easier than perceptual ones, for example, consider someonewhois facile with symbolic logic but less practiced in using Venn diagrams. This person will be much faster doing syllogism problems symbolically rather than diagrammatically. Nevertheless, in manydomains, like geometryand physics, it is clear that most people have had more prior experience with images than with formal notations and they are likely to find perceptual inferences in these domaineasier. Larkin and Simon present an example of a computer simulation in geometry theorem proving to illustrate the "perceptual ease" that is facilitated by diagrammatic representations. It is clear from the example, if not self-evident, that human’s perform many perceptual inferences in this domain with much less effort (e.g., recognizing a triangle in a diagram) than correspondinglogical inferences (e.g., recognizing a triangle from a list of sentential segment representations). However, the example provides no reason to believe that this relative ease is a function of the diagrammaticrepresentation per se -- rather it may simply reflect our relative lack of experience in recognizing geometric figures from a sentential representation. The exampleprovides no computational evidence that a diagrammatic representation would be more efficient than a sentential one. In fact, the computer code that simulated working with these two different representations was identical. Larkin and Simon’s point, of course, was to argue (and convincinglyso) that certain aspects of the process their code simulated are mucheasier for humansto do when given a diagrammatic representation than when given a
153
sentential one. However,the exampledoes not provide any clue as to why diagrammatic representations are easier for humansnor does it provide an indication of whether (or when) picking a diagrammatic representation over a sentential one will lead to a more efficient computationalprocess (apart from the locality feature mentionedabove). Perceptual Ease Through Emergent Properties. Despite our earlier claim in Koedinger and Anderson (1990; see above), I nowthink there is another feature of diagrams besides locality that can lead to more efficient processing as well as provide an alternative to the practice explanation for "perceptual ease" in humans. In the process of drawing a diagram for a given situation, properties may emerge that weren’t described in the original situation. These emergent properties are potential consequences of the given situation that can directly cue inferences that would require morecostly indirect processing in a sentential representation. This emergent-property feature of diagrams was hinted at in the following quote from Larkin and Simon: ’q’he process of drawing the diagrammakesthese new inferences which are then displayed explicitly in the diagramitself." (p. 70) They were referring to inferences mentionedabove, like seeing L 12 I! X is the same as ~ 12 !! A, and modelledwith their "perceptual inference rules". These inferences are basedon the topological relations that are explicit in the diagrammatic data structure, but only implicit in the sentential data structure. In addition to topological relations in diagrammaticdata structures, there are also geometric relations that can lead to useful emergent properties. Whenever one draws a diagram one is making commitments,for example, about the sizes of segments and angles. These are not usually meaningful in any way and, in fact, they are formally irrelevant to validating the generalization to be proven. However, they can be used to guide problemsearch. The Use of Emergent Properties in Geometry. Gelemter’s (1963) GeometryTheorem Proving Machine was perhaps the first system to take advantage of these
emergent geometric properties in diagrams. Gelernter used these properties as a heuristic to prune backward search. A statement (subgoal) generated by the backwardapplication of a rule was comparedagainst the diagram and if it looked false in the diagram it was rejected. This strategy works because in an accurately drawndiagram(i.e., one where the givens are true), all statements that could be proven will look true. In other words, the diagram can provide a counter-example to statements conjectured in backwardreasoning. Table2. The input to DCfor the problemabove. a. Problemdiagram input (Figurela): ( i ine (line ( iine (line (line (line (point
LINE-DXC LINE-AXB
points points points points
(D (A (B (D
X C) X B) C) B)
LINE-BC LINE-DB LINE-DA points (D A) LINE-AC points (A C) A x.coord 70 y.coord
(point (point (point (point
D C B X
x.coord x.coord x.coord x.coord
123 y.coord 123 y.coord 210 y.coord 123 y.coord
83
)
127) 39 ) 83 ) 83 )
Prob~msm~ment input (Tab~l a): (problem pl givens ((congruent (bisector goal
(congruent
(segment A (segment A D) (segment A X
(segment C X D))) (angle C B (angle D B X))
While Gelernter’s program used the diagram to prune states that were generated from a sentential representation of the formal rules, essentially we have flipped these roles in our model of geometry problem solving (DC; Koedinger & Anderson, 1990). In DC, the diagram is used to generate states and formal knowledge of the domain is used to prune them. Putting more knowledgein the state generator leads to more efficient problemsolving.
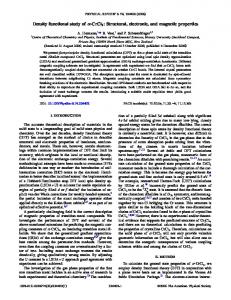
Table 3 shows the output of DC’sdiagram parsing and conjecturing componentsfor the problem in Figure 1. The input to this process is shownin Table 2a. The first part of Table 3 showsthe results of DC’s"diagram parsing", that is, the identification of objects that are constrained by the topology of the diagram. Diagram parsing is done using only the information in the line objects of Table 2a (the point positions are not necessary). This step is basically equivalent to Larkin and Simon’s perceptual enhancement, it produces the objects (like segments, angles, and triangles) that are "perceptually obvious"(p. 88). The next step "configuration conjecturing" makes use of geometric relations in the diagram, these result from the point positions specified in the point objects in Table lb. DCuses this information to measure the sizes of segmentsand angles and then makesconjectures about various geometric configurations. These are tentative conclusions that indicate possibly (though not necessarily) provable states in the problem space for this problem. (It is only because of the compactnature of DC’srepresentation, discussed below, that it is able to enumerateall of these states.) DCrecognizes 14 configurations in this problem and, in the process of recognition, connects them with other configurations based on overlapping parts. The result is a network, most of which is shownin Figure 2 (the remainder is not relevant to the solution of this particular problem). The task of the problem solver at this point is to search through this network to find a logically valid connection between the problem givens and the goal. DC’s problem input is a combination of diagrammatic(Table 2a) and sentential (2b) forms is consistent with the way problems are usually presented in geometry textbooks. The sentential information about the problem givens and goals is used at this point in the problem solving where the search starts. Integrating the configuration conjecturing and search processes wouldprovide for a more accurate and efficient model, but by separating themwe were able to identify the individual contribution of each. The search
Table3. DC’sdiagramparsing and configuration conjecturing given Table 2a. DIAGRAM PARSINGz Segments: (SEC-AC SEG-DA SEC-DB SEG-BC SEG-AB SEG-AX SEG-XB SEG-DC SEG-DX SEG-XC) Angles: (