EMI-aware Central Processing Point Deployment for Wireless Networks in Hospitals. Nick Majedi, Muhammad Naeem, Khwaja Ahmed Shaharyar and Alagan ...
EMI-aware Central Processing Point Deployment for Wireless Networks in Hospitals Nick Majedi, Muhammad Naeem, Khwaja Ahmed Shaharyar and Alagan Anpalagan WINCORE Lab, Ryerson University, Canada
Abstract—In this paper, we introduce an approach to jointly minimize energy consumption of wireless transmitters and the harmful interference on sensitive medical devices, and optimize the central controller placement for collecting data from transmitters. More specifically, a multi-objective non-convex mixedinteger non-linear programming (MINLP) problem is defined and formulated to optimize transmit power of wireless users and central processing point (CPP) deployment along with guaranteeing minimized EMI to comply with the immunity level of medical devices. To solve this problem, an important step is to convexify it. Then we propose the use of a standard branchand-bound algorithm. Also the program is coded in MATLAB with the help of OPTItoolbox to find the optimal solution. To conduct a numerical result analysis, we considered different cases within a single floor of a hospital and a few scenarios for a twostorey hospital building. Our results show the improvement in throughput and guaranteed immunity for medical devices, when the proposed formulation is deployed along with a branch-andbound algorithm. Index Terms—e-Healthcare, central controllers, electromagnetic interference, global optimization.
I. I NTRODUCTION -Healthcare is the integration of digital data processing, computing and communications technology into the traditional healthcare services [1]. One of the important characteristics of e-Healthcare is that patient data must be available to caretakers in real-time without the constraints of time and location. This is referred to as pervasive health monitoring [2]. There is a wide variety of services offered under eHealthcare framework. There have been lots of research activities over the last decade in computerized e-Health service delivery mechanisms with the use of ICT technology. One of the widely used services of e-Healthcare is in-hospital monitoring which comprises of vital signs monitoring, electrocardiography, capnography, child birth monitoring, blood pressure, glucose and flow monitoring, body temperature monitoring, etc. Some of the used devices for these purposes transmit realtime wireless data which should access the channel whenever they have data available, such as telemetry devices. A significant amount of related work done in this area deals directly with improving data rate and minimizing delay. In this paper, we focus on providing coverage and lowering the electromagnetic interference by considering the optimal deployment of central processing units. In the proposed scheme, the transmission power of medical devices is minimized
considering that they should be higher than a minimum value to meet QoS requirements. One of the motivations of this research is the importance of optimal deployment of central processing points (CPPs) in field hospitals. Also, wireless devices within hospitals can cause harmful electromagnetic interference to medical devices and we are looking to mitigate this unwanted effect. This interference can cause faulty readings of medical devices, malfunctioning, or even restarting and shutting these devices down. Optimal CPP deployment ensures network coverage and improves power consumption of wireless users so that their lifetime is increased. The application of CPP deployment is not limited to field hospitals and expands to large hospital buildings of multiple floors, clinics, and other health centers. The rest of this paper is organized as follows. In the next section, we will describe the system model and the hospital environment along with the assumptions made throughout the process. Section III introduces the problem formulation and section IV touches on optimization approach. In section V, we present numerical results and section VI concludes this paper.
E
978-1-4799-3972-5/14/$31.00 ©2014 IEEE
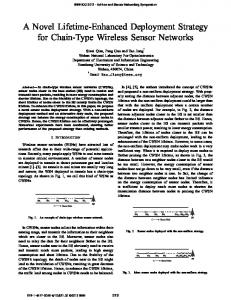
II. S YSTEM M ODEL A. Hospital Environment We consider a hospital building with F(≥ 1) floors and multiple service areas (SA) in each floor. A service area is defined as a region of a floor where wireless users and devices operate. Figure 1 shows a typical multi-storey hospital building with wireless devices. In order to collect data from users (wireless transmitters), CPPs are installed in each floor. There can be more than one CPP in each floor. One service area can only be covered by one CPP. However, a CPP can cover multiple service areas. In other words, users within an SA can transmit their data to only one CPP. On the other hand, one CPP can receive data from users of more than one SA. To protect medical devices from electromagnetic interference (EMI), protected areas are defined in the middle of SAs. EMI sensitive medical devices are only allowed to operate in protected areas. Examples of these devices are defibrillators, incubators (as life-supporting devices) infusion pumps and ECG monitors (as non-life-supporting devices) [3]. Users are considered to have devices with wireless transmission, for example telemetry devices. CPPs control the wireless transmission of users and collect their data. CPP
173
TABLE I: Notations Notation M N K ˆ K F D (un , vn , wn ) (xm , ym , zm ) h η ε α Emax
pn pmax pˆ Z I dˆnk anm Ω(zm , wn )
Ω0 , Ω1
Definition Number of central processing points (CPPs) Number of service areas (SAs) Number of users in each SA ˆ = Number of users in the whole building (K N × K) Number of floors An N × M matrix containing the distances between CPPs and SAs Coordinates of the center of the SA n Coordinates of CPP m The height of each floor Average height of a user Floor attenuation factor constant (depends on the environment) Path loss exponent Maximum allowed electric field from transmitters measured in the middle of protected area Transmission power of the user in nth SA that is furthest away from its associated CPP The maximum transmission power limit of every user Minimum received power at CPP for all users The constant from the free-space impedance of a protected device The immunity level of a device at the center of protected area The distance between the k th user in nth SA from the center of protected area An N × M association matrix where anm ∈ {0, 1} An indicator function: � Ω0 , zm = w n Ω(zm , wn ) = Ω1 , zm 6= wn
Fig. 1: CPP placement in multi-storey buildings.
Constants depending on the specific environment
placement optimization in hospitals is important as it has a direct impact on the power consumption of the users. In other words, we want to optimize uplink power of users and network coverage in hospitals. In our problem, we aim to determine the coordinates of CPPs (i.e., x, y and z) and meet the QoS requirement of each user. This model considers floor attenuation factor (FAF) and CPP installation restrictions and translates to minimizing the worst user’s transmission power (a min-max problem). QoS is defined as satisfied data rate. This can be translated into a minimum threshold for received power of each user at the CPP. In section III we will discuss how we reflect interference avoidance in our modeling for devices in protected areas. B. Transceiver Model
transmissions so that multiple users can transmit at the same time to one CPP. Let pn be the transmission power of a user in the nth SA that is located in the furthest distance from its associated CPP. This concept is shown in Figure 2. This figure illustrates a typical SA in a horizontal plane in which, point B is the furthest away from the mth CPP. We consider the furthest point because the transmission power of a user in this location would be the maximum transmission power of all users in that SA in order to accommodate QoS. We define a guard area around the protected area according to the maximum transmission power limit of users (pmax ). To satisfy the QoS requirements of users, we define pˆ as the minimum power received at a CPP from each user. If the received power at a CPP for a user is greater than this value, then the signal-to-interference-plus-noise ratio (SINR) requirement of users is met. That is: SIN Rk ≥ SIN Rreq ∀k. According to Figure 2, the distance between the mth CPP and nth SA is obtained using the following equation. Dnm shows the element of matrix D in nth row and mth column:
Each CPP has its own frequency band not to interfere with adjacent CPPs. SAs operate on orthogonal channels to avoid co-channel interference. Therefore, when two or more SAs are connected to one CPP, transmissions from one SA will not harm those of other SAs connected to the same CPP. Within SAs, multiple access schemes are deployed for user
174
Dnm =
h� 1 �2 � |xm − un | + Ln + |ym − vn | + 2 i 12 +|(zm − wn + 1)h − η|2 ,
�2 1 Wn 2 ∀m, n, (1)
s.t. λ ≥ pn ,
∀n.
(3)
In order to accommodate QoS for users at a certain data rate, the received power level of users at their associated CPP must be more than a certain threshold: pn ≥ pˆ, α ε|zm −wn | anm Ω(zm , wn )Dnm
Fig. 2: Horizontal projection of a typical SA and its associated CPP. C. Channel model One of the key components to channel response is path loss. When modeling path loss for a channel, different factors should be considered with the most important being the attenuation factor. A very simple channel can be considered as the free space line of sight when there are no obstacles between transmitter and receiver. In this case, transmitted signal attenuates before getting to the receiver due to energy loss. In theory, this loss is proportional to the inverse of square of the distance. However, as will be introduced in section III, we consider a path loss exponent, α, because in practice power attenuates more quickly, typically proportional to inverse of 4th power of the distance [4]. As mentioned earlier, SAs operate in non-overlapping channels, meaning that they use FDMA for instance and do not cause interference to each other’s transmission. Within SAs, simultaneous user transmissions can be achieved using orthogonal channels (such as using time, frequency or code). The additive white Gaussian noise (AWGN) is negligible in our model. III. P ROBLEM F ORMULATION In this paper, we focus on jointly optimizing the power consumption of nodes and CPP deployment, considering that the QoS requirements must be met and electromagnetic interference (EMI) on medical devices must be minimized. We assume that each transmitter is assigned an orthogonal frequency band. Channel assignment is a vast discussion and is beyond the scope of this work [5]. According to the model described in section II, following discussion formulates our problem. For optimizing the lifetime of nodes, we need to minimize the maximum transmission power originating from the service areas: Min {Max {pn }}. This can be translated into two statements with the help of an auxiliary variable, λ: Minimize λ
(2)
∀n, m,
(4)
where Ω(zm , wn ) is an indicator function whose value depends on zm and wn and is defined in Table I. ε is the floor attenuation constant which also depends on the environment and D is the distance between the corresponding CPP and SA and is calculated using the equation in (1). (see [6], Appendix A for how to calculate ε). anm is an association matrix that can be formulated as: M X
anm = 1,
m=1
∀n.
(5)
In order to reflect interference avoidance in our modeling for devices in protected areas, consider the following equation for calculating the electric field from transmitters to the middle of a protected area [3]:
E=
√ Z pn , dˆnk
(6)
where E is the electric field measured at the middle of the protected area, Z is the constant from the free-space impedance of a protected device, and dˆnk is the distance between the k th user in the nth SA from the center of the protected area. To convert (6) to a convex constraint we can rewrite it as: √ Z pn Emax ≥ . (7) dˆnk Further we can rewrite (7) in terms of transmission power:
0 ≤ pn ≤
�
Emax dˆnk Z
�2
.
(8)
Constraint (4) contains binary variable anm and constraint (1) contains non-convex elements. Therefore, we have a mixed integer non-convex programming problem which is generally NP-hard to solve [7]. We have transformed this problem into an equivalent mixed integer convex problem. The respective steps are not shown in this paper due to space limitation. Thus following comes the equivalent reformulation for the initial
175
problem: Minimize
xm ,ym ,zm ,pn ,anm
λ
(9)
s.t. λ ≥ pn ,
∀n,
F X
Ω1 τnm pˆ
(10) m γfm ε|f −wn | + Ω0 τnm pˆγw n
f =1,f 6=wn
− (1 − anm )Unm − pn ≤ 0, α 2
τnm ≥ ∆nm , zm =
F X
f γfm ,
f =1 F X
γfm = 1,
(11)
∀m, n,
(12)
∀m,
(13)
∀m,
f =1 M X
∀m, n,
anm = 1,
m=1
(14)
∀n,
(15)
0 ≤ pn ≤ pmax , ∀n, � �2 ˆ Emax dnk 0 ≤ pn ≤ , ∀n, k, Z � �2 1 �2 � 1 Xnm + Ln + Ynm + Wn 2 2 + (hzm − [(wn − 1)h + η])2 − ∆nm ≤ 0, IV. S OLUTION
OF THE
(16) (17)
∀m, n. (18)
O PTIMIZATION P ROBLEM
According to our formulation in (9-18) and based on earlier discussion, our problem is a convex mixed integer nonlinear programming (MINLP) problem. One of the practical algorithms for solving MINLP problems is the branch and bound algorithm. Therefore, the solution procedure we propose is based on a branch and bound framework. We employ OPTimization Interface Toolbox in MATLAB, which consists of different solvers. The idea behind branch and bound algorithm helps us compute a global lower bound (LB) for our optimization problem and the solution is obtained using it. V. S IMULATION R ESULTS In this section, we provide results from numerical simulation and analysis of the proposed formulation and solution. In the simulation setup, the length, width and height of each floor are 60, 40 and 3 meters respectively. Later on, the effect of the floor height on the users’ transmission power will be investigated. Emphasizing on the intuitiveness of the results, for all the SAs, the length and width will be considered the same at the beginning. Each SA will be 30 meters long and 20 meters wide. Therefore, we can have 4 SAs of the same size on each floor. It will be assumed that each SA has only one user which requires the maximum transmission power of all the users within that SA. It is then translated to the user located the
furthest away from its associated CPP. Thus, from this point on, transmission power of users in an SA will be referred to as the transmission power of that SA. By running the program in MATLAB we aim to get the coordinates of the CPP(s), as well as the transmission power of each SA and association of the SAs to CPPs. In our path loss model, in order to accommodate QoS, the received power of an SA at its associated CPP should not be less than 100dBm. To reflect this, we assume that pˆ = 10−10 mW. The maximum power level for IEEE 802.11g-based radio devices is 30mW when using OFDM. Therefore, we let pmax be 30mW. On the other hand, considering EMI avoidance limits the maximum transmission power of SAs as well. The maximum electric field experienced by devices in the protected area should not exceed their EMI immunity level. This electric field is imposed by the users within the SA. If we assume having one user at each SA, this field is at its maximum when the transmitting user is on the border of the guarded area. With the radius of the guarded area being 3 meters, it makes sense for our simulation to have an immunity level of I = 1 for sensitive devices in the center√ of protected area. IEC 60601-1-2 specifies Z to be equal to 23 Ω for life-supporting devices, between the frequencies 800 MHz and 2.5 GHz [3]. Under these values, the transmission power of users is further limited to a maximum of 17mW. Thus if we relax the EMI constraint for a specific room, the value of pmax = 30mW will be taken into account. Table II contains results for when we have one CPP. The channel model, as explained in subsection II-C, is considered a free space line of sight environment, when there are no obstacles between transmitter and receiver. The attenuation factor of a typical interior wall at hospitals is 7dB on average, compared to that of a concrete wall which is 12dB on average. This will impose deployment of more CPPs within a floor in order to accommodate the power limits of users and the QoS. The consumption power highly depends on the distance of a transmitting user from its associated CPP. In this part, we examine the effect of the floor height on the transmission power of an SA. As can be seen in Figure 3, power has increased for all the cases when we changed the height from 2.5 to 3 and 3 to 3.5 meters. Next we investigate the effect of penetration loss through one floor. We assumed a single service area with a length of 30 meters and width of 20 meters on the second floor. In the program, we forced one CPP to be on the first floor and the other on the second floor. With the floor attenuation factor for one floor separation being equal to 16.2 dB, the simulation TABLE II: Numerical results for when there is one CPP for different number of SAs
176
λ Coordinates of CPP (x,y) Association
1 SA 68.28 µW (15,10)
2 SAs 649.9 µW (15,20)
3 SAs 1.073 mW (27.36,18.24)
4 SAs 1.201 mW (30,20)
{1}
{1,1}
{1,1,1}
{1,1,1,1}
−3
x 10
Transmission Power of Users in Watts
1.2
h=2.5 h=3 h=3.5
1
0.8
0.6
0.4
0.2
0 1
2
Number of SA’s
3
4
Fig. 3: Effect of height of the floor on maximum transmission power required by the user of an SA, located at the furthest point from its associated CPP, for different number of SAs. TABLE III: Numerical results for when there are two CPPs for different number of SAs λ Coordinates of CPPs (x,y) Association
2 SAs 68.37 µW (15,10),(15,30)
3 SAs 649.51 µW (15,20),(45,10)
4 SAs 649.88 µW (15,20),(45,20)
{1,0,0,1}
{1,0,1,0,0,1}
{1,0,1,0,0,1,0,1}
results returned the assignment of the CPP on the second floor to the SA. When the value of the floor attenuation factor was reduced to 1 dB, the results showed a different assignment as expected. As the distance between the SA and the CPP right below it on the first floor, is less than that of the CPP on the second floor, the SA was associated with the CPP on the ceiling of the first floor. In case we have one SA in the second floor and force it to connect to the CPP right below it on the ceiling of the first floor, the power consumption significantly increases. The results gave us a value of 2.493 mW for this SAs transmission power which is significantly higher than other users’ transmission power. An important focus of this research is on providing immunity assurance for EMI sensitive medical devices. For this, we investigate the effect of the immunity level of such sensitive devices. Let the radius of a guard area to be 0.1 of the length of the SA. In the example of SAs with 30 meters length and 20 meters width, the radius of guard areas will be 3 meters. Medical devices have different sensitivity threshold. Some of these devices are life-supporting with a lower threshold and some are non-life-supporting with a greater threshold. The lower the immunity level of devices are, the lower the electric field around them should be. To address this, maximum transmission power limit of users is manipulated. If we need to accommodate highly sensitive devices, the power limit in our program is further reduced.
As mentioned earlier, the immunity level of medical devices was considered to be I = 1 throughout the simulation. Also, Z was considered to be 23 for life-supporting EMI sensitive devices. Let us now assume that we reduce the immunity level 5 times, keeping all other variables untouched. With I = 0.2, a new upper bound for pn in (34) can be calculated: pn ≤ 680µW. The value of 680µW for power limit is interesting because it is in between the obtained values for λ when number of CPPs increase from one to two. For the case of having one CPP, running the simulation with the new values and logging the results from iterations, showed that there is not an optimal solution for this setup. At this point, it made common sense to increase the number of CPPs in order to reduce the maximum transmission power of wireless users. The optimal results were obtained having two CPPs and value of 651µW was returned as the result for objective function, λ. VI. C ONCLUSIONS In this paper, an approach to solve a multi-objective problem of EMI-aware central processing point (CPP) deployment for wireless sensor networks in hospitals, was presented. The proposed method formulates a non-convex mixed-integer nonlinear programming (MINLP) problem. This simulation study shows that the more sensitive the medical devices are to the EMI, the lower the power limit of wireless transmitters. Therefore, as we only consider the uplink power in our problem, one good resolution would be increasing the number of CPPs which results in reduction of average uplink transmission power. Our numerical results confirm the compliance of transmission power of wireless users with the constraints imposed by EMI mitigation, CPP deployment scheme, path loss model and CPP association model. It was shown that the number of deployed CPPs increase, as the EMI constraint becomes more stringent and path loss model becomes more complicated. R EFERENCES [1] Y. He, W. Zhu, and L. Guan, “Optimal resource allocation for pervasive health monitoring systems with body sensor networks,” Mobile Computing, IEEE Transactions on, vol. 10, pp. 1558 –1575, nov. 2011. [2] U. Varshney, “Pervasive healthcare and wireless health monitoring,” Springer Science + Business Media, LLC, vol. 12, pp. 113 –127, jul. 2007. [3] P. Phunchongharn, E. Hossain, and S. Camorlinga, “Electromagnetic interference-aware transmission scheduling and power control for dynamic wireless access in hospital environments,” Information Technology in Biomedicine, IEEE Transactions on, vol. 15, no. 6, pp. 890–899, 2011. [4] J. Miranda, R. Abrishambaf, T. Gomes, P. Goncalves, J. Cabral, A. Tavares, and J. Monteiro, “Path loss exponent analysis in wireless sensor networks: Experimental evaluation,” in Industrial Informatics (INDIN), 2013 11th IEEE International Conference on, pp. 54–58, 2013. [5] J. Liu, Y. Hou, and H. Sherali, “Routing and power allocation for mimobased ad hoc networks with dirty paper coding,” in Communications, 2008. ICC ’08. IEEE International Conference on, pp. 2859–2864, 2008. [6] J. Liu, T. Kou, Q. Chen, and H. Sherali, “Femtocell base station deployment in commercial buildings: A global optimization approach,” Selected Areas in Communications, IEEE Journal on, vol. 30, no. 3, pp. 652–663, 2012. [7] H. Hsieh, S. Wei, and C. Chien, “Optimizing small cell deployment in arbitrary wireless networks with minimum service rate constraints,” 2013.
177