EMOTION IN SPEECH: RECOGNITION AND APPLICATION TO CALL CENTERS VALERY A. PETRUSHIN Andersen Consulting 3773 Willow Rd. Northbrook, IL 60062
[email protected]
ABSTRACT The paper describes two experimental studies on vocal emotion expression and recognition. The first study deals with a corpus of 700 short utterances expressing five emotions: happiness, anger, sadness, fear, and normal (unemotional) state, which were portrayed by thirty non-professional actors. After evaluation a part of this corpus was used for extracting features and training backpropagation neural network models. Some statistics of the pitch, the first and second formants, energy and the speaking rate were selected as relevant features using feature selection techniques. Several neural network recognizers and ensembles of recognizers were created. The recognizers have demonstrated the following accuracy: normal state - 60-75%, happiness – 6070%, anger – 70-80%, sadness – 70-85%, and fear – 35-55%. The total average accuracy is about 70%. The second study uses a corpus of 56 telephone messages of varying length (from 15 to 90 seconds) expressing mostly normal and angry emotions that were recorded by eighteen non-professional actors. These utterances were used for creating recognizers using the methodology developed in the first study. The recognizers are able to distinguish between two states: “agitation” which includes anger, happiness and fear, and “calm” which includes normal state and sadness with the average accuracy 77%. An ensemble of such recognizers was used as a part of a decision support system for prioritizing voice messages and assigning a proper agent to response the message. The architecture of the system is presented and discussed.
INTRODUCTION
This study explores how well both people and computers in recognizing emotions in speech. The first monograph on expression of emotions in animals and humans was written by Charles Darwin in the last century (Darwin, 1965 (1872)). After this milestone work psychologists have gradually accumulated knowledge in this field. A new wave of interest has recently risen attracting both psychologists and artificial intelligence specialists. There are several reasons for this renewed interest such as: technological progress in recording, storing, and processing audio and visual information; the development of non-intrusive sensors; the advent of wearable computers; the urge to enrich human-computer interface from point-and-click to sense-and-feel; and the invasion on our computers of lifelike agents who supposed to be able express, have and understand emotions ( Elliot and Brzezinski, 1998). A new field of research in
AI known as affective computing has recently been identified (Picard, 1997). As to research on recognizing emotions in speech, on one hand, psychologists have done many experiments and suggested theories (reviews of about 60 years of research can be found in (van Bezooijen 1984; Scherer et al., 1991)). On the other hand, AI researchers made contributions in the following areas: emotional speech synthesis (Canh, 1989; Murray and Arnott, 1993), recognition of emotions (Dellaert et al., 1996), and using agents for decoding and expressing emotions (Tosa and Nakatsu, 1996). MOTIVATION
The project is motivated by the question of how recognition of emotions in speech could be used for business. One potential application is the detection of the emotional state in telephone call center conversations, and providing feedback to an operator or a supervisor for monitoring purposes. Another application is sorting voice mail messages according to the emotions expressed by the caller. Given this orientation, for this study, we solicited data from people who are not professional actors or actresses. We focus on the negative emotions like anger, sadness and fear. We target the telephone quality speech (less than 3.4 kHz) and rely on voice signal only. This means we exclude the modern speech recognition techniques. To achieve our objectives we decided to have two stages: research and development. The objectives of the first stage are the following: to learn how well people recognize emotions in speech, to find out which features of speech signal could be useful for emotion recognition, and explore different mathematical models for creating reliable recognizers. If the results of the first stage will be promising then we will start the second stage which objective is to create a real-time recognizer for call center applications. RESEARCH
For the first stage we had to create and evaluate a corpus of emotional data, evaluate the people performance, and select data for machine learning. We decided to use high quality speech data for this stage. Corpus of Emotional Data
We have asked thirty of our colleagues to record the following four short sentences: "This is not what I expected.", "I'll be right there.", "Tomorrow is my birthday.", and "I'm getting married next week." Each sentence was recorded five times; each time, the subject portrayed one of the following emotional states: happiness, anger, sadness, fear and normal (unemotional) state. Five subjects have recorded the sentences twice with different recording parameters. Thus, each subject has recorded 20 or 40 utterances, yielding a corpus containing 700 utterances with 140 utterances per emotional state. Each utterance was recorded using a close-talk microphone; the first 100 utterances were recorded at 22-kHz/8 bit and the rest 600 utterances at 22-kHz/16 bit.
People Performance And Data Selection
After creating the corpus, we designed an experiment to find the answers to the following questions: How well can people without special training portray and recognize emotions in speech? Which kinds of emotions are easier/harder to recognize? We implemented an interactive program that selected and played back the utterances in random order and allowed a user to classify each utterance according to its emotional content. Twenty-three subjects took part in the evaluation stage, and 20 of whom had participated in the recording stage earlier. Table 1 shows the performance confusion matrix. The rows and the columns represent true and evaluated categories respectively, for example, second row says that 11.9 % of utterances that were portrayed as happy were evaluated as normal (unemotional), 61.4 % as true happy, 10.1 % as angry, 4.1% as sad, and 12.5 % as afraid. We can also see that the most easily recognizable category is anger (72.2%) and the least easily recognizable category is fear (49.5%). A lot of confusion is going on between sadness and fear, sadness and unemotional state, and happiness and fear. The mean accuracy is 63.5 % that agrees with the results of the other experimental studies (Scherer et al., 1991, van Bezooijen 1984). Table 1. Performance Confusion Matrix Category Normal Happy Angry Sad Afraid
Normal
66.3 11.9 10.6 11.8 11.8
Happy
2.5 61.4 5.2 1.0 9.4
Angry
7.0 10.1 72.2 4.7 5.1
Sad
18.2 4.1 5.6 68.3 24.2
Afraid
6.0 12.5 6.3 14.3 49.5
Total
100 % 100 % 100 % 100 % 100 %
The left half of Table 2 shows statistics for evaluators for each emotional category. We can see that the variance for anger and sadness is significantly less than for the other emotional categories. It means that people better understand how to express/decode anger and sadness than other emotions. The right half of Table 2 shows statistics for "actors", i.e. how well subjects portray emotions. It is interesting to see comparing the left and right parts of Table 2 that the ability to portray emotions (total mean is 62.9%) stays approximately at the same level as the ability to recognize emotions (total mean is 63.2%), but the variance for portraying is much larger. From the corpus of 700 utterances we selected five nested data sets which include utterances that were recognized as portraying the given emotion by at least p per cent of the subjects (p = 70, 80, 90, 95, and 100%). We will refer to these data sets as s70, s80, s90, s95, and s100. The sets contain the following number of items: s70: 369 utterences or 52.% of the corporum, s80: 257/36.7%, s90: 149/21.3%, s95: 94/13.4% , and s100: 55/7.9%. We can see that only 7.9% of the utterances of the corpus were recognized by all subjects. And this number lineally increases up to 52.7% for the data set s70, which corresponds to the 70%-level of concordance in decoding emotion in speech. If we look at distributions of utterances among the emotion categories for the data sets we can notice that it is close to the uniform distribution for s70 with ~20% for normal
state and happiness, ~25% for anger and sadness, and 10% for fear. But for the data sets with higher level of concordance anger begins to gradually dominate while the proportion of the normal state, happiness and sadness decreases. Interestingly, the proportion of fear stays approximately at the same level (~710%) for all data sets. The above analysis suggests that anger is easier to portray and recognize because it is easier to come to a consensus about what anger is. Table 2. Evaluators’ and Actors’ statistics
Evaluators’ statistics Category Normal Happy Angry Sad Afraid
Mean
66.3 61.4 72.2 68.3 49.5
s.d.
13.7 11.8 5.3 7.8 13.3
Median
64.3 62.9 72.1 68.6 51.4
Actors’ statistics Min
Max
29.3 31.4 62.9 50.0 22.1
95.7 78.6 84.3 80.0 68.6
Mean
65.1 59.8 71.7 68.1 49.7
s.d.
16.4 21.1 24.5 18.4 18.6
Median
68.5 66.3 78.2 72.6 48.9
Min
Max
26.1 2.2 13.0 32.6 17.4
89.1 91.3 100 93.5 88.0
Feature Extraction
All studies in the field point to the pitch (fundamental frequency) as the main vocal cue for emotion recognition. The other acoustic variables contributing to vocal emotion signaling are (Banse and Scherer, 1996): vocal energy, frequency spectral features, formants (usually only one or two first formants (F1, F2) are considered), and temporal features (speech rate and pausing). Another approach to feature extraction is to enrich the set of features by considering some derivative features such as LPC (linear predictive coding) parameters of signal (Tosa and Nakatsu, 1996) or features of the smoothed pitch contour and its derivatives (Dellaert et al., 1996). For our study we estimated the following acoustical variables: fundamental frequency F0, energy, speaking rate, first three formants (F1, F2, and F3) and their bandwidths (BW1, BW2, and BW3), and calculated some descriptive statistics for them. Then we ranked the statistics using feature selection techniques, and picked a set of most "important" features. The speaking rate was calculated as the inverse of the average length of the voiced part of utterance. For all other parameters we calculated the following statistics: mean, standard deviation, minimum, maximum, and range. Additionally for F0 the slope was calculated as a linear regression for voiced part of speech, i.e. the line that fits the pitch contour. We also calculated the relative voiced energy as the proportion of voiced energy to the total energy of utterance. Altogether we have estimated 43 features for each utterance. We used the RELIEF-F algorithm (Kononenko, 1994) for feature selection. We ran RELIEF-F for the s70 data set varying the number of nearest neighbors from 1 to 12, and ordered features according their sum of ranks. The top 14 features are the following: F0 maximum, F0 standard deviation, F0 range, F0 mean, BW1 mean, BW2 mean, energy standard deviation, speaking rate, F0 slope, F1 maximum, energy maximum, energy range, F2 range, and F1 range. To investigate how sets of features influence the accuracy of emotion recognition algorithms we have formed three nested sets of features based on their sum of ranks. The first set includes the top eight features (from F0
maximum to speaking rate), the second set extends the first one by two next features (F0 slope and F1 maximum), and the third set includes all 14 top features. Computer Recognition
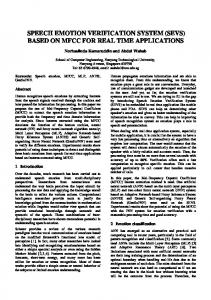
To recognize emotions in speech we tried the following approaches: Knearest neighbors, neural networks, ensembles of neural network classifiers, and set of experts. K-nearest neighbors . This method estimates the local posterior probability of each class by the weighted average of class membership over the K nearest neighbors. We used 70% of the s70 data set as a database of cases for comparison and 30% as a test set. We ran the algorithm for K from 1 to 15 and for number of features 8, 10, and 14. The best average accuracy of recognition (~55%) can be reached using 8 features, but the average accuracy for anger is much higher (~65%) for 10 and 14-feature sets. All recognizers performed very poor for fear ( about 5-10 %). Neural networks. We used a two-layer backpropagation neural network architecture with a 8-, 10- or 14-element input vector, 10 or 20 nodes in the hidden sigmoid layer and five nodes in the output linear layer. To train and test our algorithms we used the data sets s70, s80 and s90. These sets were randomly split into training (70% of utterances) and test (30%) subsets. We created several neural network classifiers trained with different initial weight matrices. This approach applied to the s70 data set and the 8-feature set gave the average accuracy of about 65% with the following distribution for emotional categories: normal state is 55-65%, happiness is 60-70%, anger is 60-80%, sadness is 6070%, and fear is 25-50%. Ensembles of neural network classifiers. An ensemble consists of an odd number of neural network classifiers, which have been trained on different subsets of the training set using the bootstrap aggregation (Breiman, 1996) or the cross-validated committees (Parmanto et al., 1996) techniques. The ensemble makes decision based on the majority voting principle. We used ensemble sizes from 7 to 15. Figure 1 shows the average accuracy of recognition for ensembles of 15 neural networks, the s70 data set, all three sets of features, and both neural network architectures (10 and 20 neurons in the hidden layer). We can see that the accuracy for happiness stays the same (~65%) for the different sets of features and architectures. The accuracy for fear is relatively low (35-53%). The accuracy for anger starts at 73% for the 8-feature set and increases to 81% the 14-feature set. The accuracy for sadness varies from 73% to 83% and achieves its maximum for the 10-feature set. The average total accuracy is about 70%. Set of experts. The last approach, which we have tried, is based on the following idea. Instead of training a neural network to recognize all emotions, we can build a set of specialists or experts that can recognize only one emotion and then combine their results to classify a given sample. To train the experts we used a two-layer backpropagation neural network architecture with a 8-element input vector, 10 or 20 nodes in the hidden sigmoid layer and one node in the output linear layer. We also used the same subsets of the s70 data set as the training and test sets but with only two classes (for example, angry – non-
Accuracy (%)
angry). The average accuracy of emotion recognition for this approach is about 70% except fear which is ~44% for the 10-neuron, and ~56% for the 20-neuron architecture. The accuracy of non-emotion (non-angry, non-happy, etc.) is 8592%. The important question is how to combine opinions of the experts to obtain the class of a given sample. A simple and natural rule is to choose the class which expert’s value is closest to 1. This rule gives the total accuracy is about 60% for the 10-neuron architecture and about 53% for the 20-neuron architecture. Another approach to rule selection is to use the outputs of expert recognizers as input vectors for a new neural network. In this case we give a neural network an opportunity to learn itself the most appropriate rule. 100 90 80 70 60 50 40 30 20 10 0
normal happy angry sad afraid total f=8 n=10
f=8 n=20
f=10 n=10
f=10 n=20
f=14 n=10
f=14 n=20
Figure 1. Accuracy of emotion recognition for the s70 data set.
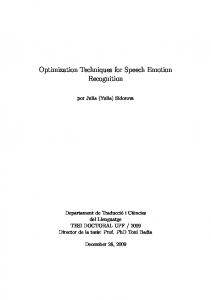
To explore this approach, we used a two-layer backpropagation neural network architecture with a 5-element input vector, 10 or 20 nodes in the hidden sigmoid layer and five nodes in the output linear layer. We have selected five of the best experts and generated several dozens neural network recognizers. Figure 2 presents the average accuracy of these recognizers. The total accuracy is about 63% and stays the same for both 10- and 20-node architectures. The average accuracy for sadness is rather high ~76%. Unfortunately, it turned out that the accuracy of expert recognizers was not high enough to increase the overall accuracy of recognition. In general, the approach, which is based on ensembles of neural network recognizers, outperformed the others and was chosen for implementation at the next stage. DEVELOPMENT
The following pieces of software have been developed during the second stage: ERG: Emotion Recognition Game, ER: Emotion Recognition software for call centers, and SpeakSoftly: a dialog emotion recognition program. The first program has been mostly developed to demonstrate the results of the above research. The second software system is a full-fledge prototype of an industrial solution for computerized call centers. The third program just adds a different user interface to the core of the ER system. It has been developed to demonstrate the real time emotion recognition. Below we shall describe briefly
Accuracy (%)
the ER system. For implementation of the above systems we used MATLAB and small amount of C++ code. 100 90 80 70 60 50 40 30 20 10 0
nu=10 nu=20
normal
happy
angry
sad
afraid
total
Figure 2. Set of experts performance with learned rule.
ER: Emotion Recognition Software For Call Centers
Goal. The goal of the development of this software was to create an emotion recognizer that can process telephone quality voice messages (8 kHz/8 bit) and can be used as a part of a decision support system for prioritizing voice messages and assigning a proper agent to respond the message. Recognizer. It was not a surprise that anger was identified as the most important emotion for call centers. Taking into account the importance of anger and scarcity of data for some other emotions we decided to create a recognizer that can distinguish between two states: “agitation” which includes anger, happiness and fear, and “calm” which includes normal state and sadness. To create the recognizer we used a corpus of 56 telephone messages of varying length (from 15 to 90 seconds) expressing mostly normal and angry emotions that were recorded by eighteen non-professional actors. These utterances were automatically split into 1-3 second chunks, which were then evaluated and labeled by people. They were used for creating recognizers using the methodology developed in the first study. We created ensembles of 15 neural network recognizers for the 8-,10-, and 14-feature inputs and the 10- and 20node architectures. The average accuracy of the ensembles of recognizers lies in the range 73-77% and achieves its maximum ~77% for the 8-feature input and 10-node architecture. System Structure. The ER system is a part of a new generation computerized call center that integrates databases, decision support systems, and different media such as voice messages, e-mail messages and a WWW server into one information space. The system consists of three processes: the wave file monitor, the voice mail center and the message prioritizer. The wave file monitor reads every 10 seconds the contents of voice message directory, compares it to the list of processed messages, and, if a new message is detected, it processes the message and creates two files: a summary file and an emotion description file. The summary file contains the following information: five numbers that describe the distribution of emotions in the message, length and the percentage of silence in the message. The emotion description file has for each 1-3 second chunk of message the data which describe the emotional
content of the chunk. The prioritizer is a process that reads summary files for processed messages, sorts them taking into account their emotional content, length and some other criteria, and suggests an assignment of agents to return back the calls. Finally, it generates a web page, which lists all current assignments. The voice mail center is an additional tool that helps operators and supervisors to visualize emotional content of voice messages. CONCLUSION
In our research we explored how well people and computers recognize emotions in speech. Several conclusions can be drawn from the above results. First, decoding of emotions in speech is complex process that is influenced by cultural, social, and intellectual characteristics of subjects. People are not perfect in decoding even such manifest emotions as anger and happiness. Second, anger is the most recognizable and easier to portray emotion. It is also the most important emotion for business. But anger has numerous variants (for example, hot anger, cold anger, etc.), that can bring the variability into acoustical features and dramatically influence the accuracy of recognition. Third, pattern recognition techniques based on neural networks proved to be useful for emotion recognition in speech and for creating customer relationship management systems. REFERENCES Banse, R. and Scherer, K.R., 1996 Acoustic profiles in vocal emotion expression. Journal of Personality and Social Psychology. 70: 614-636. Bezooijen, R. van, 1984 The characteristics and recognizability of vocal expression of emotions. Drodrecht, The Netherlands:Foris. Breiman, L. , 1996 Bagging Predictors. Machine Learning 24 (2): 123-140. Canh, J.E., 1989 Generation of Affect in Synthesized Speech. In Proceedings of AVIOS'89, Meeting of the American Voice Input/Output Society. Darwin, Ch., 1965 The expression of the emotions in man and animals. Chicago: University of Chicago Press. (Original work published in 1872). Dellaert, F., Polzin, Th., and Waibel, A., 1996 Recognizing emotions in speech. ICSLP 96. Elliot, C. , Brzezinski, J., 1998 Autonomous Agents as Synthetic Characters. AI Magazine,19:13-30. Hansen, L. and Salomon, P., 1990 Neural Network Ensembles. IEEE Transactions on Pattern Analysis and Machine Intelligence. 12: 993-1001. Kononenko, I., 1994 Estimating attributes: Analysis and extension of RELIEF. In L. De Raedt and F. Bergadano (eds.) Proc. European Conf. On Machine Learning. 171-182. Murray, I.R. and Arnott, J.L., 1993 Toward the simulation of emotion in synthetic speech: A review of the literature on human vocal emotions. J. Acoust.. Society of America; 93 (2): 1097-1108. Parmanto, B., Munro, P.W., and Doyle, H.R., 1996 Improving committee diagnosis with resampling techniques, In D.S. Touretzky, M.C. Mozer, and M. Hesselmo (eds.) Advances in Neural Information Processing Systems 8. Cambridge, Mass.: MIT Press, 882-888. Picard, R., 1997 Affective computing. The MIT Press. Scherer, K.R., Banse, R., Wallbott, H.G., Goldbeck T., 1991 Vocal clues in emotion encoding and decoding. Motiv Emotion 1991; 15: 123-148, 1991. Tosa, N., Nakatsu, R., 1996 Life-like communication agent - emotion sensing character "MIC" and feeling session character "MUSE". Proc. of IEEE Conference on Multimedia 1996. 12-19.