IJRECE VOL. 5ISSUE 4OCT.-DEC. 2017. ISSN: 2393-9028 (PRINT) | ISSN: 2348-2281(ONLINE). INTERNATIONAL JOURNAL OF RESEARCH IN ...
IJRECE VOL. 5 ISSUE 4 OCT.-DEC. 2017
ISSN: 2393-9028 (PRINT) | ISSN: 2348-2281 (ONLINE)
Emotional Speech Recognition using Optimized Features Hemanta Kumar Palo 1, Pawan Kumar2, Mihir Narayan Mohanty2 1 Siksha ‘O’ Anusandhan University, Bhubaneswar, Odisha 2 Cambridge Institute of Technology, Ranchi, India, 3 Siksha ‘O’ Anusandhan University, Bhubaneswar, Odisha Abstract: Human speech emotion requires a deep analysis on the acoustic properties of speech production mechanism.Spectral characteristics being a constituent of the acoustic parameter can represent human speech emotion if chose judiciously.Spectral parameters such as Spectral roll-off, Spectral centroid, and Spectral flux have been extracted at frame level initially, to approximate the non-stationary speech signal in a stationary platform. The popular Genetic Algorithm (GA) has been used to optimize the extracted feature sets in the next phase. Neural network classifiers happen to perform better in the presence of small feature dimension. The simple but popular Multilayer Perceptron (MLP) network has been simulated to study the effect of optimized feature sets on the classification accuracy. Utterances from the Standard Surrey Audio-Visual Expressed Emotion (SAVEE) database have been used for the said task. Results suggest the superiority of optimized feature over baseline spectral features in classifying the investigated emotions. Keywords: Emotional speech recognition, Optimized features, Genetic Algorithm, Classification, Multi-Layer Perceptron I. INTRODUCTION Research in speech emotion recognition (SER) has been progressing in the field of computer-mediated human communication and human-computer interaction during the last few decades. The major focus has been the intelligent use of machine learning approaches that can predict the desired emotional states automatically from speech signal [1]. In the absence of a concrete theoretical definition that can relate the ambiguous human expressive behaviour to the human nature, human inference by machines remains a challenging topic of research. The complexity further aggravates as everyday emotions are often mixed in nature. The presence of subsidiary or territorial emotions with primary emotion confuses the classification system. The application domains of SER are many which are being innovated into new domains day by day. The SER system can serve as a standard tool to maintain optimum customer satisfaction and employee efficiency in call centres [2]. Analysis of user habits by sociopsychology researchers may use this as an objective evaluation tool that can be extended to study a child’s social and communication skills [3]. Computer games, security organization, criminal investigators, on-line tutoring and a host of other services are going to benefit from such types of research. In general, an automatic SER system has three major components. These are: (a) authenticated standard speech
emotion databases (b)Efficient feature extraction algorithms(c) suitable classification techniques. There have been a number of standard databases such as EMO-DB (Berlin database), Surrey Audio Visual Expressive Emotion (SAVEE), Speech Under Simulated And Acted Stress (SUSAS), INTERFACE, Danish emotional database, etc. have been often discussed in literature [4-5]. However, the biggest barrier of research advancement is that most of the databases are either inaccessible or publicly unavailable. Further, unavailability of comparable standard either at the database level or test condition makes the performance appraisal ambiguous. SAVEE is a popular publicly accessible database used by research community earlier[6-7]. With a different set of features extracted from the database, these authors have claimed a classification accuracy of 59.85% to 70.80% using NN classifier, 49% to 72.89% with naïve Bayes, 50.18% to 74.39% with KNN and 53.80% to 73.87% using classification tree algorithm. The database is in the English language, hence, has been chosen for this piece of work. Validation of any emotional speech database arguably requires judicious selection of features that describe the emotional content in speech signal adequately. The feature extractionalgorithm must be capable enough to accommodate different speaking styles, languages, type, culture and demographic profile of the speaker. Some of the traditional acoustic features used in SER are the pitch or fundamental frequency, formants, energy, Zero Crossing Rate (ZCR), speech rate, linear prediction coefficient (LPC), Mel Frequency Cepstrum Coefficients (MFCC), Linear Prediction Cepstral Coefficient (LPC), Perceptual Linear Prediction (PLP) and their statistics [5-6, 8-9]. Due to the global nature of prosodic features, the feature dimension is small. This makes stochastic classifiers such as GMM/HMM/ SVM inefficient in modeling the desired emotion using statistical and utterance-level parameters. Works of Literature has provided a conflicting report on the identification of speech emotion using prosodic features [10]. Further, the prosodic characteristics found to be similar for some emotions [11]. For an example, there is a meager change in pitch among joy, fear, surprise and angry states of emotion as observed by these authors. Further, prosodic features are often extracted at the utterance level, which leads to loss of temporal information describing the speech emotion in a signal. Contrary to this, spectral featuresextracted at frame-level are more efficient than prosodic features in the field of SER [6, 8-9, 11]. Nevertheless, the scarcity in system storage capabilities, increased computational time, slower system response and complex
INTERNATIONAL JOURNAL OF RESEARCH IN ELECTRONICS AND COMPUTER ENGINEERING A UNIT OF I2OR
4|Pag e
IJRECE VOL. 5 ISSUE 4 OCT.-DEC. 2017
ISSN: 2393-9028 (PRINT) | ISSN: 2348-2281 (ONLINE)
algorithm are few inherent issues of these higher-dimensional segmental feature sets. Another practical problem with the segmental algorithm is that not all the extracted values are quite significant for characterizing the desired emotion. Different feature selection and reduction algorithms such as Vector Quantization, Principle Component Analysis, Sequential Forward Selection, Back Propagation and Fisher Discriminant Ratio, Linear Discriminant Analysis, etc. have been explored in the field of SER to address these issues [8-9, 12-14]. However, feature optimization to represent emotional content in a speech signal is still an open issue and is indispensable in the current scenario. Suitable machine learning algorithms is essential to classify the designated emotion based on the extracted features. The classifier must able to model the context and insensitive to outliers. There have been many standard classifiers applied to recognize human speech emotion by researchers [1-13]. Each classifier has its own advantages and limitation and is purely feature and database dependent. The Multilayer Perceptron is a Neural Network (NN) based classifier which is simple and yet efficiently applied in this field [6, 10]. Itis a supervised learning network with a nonlinear activation function. Due to a number of layers of hidden neurons, it can solve complex tasks and is computationally efficient. It has provided better results than the conventional hidden Markov model, Gaussian mixture model, and support vector machine classifiers for low feature dimension [10]. This has been used in this work to simulate the baseline spectral features such as spectral roll-off, spectral centroid, and spectral flux. The features are then optimized using Genetic Algorithm (GA) for better efficiency. A brief description of the chosen database is given in Section II and the feature extraction techniques applied in this work is elaborated in section III. Section IV explains the optimized genetic algorithm whereas the classification scheme used is described in section IV. The findings of this work are discussed in section V with a conclusion in section VI.
kHz is maintained for this purpose. Using standard features, a classification accuracy of 61% has been obtained in a speaker independent platform.
II. THE CHOSEN DATABASE SAVEE database has been used in this work. The University of Peshawar (Pakistan) and CVSSP at the University of Surrey (UK) funded the project [7]. It consists of four hundred eighty utterances of British English for seven discrete categories of emotions. These states are anger, fear, disgust, sadness, happiness, surprise and neutral. Four male professional actors in the age group of 27 to 31 years recorded the phonetically balanced utterances. The utterances are checked for the quality of performance based on the judgments of ten subjects. The database comprises of four hundred eighty (sixty utterances for each category of emotion such as anger, surprise, fear, happiness, disgust, and sadness + one hundred twenty utterances for the neutral state) utterances. Recordings of fifteen sentences (TIMIT text material) for six emotional categories except neutral are collected from each actor. The text materials consist of 10 generic sentences, three common and two emotion-specific sentences. The three common and twelve emotion-specific utterances were recorded as neutral by the four actors. A sampling rate of 44.1
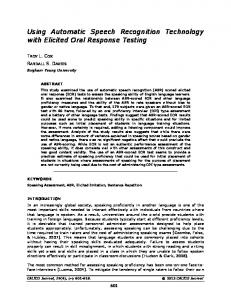
Fig. 1: Block diagram of the proposed emotion recognition system A. Spectral Roll-off The energy of a speech signal containing emotional information is found to be within a certain range of frequencies. Spectral roll-off indicates the frequency contents below which certain fractions of total amount of energy remain [17]. As for convenience, a value between 0.95 or 0.85 is generally set for this purpose depending on the characteristics of the signal. Incidentally, spectral roll-off provides information on the spectral shape which in turn determines the amount of high-frequency component available in a speech signal. It also provides the amount of correlation among features and increases with frequency. Mathematically, it can be expressed as 𝑡 ∑𝐾𝑘=1 [𝑘]| |𝑆𝑝 [𝑘]| = 0.85 ∗ ∑𝑁/2 (1) 𝑘=1|𝑆𝑝 Here, 𝐾𝑡 is the frequency below which 0.85 portions of spectrum 𝑆𝑝 [𝑛] distribution of frame 𝑝 is concentrated.
III. FEATURE EXTRACTION Features extracted using Cepstral analysis is sensitive to additive noise that distorts the power spectrum at all frequencies. Arguably, the distortion will be less noticeable at higher frequencies like formant regions due to large signal to noise ratio. It will benefit the recognitionif the spectrum calculation is concentrated more in formant region, unlike cepstrum analysis that considers the whole frequency region. However, use of formants as the features is less efficient due to the merging of the peak in the spectrum besides generation of spurious spectrum peaks [15]. This has made researchers toadopt formant like features to eliminate the above drawbacks [14, 16-17]. A few of the important formant like spectral sub-band features such as spectral centroid, spectral roll-off and spectral flux have been investigated in this work. However, unlike others,these features are extracted at framelevel using a frame size of 30ms with 10ms frame overlapping. Hamming window has been used to obtain the windowed speech signal. A block diagram of the experimental procedure is shown in Fig. 1. Emotional speech input 0.85*PSD
Framing Windowing |FFT|
Output emotion
PSD
Classifier (MLP)
Spectral roll-off
Normalized PSD SC
Spectral Flux
Optimization (GA)
INTERNATIONAL JOURNAL OF RESEARCH IN ELECTRONICS AND COMPUTER ENGINEERING A UNIT OF I2OR
5|Pag e
IJRECE VOL. 5 ISSUE 4 OCT.-DEC. 2017
ISSN: 2393-9028 (PRINT) | ISSN: 2348-2281 (ONLINE)
B. Spectral-Flux The spectral flux denotes the change in local spectral of an emotional signal. Mathematically, it can be computed using the relation 𝑁/2 𝑆𝐹𝑝 = ∑𝑘=1(|𝑆𝑝 [𝑘]| − |𝑆𝑝−1 [𝑘]|)2 (2) where𝑆𝑝 [𝑘] and 𝑆𝑝−1 [𝑘] is the normalized magnitude of the spectrum of the present and previous frames respectively. In a way, spectral flux indicates how fast the power spectrum of the intended signal changes within frames. C. Spectral-Centroid Segmentation of the signal into a fixed number of sub bands is made to determine the spectral centroid (SC). The number of sub bands, cut off center frequencies in these subbands and the shape of the filters are few factor on which SC depends [6, 14]. The steps in extracting SC features are From the emotional speech signal, estimate the power spectrum. To the estimated power spectrum, apply the desired filter bank. From each sub band, compute the first moment or centroid. Let, 𝑆𝑝 [𝑘]as the power spectrum. It is represented by the magnitude of short time Fourier transform (STFT)) of the signal at frame p. The SC feature is then estimated using the relation as given by 𝑆𝐶𝑝 =
∑𝑁/2 [𝑛]|∗𝑓(𝑘) 𝑘=1|𝑆𝑝 ∑𝑁/2 |𝑆𝑝 [𝑘]|
(3)
𝑘=1
where the frequency at bin 𝑘 is denoted by 𝑓(𝑘). Within a frame, it denotes the balancing point of the spectral magnitude. It captures the features concerned to the spectral tilt or slope. SC represents the brighter texture and the sound sharpness with higher frequencies. IV. FEATURE OPTIMIZATION The increase in the feature dimension may cause in overfitting of data besides an increase in the computation time. To remove irrelevant features, it is advisable to either apply feature selection/ reduction algorithm or to optimize the features for better SER [8-9, 18-20]. In this work, the optimization of features using GA has been performed to maximize the discrimination capability with respect to the chosen database. In [19], the authors have adopted the optimized filter banks and approached their problem using the evolutionary algorithm with Cepstral-based features. The spline interpolation has been used for parameter encoding of the stressed speech features in their work. Application of GA with MFCC features using Probabilistic Neural Network (PNN) classifier has provided an additional gain in accuracy of 26.08% with EMO-DB database, 16.26% with SAVEE database and 3.85% with Vera am Mittag (VAM) German database [21]. We have approached the problem using the frame-level sub-band spectral features with the MLP network. In GA, the fitness function is assumed to take one input 𝑠 which is a row vector. The vector comprises of the features extracted from an utterance of an emotion. The optimized feature value is estimated by the fitness function which results
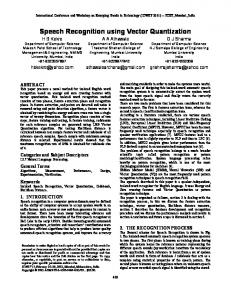
in scalar value𝑠1. The basic steps involved in GA are the reproduction, crossover, and mutation. In this algorithm, a point in the feature space is encoded into a finite set of binary bits (zeros or ones) and is termed as a chromosome. The steps of GA are explained as below Initially, a randomly generated population of strings describing the decision variable is made. An objective function evaluates each population string and optimizes it. A value termed as fitness of the population string is obtained. Repeat the steps. Apply the three GA operators such as the reproduction, crossover, and mutation to generate a new population. In the reproduction process, the new population is formed using the current population using schemes such as roulette wheel selection, tournament selection or ranking method. In crossover step enrichment of the population takes place with the help of good strings. The BLX-α crossover method has been used in GA with a crossover probability from 0.6 to 0.9. A constant probability in the range of 0.001 to 0.01 has been used for every population element in mutation in order to find the unexplored feature space. In the case, the values are randomly varied at one or more places within the chosen chromosome. Evaluate the population again until we reach the stopping criteria of the optimization process. The maximum number of allowable iteration or accomplishment of the best solution than the previous solution may be used as the termination of the process. V. CLASSIFICATION MODEL MLP works on the principle of back-propagation algorithm. The network operates in two phases, i.e. forward pass (phase– I) and the backward pass (phase-II). When the desired input is presented to the network, it is propagated from the input to the output layer via the hidden layer during the forward pass. During phase-II or backward pass, the synaptic weights and biases are all updated based on the back propagation algorithm in accordance with the chosen error correcting criteria. Consider an input training vector as 𝑠 = {𝑠1 , 𝑠2 , … , 𝑠𝑝 , … , 𝑠𝑛 }, the hidden neuron vector as𝑧 = {𝑧1 , 𝑧2 , … , 𝑧𝑞 , … , 𝑧𝑚 }, the output vector as𝑦 = {𝑦1 , 𝑦2, … , 𝑦𝑟 , … , 𝑦𝑜 }, the target output vector as 𝑡 = {𝑡1 , 𝑡2 , … , 𝑡𝑟 , … , 𝑡𝑜 } and the learning parameter as 𝛼. A learning rate of 0.02 has been chosen for better convergence with the discussed feature set in this work. The biases of the qth hidden unit and rth output unit are given by 𝑣0𝑞 and 𝑤0𝑟 respectively. Each input unit of MLP receives the features of the emotional speech signal 𝑠𝑝 and propagates it to the corresponding hidden units as shown in the Fig. 2. For a hidden unit 𝑞, 𝑞 = 1, 2, … , 𝑚 given by 𝑧𝑞 , the net input without activation function ‘𝐹’ is given by 𝑧𝑖𝑛𝑞 = 𝑣0𝑞 + ∑𝑛𝑝=1 𝑠𝑝 𝑣𝑝𝑞 (4) With an activation function, the output of the hidden layer is given as 𝑧𝑞 = 𝐹(𝑧𝑖𝑛𝑞 ) = 𝐹(𝑣0𝑞 + ∑𝑛𝑝=1 𝑠𝑝 𝑣𝑝𝑞 ) (5)
INTERNATIONAL JOURNAL OF RESEARCH IN ELECTRONICS AND COMPUTER ENGINEERING A UNIT OF I2OR
6|Pag e
IJRECE VOL. 5 ISSUE 4 OCT.-DEC. 2017
ISSN: 2393-9028 (PRINT) | ISSN: 2348-2281 (ONLINE)
The signal of the equation (5) is fed to the output unit from the hidden unit through bias and weights. Similarly, for every output unit 𝑦𝑟 , 𝑟 = 1, 2, … , 𝑜, the net input from the hidden unit to the output unit 𝑦𝑟 with weight and bias is given by 𝑦𝑖𝑛𝑟 = 𝑤0𝑟 + ∑𝑛𝑞=1 𝑧𝑞 𝑤𝑞𝑟 (6) With activation function ‘𝐹’ the output is given by 𝑦𝑟 = 𝑓(𝑤0𝑟 + ∑𝑛𝑞=1 𝑧𝑞 𝑤𝑞𝑟 ) = 𝑓(𝑦𝑖𝑛𝑟 ) (7)
baseline features when the results of Table I and Table II have been compared. The average classification accuracy has shown similar trends. Hence, it can be concluded that the use of GA to optimize the features have shown a better result than that of optimized features. The reason for this may be attributed to the following: For large feature sets the derivative-based method cannot be possible as the definition of the gradient is not available in which case GA founds to be more suitable. Further, the algorithm can be used in a multiobjective platform and the optimization is suitable in case of noisy data. The optimization grows better with time with each iteration. Finally, GA is inherently parallel and can be easily distributed. This founds to be more applicable for speech signal analysis as speech frequencies always occur in parallel. Table 2: MLP recognition accuracy using optimized spectral features for happy, sad and neutral emotions Features Sad Neutral Happy Average Spectral roll-off 63.51% 64.29% 68.89% 65.56% Spectral centroid 68.11% 64.49% 70.55% 67.72% Spectral flux 72.37% 70.12% 74.49% 72.33%
With more number of hidden layers, a smoother approximation has been obtained for the chosen set of emotions. However, we did not find any significant improvement in classification performance. Further, it has increased the training time of the network and the convergence to local minima has suffered. Thus, a single hidden layer has been chosen throughout this work so as to reduce the computational complexity and classification time. A default value of 0.0 has been maintained for the MSE goal. Extra neurons are added to the hidden layer until the MSE goal is achieved. VI. RESULTS AND DISCUSSION The average classification accuracy using MLP has been shown in Table 1 for the chosen spectral features such as spectral centroid, spectral roll-off, and spectral flux. This Table also provides the individual classification accuracy of two opposite emotional states such as sad and happy and the result has been compared to the neutral state. Sixty utterances of each emotional state from SAVEE database have been taken. As observed, the happy state is better classified using all types of chosen feature set with the classifier followed by the sad state. The accuracy has been the highest using spectral flux features and lowest with the spectral roll-off features.
Table 2: Comparison of average classification accuracy between the baseline and the optimized features using MLP Features Without With Improved GA GA in accuracy % Spectral roll-off 59.6% 65.56% 5.96% Spectral centroid 62.88% 67.72% 4.84% Spectral flux 65.95% 72.33% 6.38%
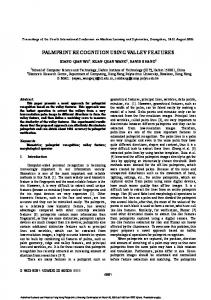
A comparison of the average spectral feature magnitude over sixty utterances per emotion has been shown in Figure 3Figure 5 for different emotions. In all these Figures, it is found that happy state has the highest of these magnitudes as compared to the sad and neutral state. It indicates the presence of more higher-frequency components in the happy state and its higher arousal level. However, the feature values tend to be nearly equal in case of sad and neutral states. Thus, these emotions have a very low difference in arousal level among them. Magnitude of spectral rolloff
Fig. 2: The MLP structure
Table 3 shows the additional improvement in classification performance obtained using the optimization feature. The accuracy improvement has been 6.38%, 4.84% and 5.96% with spectral flux, spectral centroid, and spectral roll-off respectively using GA as compared to the baseline features.
Table 1: MLP recognition accuracy using spectral features for happy, sad and neutral emotions Features Sad Neutral Happy Average Spectral roll-off 57.15% 59.42% 62.23% 59.60% Spectral centroid 62.39% 60.44% 65.81% 62.88% Spectral flux 66.55% 63.19% 68.11% 65.95%
Table 2 provides the classification accuracy using the optimized features based on GA. The classification accuracy of individual emotions has shown improved with that of
2
0.03597
1.5 1
0.02966
0.02976
0.5 0 Happy
Sadness
Neutral
Different Emotions
Fig. 3: Comparison of average feature magnitude among different emotions with spectral roll-off for sixty utterances per emotion
INTERNATIONAL JOURNAL OF RESEARCH IN ELECTRONICS AND COMPUTER ENGINEERING A UNIT OF I2OR
7|Pag e
IJRECE VOL. 5 ISSUE 4 OCT.-DEC. 2017
ISSN: 2393-9028 (PRINT) | ISSN: 2348-2281 (ONLINE)
Magnitude of spectral Centroid
[3] 1.63188
2 1.5 1 0.5 0
0.65693
Happy
Sadness
0.57076
[4]
[5]
Neutral
Different emotions [6]
Fig. 4: Comparison of average feature magnitude among different emotions with spectral centroid for sixty utterances per emotion Magnitude of spectral flux
[7]
1.5
1.27642
1.20669 1.01481 [8]
1 0.5
[9]
0 Happy
Sadness
Neutral
[10]
Different emotions
Fig. 5: Comparison of average feature magnitude among different emotions with spectral flux for sixty utterances per emotion VII. CONCLUSIONS Optimized spectral features have provided better accuracy in NN platform as compared to non-optimized baseline features. This is due to the reduction in redundant features and retention of only relevant features that describe the speech emotions. The accuracy level of spectral flux features is found to be highest among all the chosen spectral techniques adopted in this work. Among emotions, the classifier is more accurate in classifying happy emotion with the extracted features and optimized algorithm as observed from our results. The average feature magnitude founds to be highest for the happy state as compared to other chosen emotional states. There has been a meager difference in the average magnitude between the neutral and sad states. It indicates the presence of less highfrequency components in these states. The work can be extended to other optimized algorithms, feature sets and classification schemes in classifying speech emotion in future for better accuracy. Involvement of more emotional states may be another area that needs further consideration.
[11] [12]
[13]
[14]
[15]
[16]
[17]
[18]
VIII. REFERENCES J. Deng, S. Fruhholz, Z. Zhang, and B.Schuller, “Recognizing emotions from whispered speech based on acoustic feature transfer learning,” IEEE Access, Mar 2017 (in press). [2] C. Huang, B. Song, and L. Zhao, “Emotional speech feature normalization and recognition based on speaker-sensitive feature clustering,” International Journal of Speech Technology, vol.19, no. 4, pp. 805-816, December 2016. [1]
[19]
K. K. Rachuri, M.Musolesi, C. Mascolo, P. J. Rentfrow, C. Longworth, and A. Aucinas, “EmotionSense: A mobile phones based adaptive platform for experimental social psychology,” In Proceedings of the 12th ACM international conference on ubiquitous computing, Copenhagen, pp. 281-290, 2010. D. Ververidis, and C. Kotropoulos, “A state of the art review on emotional speech databases,” in 1st Richmedia Conference, Lausanne, Switzerland, pp. 109-119, 2003. S. G. Koolagudi, and K S. Rao, “Emotion recognition from speech: a review,” International journal of speech technology, springer, vol. 15, no. 2, pp. 99-117, June 2012. N. S. Fulmare, P. Chakrabarti, and D.Yada, “Understanding and estimation of emotional expression using acoustic analysis of natural speech,” International Journal on Natural Language Computing (IJNLC), vol. 2, no. 4, pp. 37-46, October 2013. S. Haq, and P. J. B. Jackson, “Multimodal Emotion Recognition,” In W. Wang (ed), Machine audition: principles, algorithms and systems, IGI Global Press, chapter 17, pp. 398423, July 2010. H. K. Palo, M. N.Mohanty, and M. Chandra, “Efficient feature combination techniques for emotional speech classification,” International Journal of Speech Technology, vol. 19, no. 1, pp. 135-150, 2016. H. K. Palo, and M. N. Mohanty, “Wavelet based feature combination for recognition of emotions,”Ain Shams Engineering Journal, Elsevier, 2017 (In Press). E. Ayadi, M. S. Kamal, and F. Karray, “Survey on speech emotion recognition: features, classification schemes, and databases,” Pattern Recognition, Elsevier, vol. 44, no. 3, pp. 572-587, September 2011. L. R. Rabiner, and B. H. Juang, “Fundamental of speech recognition,” 1st ed., Pearson Education, Delhi, 2003. C. Yu, L. Xie, and W. Hu, “Feature optimization of speech emotion recognition,” Journal of Biomedical Science and Engineering, vol. 9, no. 10, pp. 37-43, September 2016. G. Trigeorgis, F. Ringeval, R. Brueckner, E. Marchi, M. A. Nicolaou, B. Schuller, and S. Zafeiriou, “Adieu features? Endto-end speech emotion recognition using a deep convolutional recurrent network,” In Acoustics, Speech and Signal Processing (ICASSP), IEEE International Conference, pp. 5200-5204, March 2016. S. Wu, T. H. Falk, and W.-Y. Chan, “Automatic speech emotion recognition using modulation spectral features,” Speech Communication, vol. 53, pp. 768-785, Science Direct, 2011. K. K. Paliwal, “Spectral sub-band centroid features for speech recognition,” In Acoustics, Speech and Signal Processing(ICASSP), vol. 2, pp. 617-620, May 1998. J. Přibil, and A. Přibilová, “Evaluation of influence of spectral and prosodic features on GMM classification of Czech and Slovak emotional speech,” EURASIP journal on audio, speech, and music processing, vol. 8, pp. 2-22, August 2013. H. K. Palo, M. N. Mohanty, and M.Chandra, “ New features for emotional speech recognition,” In Power, Communication and Information Technology Conference (PCITC), IEEE, pp. 424429, October 2015. S. Kuchibhotla, H. D.Vankayalapati, and K. R. Anne, “An optimal two stage feature selection for speech emotion recognition using acoustic features,”. International Journal of Speech Technology, vol. 19, no. 4, pp. 657-667, December 2016. L. D. Vignolo, S. M. Prasanna, S. Dandapat, H. L. Rufiner, and D. H. Milone, “Feature optimisation for stress recognition in speech,” Pattern Recognition Letters, vol. 84, pp. 1-7, December. 2016.
INTERNATIONAL JOURNAL OF RESEARCH IN ELECTRONICS AND COMPUTER ENGINEERING A UNIT OF I2OR
8|Pag e
IJRECE VOL. 5 ISSUE 4 OCT.-DEC. 2017
ISSN: 2393-9028 (PRINT) | ISSN: 2348-2281 (ONLINE)
[20] H. K. Palo, M. Chandra,
and M. N. Mohanty, “Emotion Recognition using MLP and GMM for Oriya Language”, International Journal of Computational Vision and Robotics, vol.7, no. 4, pp. 426-442, 2017. [21] M. Sidorov, C. Brester, W. Minker, and E. Semenkin, “Speechbased emotion recognition: feature selection by self-adaptive multi-criteria genetic algorithm,” In LREC, pp. 3481-3485, May 2014. [22]
Hemanta Kumar Palo has published more than 25 research papers in the International/National Journals and Conferences. He has completed his ‘A.M.I.E.’ from ‟Institute of Engineers, India in 1997, his Master of Engineering from ‟Birla Institute of Technology”, Mesra, Ranchi in 2011 and submitted his Ph.D. thesis in 2017. He is having 20 years of experience in the field of Electronics and Communication Engineering from 1990 to 2010 in Indian Air Force. Currently he is serving as an Assistant Professor in the department of Electronics and Communication Engineering in the Institute of Technical Education and Research, Siksha ‘O’ Anusandhan University, Bhubaneswar, Odisha, India and was an Assistant Professor in Gandhi Academy of Technology and Engineering, Odisha, in the Department of ECE from 2010 to 2012. He is the life member of IEI, India and is the member of IEEE. He has been awarded with outstanding researcher award by the International Institutue of Organized research in 2017. Dr. Pawan Kumar has completed his master in Science (Electronics and Communication) from Ranchi University, India in 2005 and Ph.D. from Birla Institutue of Technology, Mesra, Ranchi 2013. His area of specialization includes speech and signal processing. He has published many papers in international and national journals and conference. He is currently working as an Associate Professorin the department of electronics and Communication Engineering, Cambrige Institute of Technology, Ranchi, India.
Dr. Mihir Narayan Mohantyhas published more than 100 papers in International/National Journals and Conferences along with approximately 20 years of teaching experience. He is the active member of many professional societies like IEEE, IET, IETE, EMC & EMI Engineers India, IE (I), ISCA, ACEEE, IAEng etc. He has received his M.Tech. degree in Communication System Engineering from the Sambalpur University, Sambalpur, Odisha and Ph.D. in Applied Signal Processing from BijuPattanaik Technical University, Odisha. He is currently working as an Associate Professor and was Head in the Department of Electronics and Instrumentation Engineering, Institute of Technical Education and Research, Siksha O‟ Anusandhan University, Bhubaneswar, Odisha. His area of research interests includes Applied Signal and image Processing, Digital Signal/Image Processing, Biomedical Signal Processing, Microwave Communication Engineering and Bioinformatics.
INTERNATIONAL JOURNAL OF RESEARCH IN ELECTRONICS AND COMPUTER ENGINEERING A UNIT OF I2OR
9|Pag e