Nov 1, 2009 - Network emulators are attractive tools for supporting design, ... performance with regard to the limited bit rate, constant propagation delay.
EmPath: Tool to Emulate Packet Transfer Characteristics in IP Network Jaroslaw Sliwinski, Andrzej Beben, and Piotr Krawiec Institute of Telecommunications Warsaw University of Technology Nowowiejska 15/19, 00-665 Warsaw, Poland {jsliwins,abeben,pkrawiec}(at)tele.pw.edu.pl
Abstract. The paper describes the EmPath tool that was designed to emulate packet transfer characteristics as delays and losses in IP network. The main innovation of this tool is its ability to emulate packet stream transfer while maintaining packet integrity, packet delay and loss distribution and correlation. In this method, we decide about the fate of new packet (delay and loss) by using the conditional probability distributions depending on the transmission characteristics of the last packet. For this purpose, we build a Markov model with transition probabilities calculated on the basis of the measured packet traces. The EmPath tool was implemented as a module of the Linux kernel and its capabilities were examined in the testbed environment. In the paper, we show some results illustrating the effectiveness of EmPath tool. Key words: network emulator, traffic modeling, validation, testing
1
Introduction
Network emulators are attractive tools for supporting design, validation and testing of protocols and applications. They aim to provide a single node (or a set of nodes) with ability to introduce the packet transfer characteristics as they would be observed in a live network. Therefore, the network emulators are often regarded as a “network in a box” solution [1]. The key issue during the design of the network emulator is the method for representation of the network behavior. Among the realizations of emulators we recognize two main techniques: (1) the real-time simulation, where emulator simulates the network to get appropriate treatment of packets, e.g., as proposed in [2, 3], or (2) the model based emulation, where emulator enforces the delay, loss or duplication of packets using a model of the network behavior; the parameters for the model come from measurements, simulations or analysis. We focus on model based emulation because it is regarded to be scalable even for large networks and high link speeds. One of the first widely used emulators was dummynet, which design and features were presented in [4]. Its main objective was the evaluation of TCP This work was partially funded by MNiSW grant no. 296/N-COST/2008/0.
2
J. Sliwinski, A. Beben, P. Krawiec
performance with regard to the limited bit rate, constant propagation delay and packet losses. This concept was further investigated by several authors, e.g., in [5, 6], leading to implementation NIST Net [1] and NetEm [7] tools for Linux kernel versions 2.4 and 2.6, respectively. Both of the tools model the network impairment as a set of independent processes related to packet transfer delays, packet losses, packet reordering and duplication. Due to the assumed independence, they do not maintain the integrity of transferred packet streams nor maintain the autocorrelation within packet transfer delay process or within packet loss process. Moreover, they lack any cross-correlation between delay and loss generation processes. On the other hand, the studies of packet transfer characteristics in the Internet, e.g., as these presented in [8–11], point out the significant dependencies in the Internet traffic that results in strong correlation between delays and losses experienced by transferred packets, as well as, the long rage dependency. This effect is especially visible for packets sent in a sequence with small inter-packet gaps. Furthermore, the autoregression analysis of Internet traffic, which was performed in [10], suggests that the transfer delay of given packet strongly characterizes the transfer delay of the consecutive one. The constraints of the NetEm tool, which we briefly presented above, are a topic of more detailed discussion in section 2. Following those limitations we formulate the requirements for the design of a new emulation method. In our method, named EmPath, the delays and losses experienced by transferred packets are modeled as a Markov process. However there are also solutions that use Markovian description for this purpose, e.g., in [12] and [13], our model correlates both the delay and loss processes into one solution. Moreover, our approach uses multiple transition matrices, where each of them is conditioned on the status of the proceeding packet. Contrary to previous works, we do not try to fit the transition matrices using linear programming optimization. We derive necessary conditional probabilities from the delay traces measured in a live network by sending the probing packets with small inter-packets gaps. Notice that the correlation depends on the duration of inter-packets gap. Therefore, for each incoming packet we observe its inter-packet gap and then we calculate a number of steps over the transition matrix; the number of steps depends on the inter-packet gap. Finally, we implemented this emulation method as an open source tool for the Linux kernel with version 2.6. The paper is structured as follows: in section 2, we recall the concept of network emulation and we discuss the requirements for useful emulators. Then, we analyze the NetEm tool and we show its capabilities and limitations. After that, in section 3, we present the proposed emulation algorithm that is based on the Markov model and we focus on implementation issues. In the next section, we show results of exemplary experiments that show performance of our tool. Finally, section 5 summarizes the paper and gives a brief outline of further works.
EmPath: Tool to Emulate Packet Transfer Characteristics in IP Network
3
pdf
correlation
Measured packet transfer characteristics, e.g. packet delay distribution, losses, correlations
lag
delay
Input data
Network Emulator
Tested protocol
Fig. 1. The concept of network emulation.
2
The problem statement
In this section we recall the concept of network emulation and present its applications for experimentally driven research. Then, we discuss requirements for designing a network emulator. From this point of view, we study the effectiveness of widely used NetEm tool [7]. Our experiments aim to identify NetEm capabilities and limitations. The obtained results motivate us to design and implement the EmPath emulation tool. 2.1
The concept of network emulation
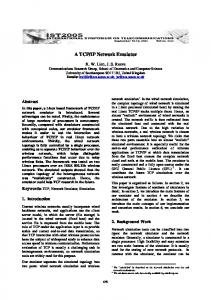
The concept of network emulation assumes that instead of performing experiments in a live network, we measure packet transfer characteristics offered in the network, and on that basis, we synthetically reproduce the packet transfer process in a single device, called the network emulator. As illustrated in Fig. 1, the network emulator should statistically provide the same values of packet transfer delay, delay variation, packet loss and correlation between consecutive packets as in a live network. Therefore, in principle, there should be no difference if an incoming packet is served by network or by emulator. The network emulator is regarded as a convenient tool for supporting experimental driven research, prototype testing and designing of new protocols [14]. It may be treated as a complementary approach for testing real code in “semisynthetic” environment [1]. The key advantages of network emulation comparing to simulation techniques and network trails are the following. First, the network emulator allows for testing of prototype implementations (real code and physical
4
J. Sliwinski, A. Beben, P. Krawiec
equipment) with theirs software or hardware limitations. Second, the network emulator allows for repeating tests under the same network conditions, what is practically impossible in the case of live network trials. Last but not least, the network emulator simplifies the tests in complex network scenarios since it reproduces end-to-end characteristics without modeling details of network elements. In addition, lab environment does not need to have the access to a live network. On the other hand, the network emulator is not a perfect solution, because it just follows the network behavior that was observed in the past. This is usually performed by gathering packet traces that should be representative for given experiment. Therefore, the collection of packet traces is a crucial issue. These packet traces may be obtained from live network, from testbed environment or even from simulation experiments. As we mentioned above, the network emulator requires a method for accurate replication of the packet transfer process. The method should statistically assure the same service of packets as in the case that they would be handled in the network; nevertheless, one must define measurable features, which can be used for evaluation of emulator’s effectiveness. In this paper, we consider the following conditions: 1. the emulator should provide the same probability distribution of packet transfer delay and packet loss as it was observed in the network. In this way, the network emulator provides accurate values of IP performance metrics, e.g., IP packet transfer delay (IPTD), IP packet delay variation (IPDV), IP packet loss ratio (IPLR), defined in [15]. 2. the emulator should introduce similar autocorrelation of the packet transfer delay process and the packet loss process. The autocorrelation is an important factor that shows how the emulator represents the dependencies between samples in a given realization of the process. Our analysis is focused on the correlograms (autocorrelation plots). 3. the emulator should allow for maintaining cross-correlation between emulated processes as it was experienced by packets in the network. This feature shows how the method captures dependencies between different random processes, i.e., between packet delay process and packet loss processes. We measure the cross-correlation by correlation coefficient [16]. 4. the emulator should maintain the packet stream integrity as occurs in the live network. This feature is important, because reordered packets may have deep impact on the protocol performance. We measure the level of packet stream integrity by IP packet reordered ratio (IPRR) metric defined in [15]. 2.2
Case study: NetEm tool
In this case study we focus on evaluation of capabilities and limitations of NetEm emulator [7] available in Linux operating system. The NetEm uses four independent processes to emulate the network behavior that are: (1) packet delay process, (2) packet loss process, (3) packet duplication and (4) reordering process.
EmPath: Tool to Emulate Packet Transfer Characteristics in IP Network
5
100
Probability
10−1 10−2 10−3 10−4 10−50
10
20 30 Delay [ms]
40
50
Fig. 2. Histogram of packet transfer delay for original network.
The packet delay process uses delay distribution stored in the form of inverted cumulative distribution function. The NetEm offers a few predefined distributions, e.g., uniform, normal and Pareto, but it also allows to provide custom distributions. They could be created from packet delay traces by maketables tool available in iproute2 package. Notice that the traces with packet transfer delay samples are not usually publicly available. Taking into account this fact, we used “one point” packet traces (with volume of traffic over time) and performed simulations to obtain delay and loss characteristics. We selected one of the traffic traces that are available in the MAWI repository [17], i.e., a trace file captured in sample point F of the WIDE network on the 1st of November 2009 (file name 200911011400.dump). This sample point records traffic going in both directions of an inter-continental link. In the network emulation, we were interested in one direction, so we filtered the trace file to include only the packets with destination Ethernet address 00:0e:39:e3:34:00. In simulations, we used only IP packets (version 4 and 6) without overhead of Ethernet headers; there were 6 non-IP packets and they were discarded. Finally, the filtered trace file covered around 8.2 × 109 bytes that were sent over 15 minutes; the mean bit rate of traffic was close to 73 Mbps. Note that the packet trace was collected in a single point in the network. In order to obtain packet transfer delay and loss characteristics we performed simple simulation experiment. First, we created a topology with 2 nodes that are connected by 100 Mbps link with 10 ms propagation delay. The size of output buffer for each interface was set to 300 packets. Next, we introduced two traffic streams: (1) background stream based on the prepared packet trace, and (2) foreground constant bit rate stream using 100 byte packets emitted every 1 ms (bit rate equal to 800 kbps). Since the link capacity in the original packet trace was equal to 150 Mbps, we artificially created a bottleneck where queueing effects appeared. Finally, we recorded the packet delay and loss traces for the probing stream. The obtained histogram of delay distribution is presented in Fig. 2.
J. Sliwinski, A. Beben, P. Krawiec
100
100
10−1
10−1 Probability
Probability
6
10−2 10−3 10−4
10−2 10−3 10−4
10−50
10
20 30 Delay [ms]
40
10−50
50
(a) NetEm with default configuration
10
20 30 Delay [ms]
40
50
(b) NetEm with integrity
Fig. 3. Histograms of packet transfer delay for NetEm tool.
On the basis of these delay samples, we prepared a distribution table for NetEm tool. This table was used for tests in a testbed network, which consisted of 3 nodes (PCs) connected in cascade by 1 Gbps links, similarly to the scenario presented in Fig. 1. The middle node runs NetEm (with our custom delay distribution table), while the other two run MGEN [18] to generate traffic. All nodes were synchronized with the GPS clock with time drift below 100 µs. The traffic emitted by the generator had the same profile as the foreground traffic used in simulation (constant bit rate, 100 byte IP packets, 1 ms inter-packet gap). Using this setup we performed measurements in two test cases: Case 1: NetEm with default configuration, Case 2: NetEm with enforced packet stream integrity. Fig. 3 shows the histogram of packet transfer delay for both test cases. Moreover, Table 1 presents values of performance metrics measured for NetEm with reference to the original network. In the first test case, we observe that the delay distribution is maintained up to 23 ms, but above this value the distribution is trimmed; all greater mass of probability is assigned to the last value. This effect comes from the NetEm’s delay distribution storage method, which in default configuration does not allow Table 1. Results of NetEm tests. original NetEm NetEm network with integrity mean IPTD [ms] 11.7 stddev of IPTD [ms] 3.3 IPLR [%] 0.215 IPPR [%] 0 cross-correlation coeff. 0.26
10.4 0.6 0.213 46 0.00
14.7 3.8 0.213 0 0.00
original NetEm NetEm - integrity
0.8 0.6 0.4 0.2 0.0 −0.2 0
7
original NetEm NetEm - integrity
0.8 Autocorrelation of loss
Autocorrelation of delay
EmPath: Tool to Emulate Packet Transfer Characteristics in IP Network
0.6 0.4 0.2 0.0
10
20
Lag
30
40
(a) packet transfer delay
50
−0.2 0
10
20
Lag
30
40
50
(b) packet loss
Fig. 4. Correlogram of packet transfer delay and packet loss.
the values to differ more than 4 times standard deviations from the mean value. This behavior limits the usage of distributions with long tails, which are typically observed in the Internet [8]. Other limitation appeared in the form of large amount of reordered packets, i.e., more than 46% packets changed the order in packet stream. In the second test case, we changed the default behavior of NetEm to maintain the packet stream integrity (we changed queue type from tfifo to pfifo). This modification caused that the delay distribution changed it’s shape and parameters, see Fig. 3(b) and Table 1. In Fig. 4, we presented the correlograms (autocorrelation plots) of delay and loss processes as observed in both test cases and original network. Notice that, for both first and second test case, the autocorrelation function of these processes is not maintained. In fact, the loss process is entirely uncorrelated, while the delay process shows minor autocorrelation only for the second test case caused by enforcing integrity. We also see that, not only each process shows no autocorrelation, there is no cross-correlation between packet transfer delay and packet loss processes. In original network the cross-correlation coefficient equals about 0.24, while for both NetEm tests it is zero (no correlation). The lack of correlation motivated us to perform additional test with NetEm’s built-in correlation feature. Comparing the results of this test with the first test case, we observe lack of lost packets. This effect comes from incorrect implementation of NetEm “correlation” model when inverted cumulative distribution function is used. Therefore, we ignored these results. By performing the above validation, we concluded that the NetEm emulation model has important lacks. This motivated us to create a new model that mitigates NetEm’s limitations and allows for more precise replication of network characteristics.
8
J. Sliwinski, A. Beben, P. Krawiec
3
Emulation method in EmPath tool
In this section we present the EmPath tool. After describing the proposed algorithm we focus on its implementation in Linux kernel. 3.1
The emulation algorithm
The EmPath uses two random processes to emulate packet transfer. The first process decides whether incoming packet is lost or transferred, while the second process determines the delay of transferred packets. Specifically, we define these processes as: – the packet loss process, named L(t), which takes the value 1 when incoming packet is lost and 0 otherwise, – the packet transfer delay process, named D(t), which determines the delay observed by transferred packet. Next, we define discrete-times series {Li } and {Di }, based on the above processes using moments of packet arrivals ti , where i = 1, 2, 3, . . . denotes packet number, as: – {Li }, where Li = L(ti ), – {Di }, where Di = D(ti ). We assume that emulator’s decision about incoming packet depends only on the status of the previous packet and current inter-packet gap. This assumption allows us to use a discrete-time Markov process with the following generic equation: (Ln−1 , Dn−1 , tn − tn−1 ) → (Ln , Dn ). (1) Although we could apply more complex models with broader range of dependencies (beyond n − 1 state), our choice originates from the usual behavior of the queueing systems. Moreover, implementation of models with “long” memory of the process is unfeasible due to state space explosion. Notice that, the generic rule (1) uses real numbers for Dn−1 , tn−1 and tn , which for efficient implementation would require us to know the exact distribution functions. In order to circumvent this limitation, our model uses simplified representation with quantized values. First, we assume that quantized delay values can be grouped into a number of predefined states (with relation f (delay) → state). Furthermore, we introduce a special state sloss that is used to emulate the delay of the packet transfered after any lost packet. Next, we treat the packet inter-arrival period with finite resolution of time ∆ = tn − tn−1 , where all packets arriving within one time unit ∆ observe the same result (loss or delay). Finally, for each state s we need to know: – the probability of packet loss ls , – the conditional probability distribution of packet delay ds under the condition that current packet is not lost (the support set of this distribution is also quantized).
EmPath: Tool to Emulate Packet Transfer Characteristics in IP Network nΔ
(n+1)Δ
(n+2)Δ
(n+3)Δ
(n+4)Δ
9 time
sloss
s2
s1
s0
state
{delayn}
{lossn+1}
{delayn+2}
{delayn+3}
Fig. 5. Exemplary operation of the emulation algorithm.
Using the above variables the emulation algorithm for each time unit ∆ summarizes as: 1. Check packet loss against ls . 2. If packet is lost, set current state to s ← sloss , return the result {loss} and stop the algorithm. 3. Generate new delay from distribution ds . 4. Update the current state according to the relation s ← f (delay). 5. Return the result {delay} and stop the algorithm. In order to better understand the proposed emulation method, let us consider the example presented in Fig. 5, which shows few transition steps. Initially (time moment n∆ ), the algorithm is in state s0 . As new packet arrives, the decision is made that it would not be lost and that it would observe a delay equal to {delayn }. Furthermore, this value of delay is related to a new state s1 for the algorithm. Consequently, in time moment (n + 1)∆ the algorithm uses another loss probability and delay distribution table. This time, it was decided that packet should be lost, so algorithm switches into a state sloss and it returns a result {lossn+1 }. Following this scheme, the algorithm switches in next steps into states s0 and s2 with respective loss and delay distributions, and returns exemplary values {delayn+2 } and {delayn+3 }. The emulation algorithm must be performed for each time unit ∆, so the number of iterations is proportional to the duration of packet inter-arrival time,
10
J. Sliwinski, A. Beben, P. Krawiec
e.g. for packet inter-arrival time equal to k ∗ ∆ it requires k iterations. This behavior may hamper the emulator performance, especially when there are long idle periods between arriving packets. In order to improve emulator performance, we can calculate new table with analogical distributions for time unit 2∆ based on distributions ls and ds for time unit ∆. This is similar to Markov chain when we want to obtain transition matrix with “two steps” from transition matrix with “one step”, i.e., we calculate a square of transition matrix. This method can by applied recursively for any time unit in the form 2n ∆. Consequently, using multiple tables for different time units we reduce the complexity to the logarithmic level, e.g., for inter-arrival 78∆ it is sufficient to use 4 iterations as 78∆ = (64 + 8 + 4 + 2)∆. 3.2
Implementation
The core part of the EmPath is implemented as a kernel module of the Linux operating system. Similar to the NetEm tool, our tool is implemented as a packet scheduler, which can be deployed on a network interface (the kernel module is named sch empath). The emulation algorithm is applied to each packet arriving to the interface, which is dropped or delayed in first-in first-out queue. While the decision about packet loss can be implemented using single condition, the representation of the delay distribution requires more attention. As our emulation model assumes multiple distribution tables that are used depending on the current state, we decided to use less memory consuming tree-like structure. Moreover, the EmPath kernel module allows for recursive calculation of “two step” distribution tables from any ∆ time unit into 2∆ one. The second part of our tool is the extension of tc tool in the iproute2 package. The tc tool allows for deployment and configuration of various packet schedulers from the user space of the Linux operating system. Our extension reads a specially formatted files containing packet loss probabilities and packet transfer delay distributions. Notice that the Linux kernel does not support calculations with floating point numbers. Consequently, both EmPath extension of tc tool and EmPath kernel module use fixed point representations with unsigned 32 bit integer numbers. This choice was also motivated by the fact that the default kernel random number generator that we use: function net random(), which provides unsigned 32 bit integer values. We released the EmPath tool as open source software available at address http://code.google.com/p/empath/.
4
Evaluation of EmPath tool
In order to start the evaluation of EmPath tool we created tables with conditional probability distributions of packet transfer delay. We used the same packet delay traces for the original network that were used in the NetEm case study (see section 2.2). The profile of traffic stream used for sampling the delay and loss
100
100
10−1
10−1 Probability
Probability
EmPath: Tool to Emulate Packet Transfer Characteristics in IP Network
10−2 10−3 10−4 10−50
11
10−2 10−3 10−4
10
20 30 Delay [ms]
40
50
10−50
(a) original network
10
20 30 Delay [ms]
40
50
(b) EmPath emulation
Fig. 6. Histograms of packet transfer delay in EmPath experiment.
processes considered 1 ms intervals, so the time unit was set to ∆ = 1 ms. Furthermore, the resolution of delay distributions was set to 1 ms. Taking into account that the range of the packet transfer delay was equal to 30 ms we decided to use 31 states (including one “loss state”). Therefore, we prepared 31 delay distributions and packet loss values, one for each state. The experiment was performed in the same network topology as used for the NetEm use case (3 nodes connected in cascade where middle node provided emulation capabilities). The profile of measurement traffic remained the same. Fig. 6 presents histograms of delay for original network and for values measured with EmPath tool (more than 10 million packets were emitted). The shape of the delay distribution, as well as, performance metrics (shown in Table 2) are very similar to the original characteristic. The recovered distribution is shifted to the right due to assumed 1 ms delay resolution. Moreover, Fig. 7(a) shows that the autocorrelation function of delay process is similar to the original network, which suggests that proposed model correctly captures this characteristic. For the characteristic of the loss process, the mean value (IPLR) is similar, but the autocorrelation functions (shown in Fig. 7(b)) differ for lower lags. This indicates that the assumed emulation method of packet losses is insufficient in
Table 2. Selected metrics measured in the EmPath experiment. original EmPath network emulation mean IPTD [ms] 11.7 stddev of IPTD [ms] 3.3 IPLR [%] 0.215 IPPR [%] 0 cross-correlation coeff. 0.26
12.1 3.4 0.231 0 0.24
12
J. Sliwinski, A. Beben, P. Krawiec
original EmPath
0.6 0.4 0.2 0.0 −0.2 0
original EmPath
0.8 Autocorrelation of loss
Autocorrelation of delay
0.8
0.6 0.4 0.2 0.0
10
20
Lag
30
40
(a) packet transfer delay
50
−0.2 0
10
20
Lag
30
40
50
(b) packet loss
Fig. 7. Correlogram of packet transfer delay and packet loss.
short term time scale (the geometric distribution is too simple). One may extend the model to add more states related with losses, e.g., by adding a condition for rare loss events upon other rare loss events. Consequently, it would require us to gather much more samples from original network when preparing the distribution tables. On the other hand, the cross-correlation coefficient between delay and loss processes is similar for original network (0.26) and for EmPath emulation (0.24). Furthermore, the EmPath tool guaranteed no packet reordering. Notice that, while the implementations of NetEm and EmPath tools are similar in their nature, EmPath provides more realistic characteristics and features of emulated network.
5
Summary
In this paper we investigated the problem of network emulation. Our objective was to emulate the packet transfer characteristics offered by a network path. We performed experiments with the widely used NetEm tool, which is available in the kernel of Linux operating system. The obtained results showed several limitations of the NetEm tool, related to limited range of packet transfer delay distribution, lack of correlation between packet transfer delays and packet losses lack of packet stream integrity. These limitations motivated us to design more effective emulation method and implement own tool called EmPath. In our method, the delays and losses experienced by transferred packets are modeled as a Markov process that uses multiple transition matrices, where each of them is conditioned on the status of the proceeding packet. Our method guarantees the distribution of packet transfer delay without a packet reordering and introduces correlation of delay and loss processes (autocorrelation and cross-correlation) in similar way as observed in a live network. The parameters required by EmPath, such as conditional probability distribution of packet delays and losses are directly derived from the delay traces measured in a live network.
EmPath: Tool to Emulate Packet Transfer Characteristics in IP Network
13
We implemented EmPath tool in the Linux kernel and released it under GNU Public License. Then, we preformed experiments to verify the EmPath capabilities and possible limitations. The obtained results, as illustrated in the included examples, confirmed the effectiveness of the proposed method and EmPath tool. In further work, we plan to focus on extending the model of loss process for inclusion of burst losses which was identified as a slight limitation of EmPath tool. Moreover, we plan more experiments for delay and loss traces collected in different network environments.
References 1. Carson, M., Santay, D.: Nist net: a linux-based network emulation tool. SIGCOMM Comput. Commun. Rev. 33(3) (2003) 111–126 2. Fall, K.: Network emulation in the vint/ns simulator. In: Computers and Communications, 1999. Proceedings. IEEE International Symposium on. (1999) 244–250 3. Vahdat, A., Yocum, K., Walsh, K., Mahadevan, P., Kostic, D., Chase, J., Becker, D.: Scalability and accuracy in a large-scale network emulator. OPERATING SYSTEMS REVIEW 36 (2002) 271–284 4. Rizzo, L.: Dummynet: a simple approach to the evaluation of network protocols. SIGCOMM Comput. Commun. Rev. 27(1) (1997) 31–41 5. Yeom, I., Reddy, A.N.: Ende: An end-to-end network delay emulator tool for multimedia protocol development. Multimedia Tools and Applications 14(3) (2001) 269–296 6. Avvenuti, M., Vecchio, A.: Application-level network emulation: the emusocket toolkit. Journal of Network and Computer Applications 29(4) (2006) 343 – 360 7. Hemminger, S.: Network Emulation with NetEm. In: Linux Conf Au. (April 2005) 8. Papagiannaki, K., Moon, S., Fraleigh, C., Thiran, P., Diot, C.: Measurement and analysis of single-hop delay on an ip backbone network. Selected Areas in Communications, IEEE Journal on 21(6) (Aug. 2003) 908–921 9. Piratla, N., Jayasumana, A., Smith, H.: Overcoming the effects of correlation in packet delay measurements using inter-packet gaps. In: Networks, 2004. (ICON 2004). Proceedings. 12th IEEE International Conference on. Volume 1. (Nov. 2004) 233–238 vol.1 10. Vivanco, D.A., Jayasumana, A.P.: A measurement-based modeling approach for network-induced packet delay. In: LCN ’07: Proceedings of the 32nd IEEE Conference on Local Computer Networks, Washington, DC, USA, IEEE Computer Society (2007) 175–182 11. Borgnat, P., Dewaele, G., Fukuda, K., Abry, P., Cho, K.: Seven years and one day: Sketching the evolution of internet traffic. In: INFOCOM 2009, IEEE. (April 2009) 711–719 12. Zinner, T., Tutschku, K., Nakao, A., Tran-Gia, P.: Performance evaluation of packet re-ordering on concurrent multipath transmissions for transport virtualization. In: 20th ITC Specialist Seminar, Hoi An, Viet Nam (May 2009) 13. Nebat, Y., Sidi, M.: Resequencing considerations in parallel downloads. In: INFOCOM 2002. Twenty-First Annual Joint Conference of the IEEE Computer and Communications Societies. Proceedings. IEEE. Volume 3. (2002) 1326–1335 vol.3 14. Owezarski, P., Berthou, P., Labit, Y., Gauchard, D.: Laasnetexp: a generic polymorphic platform for network emulation and experiments. In: TRIDENTCOM’2008. (2008)
14
J. Sliwinski, A. Beben, P. Krawiec
15. ITU-T Recommendation Y.1540: IP packet transfer and availability performance parameters (November 2007) 16. Krickeberg, K.: Probability Theory. Addison-Wesley (1965) 17. Cho, K., Mitsuya, K., Kato, A.: Traffic data repository at the wide project. In: ATEC ’00: Proceedings of the annual conference on USENIX Annual Technical Conference, Berkeley, CA, USA, USENIX Association (June 2000) 51–51 18. Naval Research Laboratory: Multi-Generator Toolset (MGEN) 4.0. http://cs.itd.nrl.navy.mil/work/mgen/ (Nov 2009)