18. Do you sell or produce value added products such as baked goods, cider, painted pumpkins, etc.? â Yes. â No. 19. Do you grow cut flowers? â Yes. â No.
New Jersey Agricultural Experiment Station P-02139-1-00 May, 2000
Empirically Evaluating Grower Characteristics and Satisfaction with Organic Production
Ramu Govindasamy John Italia Marc DeCongelio Karen Anderson Bruce Barbour
Department of Agricultural, Food and Resource Economics Rutgers Cooperative Extension New Jersey Agricultural Experiment Station Cook College Rutgers, The State University of New Jersey New Brunswick, New Jersey 08901
Empirically Evaluating Grower Characteristics and Satisfaction with Organic Production Ramu Govindasamy John Italia Marc DeCongelio Karen Anderson Bruce Barbour
Ramu Govindasamy is an Assistant Professor & Extension Specialist in Marketing, John Italia is a former Program Associate, Marc DeCongelio is a Graduate Assistant in the Department of Agricultural, Food & Resource Economics, Karen Anderson is the Executive Director of Northeast Organic Farming Association of NJ, and Bruce Barbour is Chair of Agriculture & Resource Management Agents Department & Assistant Director of Extension. Correspondence Address: Ramu Govindasamy, Assistant Professor Department of Agricultural, Food and Resource Economics Cook College Rutgers, The State University of New Jersey 55 Dudley Road, New Brunswick, New Jersey 08901-8520 Phone: (732) 932-9171 ext. 254
Acknowledgements Appreciation is expressed to each and every participant of the organic producer survey. This study would not have been possible without their input and contribution. Appreciation is extended to Dr. Vance Young and Mr. Ronald Good of the New Jersey Department of Agriculture, for their help in conducting this research. Appreciation is also extended to the Agricultural Marketing Service of the United States Department of Agriculture, the New Jersey Department of Agriculture, and to Cook College at Rutgers University which provided funding for this study.
ii
Table of Contents Acknowledgements . . . . . . . . . . . . . . . . . . . . . . . . . . . . . . . . . . . . . . . . . . . . . . . . . .
ii
Executive Summary . . . . . . . . . . . . . . . . . . . . . . . . . . . . . . . . . . . . . . . . . . . . . . . . . .
v
I.
Introduction . . . . . . . . . . . . . . . . . . . . . . . . . . . . . . . . . . . . . . . . . . . . . . . . . . .
1
II.
Data Description . . . . . . . . . . . . . . . . . . . . . . . . . . . . . . . . . . . . . . . . . . . . . . .
5
III.
Methodology . . . . . . . . . . . . . . . . . . . . . . . . . . . . . . . . . . . . . . . . . . . . . . . . . .
14
IV.
Empirical Results . . . . . . . . . . . . . . . . . . . . . . . . . . . . . . . . . . . . . . . . . . . . . . .
21
V.
Conclusions. . . . . . . . . . . . . . . . . . . . . . . . . . . . . . . . . . . . . . . . . . . . . . . . . . .
32
VI.
References . . . . . . . . . . . . . . . . . . . . . . . . . . . . . . . . . . . . . . . . . . . . . . . . . . .
36
List of Tables Table 1:
Organic Percentage of Total Gross Income . . . . . . . . . . . . . . . . . . .
8
Table 2:
Organic Crops by Number of Growers and Average Acreage . . . . . . . . . .
12
Table 3:
Organic Crops Cross Tabulated with Profit Margin Satisfaction . . . . . . . . .
13
Table 4:
Description of Explanatory Variables for Logistic Models . . . . . . . . . . . .
16
Table 5:
Producers Intending to Expand the Organic Production (Model One) . . . . . .
22
Table 6:
Prediction Success For Model One . . . . . . . . . . . . . . . . . . . . . . .
22
Table 7:
Organic Producers with Increasing Gross Sales (Model Two)
. . . . . . . . .
25
Table 8:
Prediction Success For Model Two . . . . . . . . . . . . . . . . . . . . . . .
25
Table 9:
Producers Satisfied with Returns from Organic Production (Model Three) . . . . 28
Table 10:
Prediction Success For Model Three . . . . . . . . . . . . . . . . . . . . . .
Table 11:
Model Comparison . . . . . . . . . . . . . . . . . . . . . . . . . . . . . . . . . 31
iii
28
List of Figures Figure 1:
What is Your Opinion About the Popularity/Opinion of Organic Produce Among Consumers? . . . . . . . . . . . . . . . . . . . . . . . . . . . . . . .
7
Do You Feel Adequate Channels/Consumer Demand Exists to Market Your Organic Produce? . . . . . . . . . . . . . . . . . . . . . . . . . . . . . . . .
7
Which of the Following Terms Do You Think Best Characterizes Your Stage of Business Development . . . . . . . . . . . . . . . . . . . . . . . . . . . . .
8
What is the Trend in Your Annual Gross Sales of Organic Produce in the Last Five Years?. . . . . . . . . . . . . . . . . . . . . . . . . . . . . . . . . . . .
8
Do You Participate in an IPM Scouting Program or Use IPM Practices on Some of Your Crops? . . . . . . . . . . . . . . . . . . . . . . . . . . . . . . . . . .
9
Do You Provide Forms of Agritourism for Consumers Such as Hayrides, PickYour-Own, etc.? . . . . . . . . . . . . . . . . . . . . . . . . . . . . . . . . .
9
Figure 7:
How Satisfied Are You With the Profit Margin From Organic Production? . . . .
9
Figure 8:
Do Customers Complain About Blemishes or Insect Damage on Your Organic Produce? . . . . . . . . . . . . . . . . . . . . . . . . . . . . . . . . . . . . .
9
Do You Use Any Logos to Identify Your Fresh Produce as Certified Organic? .
10
Figure 10: How Do You Believe the Labels Have Affected Your Fresh Produce Sales? . .
10
Figure 11: How Do You See the Organic Portion of Your Farm Business Changing in the Next Five Years? . . . . . . . . . . . . . . . . . . . . . . . . . . . . . . . . .
11
Figure 12: How Does Your Amount of Organic Acreage Compare to Five Years Ago? . . .
11
Figure 13: Total Gross Income of Organic Producers . . . . . . . . . . . . . . . . . . . .
13
Figure 2:
Figure 3:
Figure 4:
Figure 5:
Figure 6:
Figure 9:
iv
Executive Summary Organic production has been practiced in the United States since the late 1940s. Since then, the organic industry has developed from small gardens to large farming operations. The government has proposed standards to establish what products may be classified as ‘organic.’ pesticides.
Organic products are those produced with no synthetic
Due to the laborious workload of producing products without synthetic
pesticides, organic products are often sold at a premium.
New Jersey, New York, and Pennsylvania have relatively more organic production than other states due to the higher value of land in the area and proximity to New York City and Philadelphia. This is because organic production commonly reaps higher profits per acre than conventional production does. The purpose of this study is to produce a profile of the typical organic farmer in these states, and to determine how satisfied they are with the current marketing channels that are open to them to market their organic produce. Specifically, the objectives are to determine producer characteristics such as: •
The average acreage in organic production.
•
The variety of organic produce sold.
•
The different modes of advertising used in the sale of organic produce.
•
The marketing channels used, such as wholesale, retail and direct marketing.
Additionally, three econometric models are formulated to estimate the following: •
The characteristics of organic farmers that plan to extend their organic production over the next five years.
•
The characteristics of organic farmers that have had increases in gross sales per year over the last five years.
•
The characteristics of organic farmers that are satisfied with their returns from organic production.
The logit framework is used for the regressions in this analysis because its asymptotic characteristic constrains the predicted probabilities to a range of zero to one. The v
estimation method is the maximum likelihood estimation (MLE). Hence, given certain organic producer characteristics, the probability that the producer plans to expand their production is found. Similar explanations exist for the other two models. The three models are estimated using information obtained from the producers’ questionnaire located at the end of this report. These models identify the factors that significantly contribute to producers’ satisfaction with profits and the growth of the organic portion of their business.
As expected, the average organic farm size of the sample was extremely small when compared to the mean farm size of each of the participating states. Furthermore, less than 18 percent of the respondents indicate that they are not satisfied with the profit margin they are able to generate from their organic production.
Tomatoes were
organically grown by more growers than any other crop was organically grown. However, producers reported the highest satisfaction with their returns from the three commodities grown by the fewest number of growers (apples, cattle and milk).
Those organic producers who plan to extend their production in the next five years are likely to currently rent some of their land, to produce cattle but not milk, to grow herbs, to use Integrated Pest Management (IPM), to provide forms of agritourism such as hay rides and pick-your-own farms, to be younger farming operations, and to have had an increase in sales over the last five years. About two-thirds of the sample plans to increase production.
Those organic producers that have had increases in gross sales per year over the last five years are likely to have at least 70% of their land in organic production, to grow vegetables but not herbs, to use labels to identify their products as certified organic, and to be younger farming operations.
Again, about two-thirds of the sample has had
increases in gross sales over the last five years.
vi
Those organic producers that are satisfied with their returns from organic production are more likely to be older farming operations, to have had an increase in sales over the last five years, to use labels to identify their products as certified organic, and to produce cattle. About two-fifths of the sample reported that they are satisfied with their returns from organic production.
This report is phase one of a two phase report. Phase II will focus on the consumer characteristics of those who buy organic produce. The models in this report correctly predict the state of the dependent variable at least in 65% of the responses, while two of the models predict correctly 71% of the responses. This phase of the main report accomplishes finding the characteristics of organic producers that plan to expand their operations, that have had an increase in sales over the last five years, and that are satisfied with their organic production returns.
This knowledge will be used in
conjunction with Phase II to produce an over-all picture of the organic industry in the northeastern United States.
vii
Introduction The market for organic foods is one of the fastest-growing agricultural segments of the economy.
A nationwide study shows that sales from the organic food industry
approached $3.3 billion in 1998 and is currently growing at a yearly rate of 20 to 24 percent. This compares to sales of near $2.08 billion in 1995 (Dimitri and Richman, 2000). The defining characteristic of organic agriculture is the absence of synthetic chemical pesticides.
This attribute addresses the strong risk aversion to pesticide
residues, which is held by the majority of American consumers (Zellner and Degner, 1989; Zind, 1990; Burgess et al., 1989; Govindasamy, Italia and Liptak, 1997; Byrne et al., 1991, Misra, Huang and Ott, 1991). Furthermore, in an altruistic sense, significant concerns about pesticide damage to wildlife, farm workers, and the environment have been documented (Weaver et al., 1992) which also bolster support for organic production and the reduction of synthetic pesticides. When pest control does become necessary in organic agriculture, natural pesticides and biological controls can help decrease crop damage and short-run economic losses. If used in conjunction with crop diversification, rotation, and cultural practices, organic methods of pest control customarily limit disease and insect damage to economically acceptable levels (Klonsky et al., 1992). Estes and Smith (1996) found only a weak linkage between willingnessto-pay and the cosmetic appearance of organic produce. This result suggests that the most important motivation that consumers exhibit when purchasing organic produce is sensitivity to their health and safety rather than other produce quality characteristics. While organic produce was predominately sold through direct marketing facilities as recently as 1990, it has since become commonplace in grocery chain stores and supermarkets. Organically grown produce is typically sold for a premium price over conventionally grown produce. However, returns to growers are dictated by the total supply, consumer demand, and the available organic outlets (Klonsky et al., 1992). In comparison to conventional agriculture, organic production can be more labor intensive and result in greater losses to disease and insects. For this reason, organic production is favored by smaller farms, which can often manage organic production more effectively and also capitalize on a niche market rather than profit from economies 1
of scale. In New Jersey, for instance, the mean area of an organic farm is 41 acres while the average overall farm size is 99 acres. Similarly, in Pennsylvania the average organic farm is only about one-fifth the area of the mean Pennsylvanian farm (1992 Census of Agriculture). Organic farming is a unique value-added form of agriculture, which relies almost universally on small growers and small farms. Yet, in today’s market, small farmers have been increasingly challenged to survive, much less expand. Marketing research in organic farming not only helps to address inadequacies in the current knowledge of the organic market, but also provides innovative new options for struggling small farmers. Because the profit margin for organic farms is often above that of conventional farms, market development in this area could enhance both the net profits and sustainability of small farms choosing to service the organic niche market.
Organic production
enhances the potential to increase the net returns to smaller farms, which in turn can work to help save the American small farmer as well. The growth of the organic farms and acreage devoted to the production of organic foods signals a willingness on the part of a segment of consumers to pay for synthetic pesticide-free food even if the result is higher food prices. In 1992, the sales of organic foods represented approximately 26% of gross retail agricultural sales in New Jersey (Govindasamy and Nayga, 1996; Govindasamy, Nayga, and Thatch, 1995). Further research in Delaware shows that young females with a high school education or less, and other consumers with at least some post-graduate work were the groups most likely to regularly purchase organic foods. These results are also supported by Groff et al. (1993).
Research in the states of Delaware, Maryland and Virginia suggests that
consumers were both interested in food-related issues and concerned about government policy and regulations related to food (Byrne, 1992).
Food safety and
healthfulness were more important than price and the majority of the survey respondents expressed a preference to purchase organic foods at supermarkets or familiar roadside stands.
However, availability and higher prices are the major
constraints to organic sales with the segment of consumers who do not purchase organic produce.
2
Increasingly, a sizeable amount of farmland is being converted from traditional agricultural production to the production of organic foods. Analysis of data provided to USDA’s Agricultural Marketing Service (AMS) by private and state organic certification organizations reveals that more than a million acres of U.S. farmland were involved in the production organic foods in 1994 (USDA, 1995). This acreage represents 0.12% of the total U.S. farmland, and accounts for 1% of U.S. agricultural output (Sauber, 1994). The output consists of a wide array of organic crop, livestock, and poultry products either directly from 4,050 certified organic farmers or through 500 processors and distributors who are certified to handle organic food and fiber (Dunn, 1996). Further, 42% of mainstream stores stock an average of 12 organic foods (Food Marketing Institute, 1989).
This figure could increase as consumers gain confidence in the
"organic" label (Dunn, 1996) and as national standards for the production and handling of organic foods are standardized under USDA’s Organic Foods Production Act of 1990. While the standardization of regulations may help increase profits for the organic food industry, consumer concern over food safety may, in part, be responsible for the growth of the industry. Such concern has increased since the 1960's with consumers ranking pesticide residues, followed by antibiotic and hormone use, nitrites, irradiation, additives, preservatives and artificial colors as their most worrisome food safety concerns (Food Marketing Institute, 1989).
These food safety concerns were
highlighted in the media by the case of Alar (daminozide) and apples, and the Chilean grape tampering scare in which some imported grapes were found to be laced with cyanide (Senauer, 1989). Such health related issues have increased the demand for organically grown foods and the need for a better understanding of consumer and household preferences, perceptions, socioeconomic backgrounds as well as some knowledge about farmers and marketers of organically grown produce. This information is needed in order to guide agricultural policy makers and to enhance the possibility of sustained growth in the organic food industry. This study is a two-year project to study the size and structure of the organic produce market in the Northeastern United States.
A coalition of University, Department of
Agriculture, NOFA (Northeast Organic Farmers Association) New Jersey, NOFA New
3
York, and Pennsylvania Certified Organic personnel was organized in order to oversee the project and development of survey instruments. The objectives of this project will be accomplished in two phases, which correspond to a two-year period. Phase I of the project addresses producer characteristics such as the average acreage, variety of produce sold, modes of advertising used, marketing channels such as wholesale, retail and direct market. The findings of Phase I are documented in this bulletin. The second phase will be completed in 2000 and will feature a survey designed to collect information on the characteristics of consumers, their households, and retail organic markets/stores with respect to organic foods.
The Phase II survey will contain
demographic characteristics of consumers who visit organic food markets and also document consumer behavior regarding the purchase of fruits and vegetables, their perception of freshness, quality, quantity, and other information on organic foods. Consumer attitudes toward non-organic foods such as the perceived risk associated with concerns about pesticide residue and the use of chemicals and fertilizers in foods will be examined. Consumer characteristics such as quantity of organic produce bought on a monthly basis, price paid per unit, number of visits per month will also be collected. Both phases of this project involve organic growers and producers from the states of New Jersey, Pennsylvania and New York.
Characteristics of Organic Producers A number of previous studies have examined issues related to the characteristics and production behavior of organic farmers (Lockeretz, 1997; Lockeretz, 1995; Morgan and Barbour, 1991). A survey of Massachusetts growers revealed that organic fruit and vegetable growers differed in several ways from conventional growers in the same region (Lockeretz, 1995). Specifically, organic growers were more likely to be women, were younger in age, and had fewer years of experience when compared to conventional growers. Lockeretz (1997), in particular, statistically evaluated whether organic growers’ characteristics influenced the structure of their organization or their perception of organic agriculture. However, no strong influence was uncovered.
4
The purpose of this phase of the study was to develop a profile of typical Northeastern organic growers. We also attempt to determine if grower characteristics influence the likelihood of a singular producer’s increase in sales over the previous five years, their intent to increase organic output in the future and their satisfaction with the return from organic production. farming
by
The study also contributes to the current literature on organic
illustrating
a
significant
relationship
entertainment agriculture and value added products.
between
organic
producers,
Examining such structure is
important because most organic growers sell organic produce directly to consumers and often conduct festivals and provide entertainment to attract consumers (Govindasamy and Nayga, 1996).
Data Description A survey to collect data on organic grower characteristics was developed in 1998 at Rutgers University. The survey was created with input from the coalition members and included questions dealing with the size, structure and operation of each producer. Questions were also asked about the types of crops that were grown organically and the producer’s overall experience in the organic market. A list of 392 certified organic producers located in New Jersey, New York and Pennsylvania was compiled. A survey packet, which included the questionnaire, a cover letter explaining the purpose and importance of the project, a postage-paid return envelope, and one dollar as a small incentive for participation was included in each envelope sent to producers. The survey packets were distributed by mail in March of 1999.
Of the 392 questionnaires sent to producers, approximately 154 were completed and returned within three weeks of the initial survey mailing. Four weeks after the survey packets were mailed, a reminder post card was mailed to all participants who had not yet returned the survey. The reminder mailing produced an additional 46 responses for a total of 200 returned responses. The producer survey has yielded a response rate of 51 percent, however, approximately 20 returned surveys were discarded because they were too incomplete to include in the analysis. Overall, producers indicated that they
5
were highly appreciative of government funded research into the organic market, that they were supportive of this effort and were interested in obtaining the final reports at the end of the project. The data from the returned surveys was entered into SAS statistical software packages for analysis. As expected, the average organic farm size, 77 acres, of the sample was smaller when compared to the mean farm size of each of the participating states. Furthermore, less than 18 percent of the total respondents (includes all forms of organic operations, including part-time, full-time, etc.) indicate that they are not satisfied with the profit margin they are able to generate from their organic production.
78 percent of the responding growers describe their locale as rural, while 13 percent stated that they are in suburban areas and 3 percent stated that they are located in urban locales. Approximately 35 percent of the sample currently rented at least some of the land farmed and 44 percent operated a greenhouse.
The average level of
experience was 7.4 years as an organic grower with a maximum of 38 years. Over 45 percent had increased the number of organic acres farmed over the previous five years. Cut flowers (organic or conventional) were grown by 28 percent of the respondents while 19 percent produced value-added products such as jams and jellies. In addition to the farm owner, other family members were employed by 59 percent of the growers surveyed. While some producers used both family and non-family hired help, less than half of the growers surveyed hired additional employees outside their family.
In addition to wholesaling, a variety of methods were used to market and distribute organic produce directly to consumers. The most popular forms of advertising were roadside signs (39 percent), printed brochures (31 percent), newspaper advertisements (27 percent) and direct mailings to consumers (18 percent). Approximately 31 percent of producers sold produce at farmers’ markets while 25 percent used roadside stands and 16 percent sold through Community Supported Agriculture (CSA). Various forms of agritourism were used to draw consumers to the farms by 23 percent of the responding growers. Of those 23 percent providing agritourism, 9 percent operated a Pick-YourOwn operation. Other producers strictly wholesaled their organic produce.
6
Many of the growers surveyed are able to interact first-hand with customers at farmers’ markets and thus were familiar with the needs and opinions of their customers. Approximately 79 percent of organic growers believed that consumers had a medium to high opinion of organic produce (Figure 1). The majority of producers surveyed (59 percent) believed that adequate channels for distribution and adequate consumer demand existed to market their organic produce (Figure 2). However, many of the 41 percent who disagreed indicated that it was not the consumer demand for organic products that was insufficient; it was the challenge of finding enough suitable distribution channels.
Figure 1
Figure 2
What is your opinion about the popularity/opinion of organic produce among consumers?
Do you feel adequate channels and consumer demand exists to market your organic produce?
50% 36%
43%
Yes 59%
40%
No 41%
30% 20%
13% 8%
10% 0% High
Medium
Low
Unsure
N = 177
N = 160
The majority of producers surveyed classified themselves as being in the initial or growth stages of establishing their organic business (Figure 3).
This finding is
consistent with earlier studies that show the average age and experience of organic growers is lower than that of conventional growers. Approximately 70 percent of those surveyed indicated that their gross sales had increased annually over the previous five years (Figure 4). Of those who indicated that their yearly organic sales had increased over the past five years, 72 percent were in the growth stage, 20 percent were in the initial stages, 7 percent were in the mature stage and only one grower was in the decline stage of their business. Those who were in the mature stage of business were
7
the most likely to have had no change in their annual organic sales, however, nearly half of those in the mature stage of business were still reporting annual sales increases.
Figure 3
Figure 4
Which of the following terms do you think best characterizes your stage of business development?
What is the trend in your annual gross sales of organic produce in the last five years? No Clear Trend 17%
70% 58%
60%
Increase 70%
50% 40%
No Change 11%
28%
30% 20%
10%
7%
Mature
Decline
Decrease 3%
10% 0% Initial
Growth
N = 168
N = 161
Only a small number of producers currently had some acreage under integrated pest management (IPM) control in addition to the acreage they farmed organically. Approximately 19 percent (33 farms) used IPM practices in addition to organic farming methods (Figure 5). Approximately 24 percent of the growers surveyed provided forms of agritourism such as hayrides (Figure 6) to supplement their income from the sale of organic products. While less than one quarter of the farms made use of either IPM or agritourism, both methods of diversification were found to significantly increase a grower’s satisfaction with returns from organic farming (see model three).
Table 1: Organic Percentage of Total Gross Income Percentage of Total Gross Income in Organic Sales 1 to 9 percent 10 to 49 percent 50 to 74 percent 75 to 99 percent 100 percent
Number of growers
Percentage
24 23 23 13 62
16.4% 15.6% 9.6% 17.0% 41.9%
8
Cumulative Percentage 16.4% 32.0% 41.6% 58.6% 100.0%
Figure 5
Figure 6
Do you participate in an IPM scouting program or use IPM practices on some of your crops?
Do you provide forms of agritourism for consumers such as hayrides, pick-your-own, etc.?
Yes 19%
No 76%
Yes 24%
No 81% N = 171
N = 175
Less than half of the sample (42 percent) were strict organic producers generating their entire gross income from organic production (Table 1). Another 17 percent earned between 75 and 99 percent of their income from organic farming. While some farms that earned less then 100 percent of their gross income from organic farming did so thorough non-agricultural endeavors, the majority of farms in this category earned the remainder of their income through conventional or IPM agriculture.
Figure 7
Figure 8
How satisfied are you with the profit margin from organic production?
Do customers complain about blemishes or insect damage on your organic produce?
37%
40%
Yes 22%
34% 30% 17% 20% 11% 10%
0% Very Satisfied
Satisfied
Somewhat Satisfied
No 78%
Not at All Satisfied
N = 162
N = 142
9
Producers were usually satisfied with the profit margin they were able to obtain from organic produce (Figure 7). Only 18 percent indicated that they were not satisfied with the returns they earned from organic production. Of the 82 percent that were at least “somewhat satisfied” with the profitability of organic agriculture, 37 percent indicated that they were “satisfied” while 11 percent indicated that they were “very satisfied.” Producers did not believe that blemishes or insect damage on produce was a significant problem (Figure 8).
22 percent reported that customers had complained about
blemishes on produce.
Some producers indicated that blemished produce was
discarded before it reached the consumer while others indicated that most consumers who frequently purchase organic produce were not bothered by slight cosmetic defects – a finding that is supported by existing consumer research.
Figure 9
Figure 10
Do you use any logos to identify your fresh produce as certified organic?
How do you believe the labels have affected your fresh produce sales? 63%
Yes 53%
0.6
0.4 25% 0.2
12% 0%
No 47%
0 Increase
N = 167
No Change
Decrease
Unsure
N = 89
Certified organic labeling was found to be an important marketing tool used by many of the surveyed growers. The majority of producers (53 percent) made use of logos to distinguish their products as certified organic (Figure 9). Of those 89 growers who were currently using organic logos, 63 percent believed they had increased their fresh produce sales, 12 percent did not any significant change in sales attributable to the logos and 25 percent were unsure what effect the logos had had.
No logo users
believed the logos had impacted negatively on their fresh produce sales (Figure 10).
10
Producers indicated that they were still expecting strong increases in the market for organic produce (Figure 11). Approximately 64 percent of those surveyed believed that the organic portion of their business would increase over the next five years while 34 percent believed it would remain constant. Only 5 percent of the responding growers expected their organic production to decrease over the next five years.
Figure 11
Figure 12
How do you see the organic portion of your farm business changing in the next five years?
How does your amount of organic acreage compare to the amount five years ago?
Increase 54%
Decreasing 5%
Remaining Constant 34%
Decrease 1%
Increasing 64%
N = 170
No Change 45%
N = 160
For all but 2 growers, the amount of organic acreage had increased (Figure 12) over the last five years (54 percent) or remained constant (45 percent). Those producers whose organic acreage had increased over the previous five years were most likely to be anticipating an increase in the organic portion of their business over the next five years. However, even many growers whose organic acreage had remained constant over the previous five years were expecting an increase in their organic production in the future. Specific organic commodities were cross-tabulated with the number of producers and average acreage in Table 2.
Tomatoes were grown by the largest percentage of
organic growers surveyed (43 percent). Peppers, beans/peas, herbs, and garlic/onions accounted for the four other most popular crops. Of the crops grown organically, apples were produced by the fewest number of growers, yet apple farmers were most likely to
11
be very satisfied with their profit margin from organic farming (Table 3). It is likely that agritourism and autumn related farm entertainment, which are often centered around apples and pumpkins, helped to increase the profitability of organic production. Milk and cattle producers were also among the most satisfied producers with their profit margin from organic production. While herbs were grown by a sizable portion of the growers surveyed, 36 percent, herb farmers were among the least satisfied with the profit margin from organic production. Organic herb producers may have a greater difficulty in connecting with wholesalers than other growers will. Additionally, many herb and nutraceutical crops have additional obstacles such as crop purity and identification complications.
Table 2: Organic Crops by Number of Growers and Average Acreage Number Tomatoes Peppers Beans/Peas Herbs Garlic/Onions Corn Potatoes Lettuce Broccoli Cucumbers Carrots Eggplant Berries Milk Cattle Apples
78 66 65 64 64 62 61 59 51 49 44 42 31 28 22 12
Percent of Sample 43% 37% 36% 36% 36% 34% 34% 33% 28% 27% 24% 23% 17% 16% 12% 7%
Average Acres 3.114 1.816 14.049 0.949 1.326 14.854 2.744 3.475 1.077 3.188 0.439 1.891 1.264 26 (head) 33 (head) 16.380
Maximum Acres 20 10 70 4 7 60 14 12 5 15 2 8 5 120 100 45
The majority of organic producers surveyed (92 percent) classified themselves as small farms according to USDA guidelines. 60 percent of the organic producers indicated grossing less that $30,000 annually, however there were larger growers earning in excess of $500,000 (Figure 13). Many of the producers surveyed had additional forms of income besides organic production.
12
Table 3: Organic Crops Cross Tabulated with Profit Margin Satisfaction* Very Satisfied 18% 16% 15% 11% 11% 11% 10% 10% 10% 9% 8% 8% 7% 7% 7% 5%
Number** Apples Milk Cattle Corn Cucumbers Tomatoes Beans/Peas Peppers Eggplant Potatoes Broccoli Garlic/Onions Carrots Lettuce Berries Herbs
11 24 20 57 47 75 61 62 40 57 49 62 42 57 30 60
Satisfied 55% 50% 45% 42% 40% 36% 39% 38% 38% 32% 43% 34% 38% 37% 37% 35%
Somewhat Satisfied 18% 29% 30% 30% 28% 32% 31% 30% 27% 39% 29% 34% 36% 35% 40% 37%
Not at all Satisfied 9% 4% 10% 17% 21% 21% 20% 22% 25% 21% 20% 24% 19% 19% 17% 23%
* Does not take into account the effect of growing more than one crop ** The number for each crop is generally less than Table X because of respondents who omitted the profit margin satisfaction survey question.
Figure 13: Total Gross Sales of Organic Producers 4
Over $500,000 $350,000-499,999
1
$300,000-349,999
1 3
$250,000-299,999 $200,000-249,999
5
$150,000-199,999
1 11
$100,000-149,999 $60,000-99,999
16
$30,000-59,999
24 20
$15,000-29,999 $5,000-14,999
34
Under $5,000
46
0
10
20
30
Number of Respondents
13
40
50
Logistic Methodology Three binary qualitative choice models were estimated to analyze the effect of various organic grower characteristics using the information drawn from the organic producer surveys conducted in 1999. The logit framework was selected for the regressions in this analysis because its asymptotic characteristic constrains the predicted probabilities to a range of zero to one. The logit model is also favored for its mathematical simplicity and is often used in a setting where the dependent variable is binary. As the survey utilized in this analysis provided individual rather than aggregate observations, the estimation method of choice was the maximum likelihood estimation (MLE) (Gujarati, 1992). Among the beneficial characteristics of MLE are that the parameter estimates are consistent and asymptotically efficient (Pindyck and Rubinfeld, 1991).
The model assumes that the probability of observing a specific outcome (i.e. an individual grower was satisfied with the returns from the organic portion of their business), Pi, is dependent on a vector of independent variables (Xij) associated with consumer i and variable j, and a vector of unknown parameters β. The likelihood of observing the outcome of the dependent variable was tested as a function of explanatory variables that included the size and characteristics of each farm. Pi
=
F(Zi) =
F(α + βXi)
= 1 / [ 1 + exp (-Zi)]
Where: Pi
=
the probability that a specific outcome is observed (i.e. an individual grower was satisfied with the returns from the organic portion of their business) given knowledge of the independent variables Xis
F(Zi) =
represents the value of the standard logistic density function associated with each possible value of the underlying index Zi.
Zi
the underlying index number or α + βXI
=
And βXi is a linear combination of independent variables so that: Zi = log [Pi /(1- Pi)] = βi0 + βi1Xi1 +βi2Xi2 + . . . +βinXin + εi
14
Where: i
=
1,2,. . . ,n are observations
Zi
=
the unobserved index level or the log odds of choice for the ith observation
Xin
=
the nth explanatory variable for the ith observation
β
=
the parameters to be estimated
ε
=
the error or disturbance term
The dependent variable Zi in the above equation is the logarithm of the probability that a particular choice will be made. The parameter estimates do not directly represent the effect of the independent variables. To obtain the estimators for continuous explanatory variables in the logit model, the changes in probability, Pi that Yi = 1 brought about by a change in the independent variable, Xij is given by: (∂Pi / ∂Xij) = [βj exp (-βXij)] / [1+ exp (-βXij)] 2 For qualitative discrete variables, such as the explanatory variables used in this study, ∂Pi/∂Xij does not exist. Probability changes are then determined by: (∆Pi /∆Xij) = Pi(Yi :Xij = 1) - Pi(Yi :Xij = 0) The change in probability for each explanatory variable was measured at the mean of all other independent variables. The actual specifications for each of the three models as well as a description of the explanatory variables, the maximum likelihood estimates, and the prediction success of each model are provided in tables through the text.
15
Table 4: Explanatory Variables for Logistic Models Variable (Variable names appear capitalized)
Frequency
Mean (Percent)
Std Dev.
170
76.5916
131.8398
ORGANIC_ACRES
Number of Organic acres farmed
MATURE INITIAL* GROWTH* DECLINE*
Stage of Business
17 47 97 6
0.0944 0.2611 0.5389 0.0333
0.2932 0.4404 0.4999 0.1800
USE_LOGOS
Used certified organic logos Did not use certified organic logos*
94 86
0.5222 0.4778
0.5009 0.5009
RENT
Rented land for agricultural use Did not rent land*
63 117
0.3500 0.6500
0.4783 0.4783
CATTLE
Produced organic cattle Did not produce organic cattle*
22 158
0.1222 0.8778
0.3284 0.3284
STATE_LOGO
Used state promotional logos Did not use state promotional logos*
31 149
0.1722 0.8278
0.3786 0.3786
MILK
Produced organic milk Did not produce organic milk*
28 152
0.1556 0.8444
0.3634 0.3634
HERB
Produced organic herbs Did not produce organic herbs*
64 116
0.3556 0.6444
0.4800 0.4800
IPM
Also used IPM practices Did not use IPM practices*
33 147
0.1833 0.8167
0.3880 0.3880
AG_TOUR
Provided forms of agritourism Did not provide agritourism*
41 139
0.2278 0.7722
0.4206 0.4206
RETAIL
Retailed directly to consumers Did not retail to consumers*
44 136
0.2444 0.7556
0.4309 0.4309
VEGTABLE
Produced vegetables organically 109 Did not produce vegetable organically* 71
0.6056 0.3944
0.4901 0.4901
ORGANIC_YEARS
Number of years as organic producer 166
7.3614
6.5876
HI_ORGANIC
Greater than 70 percent of gross income from organic production Less than 70 percent of income derived from organic production*
88
0.4889
0.5012
92
0.5111
0.5012
16
Table 4: Explanatory Variables for Logistic Models (con’t) Variable (Variable names appear capitalized)
PROMOTE_EXP
Frequency
Average annual promotional expense in dollars
143
Mean (Percent)
558.57
Std Dev.
2177.72
INCREASE
Increase in annual sales (over 5 yrs) 89 Decrease in annual sales (over 5 yrs)* 49
0.6166 0.3834
0.4876 0.4876
FAMILY
Employed family members Did not employ family members*
106 74
0.5888 0.4112
0.4934 0.4934
PYO
Provided Pick-Your-Own Did not provide Pick-Your-Own*
16 160
0.0909 0.9091
0.2883 0.2882
DIRECT_MAIL
Marketed through direct mail Did not market through direct mail*
31 145
0.1761
0.3820 0.3820
HI_SALES
Had gross sales over $200,000 Had gross sales under $200,000*
14 166
0.0777 0.9223
0.2685 0.2685
R_STAND
Marketed through roadside stands Did not market at roadside stands*
44 132
0.2500 0.7500
0.4342 0.4342
* Refers to the category that was omitted in the logit analysis
17
Model One: Producers Intending to Expand the Organic Portion of their Business Over the Next Five Years FUTURE_EXPAND = β0 + β1 ORGANIC_ACRES + β2 MATURE + β3 USE_LOGOS + β4 RENT + β5 CATTLE + β6 STATE_LOGO + β7 MILK + β8 HERB + β9 IPM + β10 AG_TOUR + β11 RETAIL + β12 VEGETABLE + β13 ORGANIC_YEARS + β14 HI_ORGANIC + β15 PROMOTE_EXP + β16 INCREASE
Model Two: Organic Producers with Increasing Gross Sales INCREASE
= β0 + β1 ORGANIC_ACRES + β2 MATURE + β3 USE_LOGOS + β4 RENT + β5 CATTLE + β6 STATE_LOGO + β7 MILK + β8 HERB + β9 IPM + β10 AG_TOUR + β11 RETAIL + β12 VEGETABLE + β13 ORGANIC_YEARS + β14 HI_ORGANIC + β15 PROMOTE_EXP
Model Three: Producers Satisfied with their Returns from Organic Production SATISFIED
= β0 + β1 ORGANIC_ACRES + β2 MATURE + β3 USE_LOGOS + β4 RENT + β5 CATTLE + β6 STATE_LOGO + β7 MILK + β8 HERB + β9 IPM + β10 AG_TOUR + β11 RETAIL + β12 DIRECT_MAIL + β13 INCREASE + β14 FAMILY + β15 PYO + β16 HI_SALES + β17 R_STAND
Where: ORGANIC_ARCRES = The number of acres currently being farmed organically. MATURE
= 1 if the grower was currently in the “mature” stage of business development, and 0 if the grower was in the “initial,” “growth,” or “decline” stages of business development.
USE_LOGOS
= 1 if the grower was currently using labeling to identify produce as certified organic and 0 otherwise.
18
RENT
= 1 if the grower was renting at least part of the land on which he/she farmed and 0 otherwise.
CATTLE
= 1 if the grower was producing cattle organically and 0 otherwise.
STATE_LOGO
= 1 if the grower participated in state-sponsored agricultural marketing programs such as Jersey Fresh and Pride of New York, 0 otherwise.
MILK
= 1 if the grower was currently producing organic milk and 0 otherwise.
HERB
= 1 if the grower produced herbs or nutraceuticals organically and 0 otherwise.
IPM
= 1 if the grower also had some acreage under integrated pest management and 0 otherwise.
AG_TOUR
= 1 if the grower provided forms of agritourism such as hayrides and 0 otherwise.
RETAIL
= 1 if the grower had any income from direct retail sales and 0 otherwise.
VEGETABLE
= 1 if the grower produced any vegetable crop (as opposed to producing fruits, milk, herbs or cattle exclusively) and 0 otherwise.
ORGANIC_YEARS
= The number of years the grower had farmed organically.
HI_ORGANIC
= 1 if at least 70 percent of the growers gross income was derived from organic production and 0 otherwise.
PROMOTE_EXP
= The average annual advertising expenditure in dollars.
INCREASE
= 1 if the annual trend of gross sales for the previous five years was increasing, 0 if gross sales were decreasing, unchanged, or if no clear trend existed.
RETAIL
= 1 if the producers retailed directly to consumers and 0 otherwise.
DIRECT_MAIL
= 1 if the grower retailed fresh produce through direct mail to consumers and 0 otherwise.
FAMILY
= 1 if the grower employed family members and 0 otherwise.
PYO
= 1 if the grower retailed fresh produce through pick-you-own and 0 otherwise.
HI_SALES
= 1 if the grower had gross sales under $200,000 and 0 otherwise.
R_STAND
= 1 if the grower retailed fresh produce through roadside stands and 0 otherwise.
19
Logit Analysis Of Producer Data The three logit models were tested according to the specifications given above. A listing of the explanatory variables used in the regression models is given in Table 4. In order to increase the regression fit, explanatory variables were dropped or added based on how they impacted the overall performance of the models and on the effect they exerted upon other explanatory variables. When selecting the final models, several measures of the goodness of fit were taken into account. The Chi-square statistic, which tests the null hypothesis that the coefficients of all the independent variables as a set are equal to zero, was one of the most important. In this study, the null hypothesis was rejected at a significance level of 0.0001 in each case. In addition, the number of significant explanatory variables in each model was also a factor considered during the selection process. The levels of statistical significance chosen for this analysis were fixed at the 1, 5 and 10 percent. However, some independent variables that turned out to be statistically insignificant were still included in the models if they helped increase the regression fit.
The McFadden’s R2 statistic is also reported for each model.
However, little weight was given to this measure when choosing the final models. Binary dependent variable models estimated with cross sectional data, like the ones constructed in this study, are not expected to yield high R2 values (Pindyck and Rubinfeld, 1991). For example, Hensher and Johnson consider McFadden’s R2 values that range between 0.20 and 0.40 would indicate an extremely good fit (Bell, et al., 1994). The three models estimated produced R2 statistics in the 0.08 and 0.67 range. Because another potential use of logit models is to predict whether or not an event will occur given a set of explanatory variables, the percent of successful predictions within the given samples is also provided for each model as a measure of goodness of fit (Judge, et al., 1982).
Based on a 50-50 classification scheme, individuals in the
samples are classified as either opting for a choice or not (e.g. intending to expand organic production in the next five years or not) or having an attribute or lacking it (e.g. satisfied with returns from organic production or not (Nayga, 1993).
Two models
correctly predicted at least 71 percent of the responses, while one model accurately classified 65 percent of the individuals. The models were also tested for the presence of multicolinearity, although no evidence was found.
20
Model One: Producers Intending to Expand their Organic Business Model one predicts the likelihood that a grower is intending to expand the organic portion of his business within the next five years. This model is of particular interest because it examines future trends in organic supply. Of 138 observations that were used in this model, 92 (67 percent) intended to expand their organic production, while 46 (33 percent) did not. Of those who were not currently planning an expansion, 44 intended to maintain the current level of production while only 2 intended to decrease production. Many of those who did not plan to expand production were already farming the entire amount of land which they had available to them organically. Therefore, limitations in the availability of land could account for some of those who did not intend to expand their production. Model one correctly predicted the state of the dependent variable in 72 percent of the observations. The chi-square statistic rejected the null hypothesis that the explanatory variables as a set were insignificant in explaining variation in the dependent variable at the 0.0001 level and the McFadden’s R2 was calculated at 0.33. The results for Model One appear in Tables 5 and 6.
The number of acres farmed under organic practices negatively contributed to the likelihood of a growers’ intent to expand organic production. For every 30 additional acres that a producer farmed organically, he was approximately 3 percent less likely to plan an expansion of his output within the next five years. This finding may suggest that larger, more established growers are presently more content with their returns from organic farming (see model three). It might also indicate that larger organic farmers have already converted the optimal amount of land available to them to organic farming or that because of their larger size they cannot efficiently manage greater organic acreage. Similarly, those who have farmed organically longer were less likely to be expecting an increase in the size of their organic operations. For every one year spent as an organic grower, producers were again 3 percent less likely to be planing for expansion.
As with having larger organic acreage, those who have been organic
farmers longer may be using the land available to them for organic practices closer to its optimal potential than those just beginning to undertake alternative farming.
21
Table 5: Producers Intending to Expand the Organic Portion of their Business Over the Next Five Years (Model One) Variable
Estimate
Intercept Organic_Acres * Mature Use_Logos Rent *** Cattle *** State_Logo Milk *** Herb ** IPM ** Ag_Tour *** Retail Vegetable Organic_Years *** Hi_Organic Promote_Exp * Increase ***
-0.0911 -0.0045 -1.0923 -0.4578 1.6561 2.5524 -0.2525 -3.3105 1.3431 1.5759 2.3371 0.6874 -0.6674 -0.1353 0.5090 -0.0002 1.8939
Standard Error 0.6343 0.0026 0.7797 0.5521 0.6375 1.0664 0.7199 1.0429 0.6220 0.7322 0.7818 0.5944 0.5993 0.0501 0.5945 0.0001 0.5889
Change in Probability
-0.0284
0.2958 0.3114 -0.6748 0.2472 0.2478 0.3424
-0.0283 -0.0127 0.2603
Significance of Chi-square Statistic: 0.0001 McFadden’s R2: 0.33 Ratio of nonzero observations to the total number of observations: 0.67 *: significant at the .10 level **: significant at the .05 level ***: significant at the .01 level
Table 6: Prediction Success For Model One Predicted 0
1
0
24
22
1
17
75
Actual Number of correct predictions: 99 Percent of correct predictions: 71.7
22
Those whose gross sales had shown significant annual increases over the past five years were more likely to be intending to increase their organic production. It’s possible that a high percentage of this was comprised of those who were in the initial and growth stages of their organic business (those already in the mature stage of business were less likely to intend to expand their organic production – although this variable was not statistically significant). The effect of an increase in sales is consistent with that of additional organic acres and additional years as an organic farmer. In this instance, those with increasing returns would likely be in the growth stages of business, have fewer organic acres and fewer years as an organic farmer. Therefore, it is reasonable that an increase in recent gross returns had the opposite effect of total organic acres and years as an organic farmer. Similarly, those who currently rented land were 30 percent more likely to intend increasing their organic acreage. This group of producers may again be comprised of younger, growing businesses that need to rent the resources initially required to begin production. Part of the expansion planned by this group may be the acquisition of land on which to farm organically and a reduced reliance on rented land.
Those producers who provide forms of agritourism such as hayrides and pick-your-own operations were significantly more likely to be planning for expansion. Agritourism has proven to be an innovative and often effective way to generate additional income – especially in the Northeastern states where development and urbanization are common. Those who provide agritourism were 34 percent more likely to be planning to expand the organic portion of their business and also more likely to be satisfied with the returns they were able to generate from organic farming (model three). This finding suggests that organic farming and agritourism are highly complimentary of one another and organic growers may find a significant source of income from providing additional services to attract consumers to their farms.
Those who, in addition to organic farming, also employ integrated pest management practices (IPM) on some portion of their farm were 34 percent more likely to be planning to expand their organic output. This might mean one of two things, depending upon the
23
individual circumstances of the grower. It may suggest that those who currently farm with IPM practices intend on converting a portion of their IPM fields to certified organic. Conversely, it may suggest that growers who plan to extend their organic acreage intend to keep some land under IPM practices in the case of an unfavorable season when the ability to make use of pesticides might provide financial insurance.
The
survey instrument did not distinguish if the additional organic acreage would be at the expense of land that was currently being farmed under IPM. Among specific commodity groups that affected a producer’s likelihood of expansion, herb and cattle producers were found to be more likely to expand while milk producers were less likely. Specifically for herb producers, the increased demand for medicinal and nutraceutical herbs produced without the use of synthetic pesticides seems to be rising which may account for herb producers 25 percent greater likelihood of planning expansion. One possible reason that milk producers might be less likely to plan an expansion of their output is in the high cost capital needed to increase production such as milking equipment and milk storage facilities. This may also explain in part why milk producers were 67 percent less likely to intend a future increase in production while cattle producers were 31 percent more likely to plan an increase in output. Although the impact was slight, those who were currently spending more to promote their business were less likely to be intending to expand their organic output. For every additional $300 spent annually on promotional and advertising expenses, producers were 1 percent less likely to expand their business. This may indicate that proprietors of younger, fledgling organic endeavors which require extensive advertising to generate a consumer base would wait to judge the success of their business before planning an expansion of current organic acreage, or that these producers are advertising just to keep their current sales level and cannot expand production at this point.
Model Two: Organic Producers With Increasing Gross Sales Model two predicted the likelihood that the trend of a grower’s annual gross sales has been increasing over the past five years. Of a total of 138 producers that were used in the model, 89 (64 percent) had significant annual increases in their gross sales while 49 24
Table 7: Organic Producers With Increasing Gross Sales (Model Two) Variable
Estimate
Intercept * Organic_Acres Mature *** Use_Logos ** Rent Cattle State_Logo Milk Herb *** IPM Ag_Tour Retail Vegetable * Organic_Years Hi_Organic *** Promote_Exp
-0.9427 0.0011 -2.2074 1.1111 0.4927 -0.0269 0.5741 -0.4250 -1.5775 0.0943 -0.8337 0.0008 0.8800 0.0237 1.8350 0.0003
Standard Error 0.5888 0.0030 0.7872 0.4865 0.4793 0.8001 0.6404 0.8487 0.5697 0.5716 0.6195 0.4995 0.5419 0.0448 0.5128 0.0003
Change in Probability
-0.5010 0.2363
-0.3498
0.1926 0.3747
Significance of Chi-square Statistic: 0.0001 McFadden’s R2: 0.22 Ratio of nonzero observations to the total number of observations: 0.64 *: significant at the .10 level **: significant at the .05 level ***: significant at the .01 level
Table 8: Prediction Success For Model Two Predicted 0
1
0
23
26
1
15
74
Actual Number of correct predictions: 100 Percent of correct predictions: 70.3
25
(36 percent) did not. Model two correctly predicted the state of the dependent variable in 70 percent of the observations. The chi-square statistic rejected the null hypothesis that the explanatory variables as a set were insignificant in explaining variation in the dependent variable at the 0.0001 level and the McFaddens R2 was calculated at 0.22. The results for Model Two appear in Tables 7 and 8.
A significant finding shows that growers whose farm is primarily organic (i.e. at least 70 percent of the land is farmed organically) were 37 percent more likely to have increasing gross profits than those who had a larger share of conventional or IPM farming. This may result from a number of possible reasons. Firstly, it may indicate that for those who farm both conventionally and organically, returns from the organic portion of their business increase at a faster rate than returns from the conventional portion. Secondly, it may indicate that growers who have a higher percentage of organic land may be able to more effectively manage and farm organically than a more diversified operation. This would be an intuitive outcome from specialization in organic farming.
Furthermore,
smaller farmers who are nearly all organic and who are in the initial or growth stages of development may finding increasing returns much easier to achieve than larger farms that have exhausted the land resources available to them.
In contrast to model one, herb producers were found to be less likely to have enjoyed increasing gross sales over the previous five years. However, this may again be a result of trends in the emerging market for nutraceutical products. Although there has been significant interest and demand for nutraceutical herbs, production has been challenging for growers. Because only a handful of producers are currently growing nutraceutical crops, finding a quality source of pure seeds is often the hardest part. Furthermore, most growers lack sufficient knowledge of the nutraceutical crops they are planting, with many of the best sources of information being outside the United States. In many cases growers have produced crops for an entire season only to find out that the seeds they had purchased were contaminated with other herb varieties as well. In these instances, the returns on their crop would be minimal at best.
26
Those who grew vegetables organically (as opposed to those who exclusively grew some combination of non-vegetables such as hay, fruit, herbs, cattle or milk) were 19 percent more likely to have had increased gross sales. The probable reason for this finding is that organic vegetables are still easier to obtain through a local supermarket than organic herbs or organic milk, which are primarily sold through health food distributors and can infrequently be found at local supermarkets. It may also be an indication that growers who are interested in adopting organic practices may find greater opportunities in selling organic vegetables than herbs, milk or cattle. While not statistically significant, the variables for milk and cattle were estimated with negative coefficients in this model. Those who used logos to identify their produce as certified organic were 24 percent more likely to have increases in gross sales over the past five years. It is difficult to determine if the use of logos was the primary reason for the increase in sales. However, of the 94 producers who used certified organic logos, 58 percent indicated that logo use had increased their sales. Only one respondent in the sample felt that logo usage had a negative impact on organic produce sales.
Growers who classified themselves as being in the “mature” stage of their business development were 50 percent less likely to have had annual increases in gross sales over the previous five years. The base group of individuals contained those in the initial and growth stages of development, which were significantly more likely than mature stage organic farms to have increasing gross sales. Many farms which were classified as “mature” may be currently producing at their optimal capacity given the land resources available to them; thus, not able to increase production as a way to increase gross sales. (The base group of individuals also contained farms in the decline stage of business development, however their number was very small).
Model Three: Producers Satisfaction with Organic Farming Returns Model Three examines producers’ satisfaction with returns from organic farming as a function of characteristics of their farm. Of the 166 observations used in this model, 72 (43 percent) indicated they were satisfied with returns from organic farming while 94 (57 percent) were less than satisfied.
Model Three correctly predicted the state of the
27
Table 9: Producers Satisfied with their Returns from Organic Production (Model Three) Variable
Estimate
Intercept ** Organic_Acres Mature *** Use_Logos * Rent Cattle ** State_Logo *** Milk Herb IPM * Ag_Tour * Retail Direct_Mail * Increase *** Family PYO Hi_Sales * R_Stand
-1.0949 -0.0023 3.2637 0.7236 -0.6240 1.3009 -1.4059 0.5498 -0.6926 0.8394 1.0121 0.3544 -1.0282 1.1467 -0.5630 0.8008 1.4659 -0.3585
Standard Error 0.4869 0.0018 0.8520 0.4314 0.4427 0.6394 0.5977 0.6148 0.4512 0.5013 0.5625 0.4742 0.5658 0.4419 0.4101 0.7813 0.8612 0.4952
Change in Probability
0.5804 0.1749 0.3114 -0.2985
0.2068 0.2477 -0.2299 0.2677
0.3428
Significance of Chi-square Statistic: 0.0001 McFadden’s R2: 0.21 Ratio of nonzero observations to the total number of observations: 0. *: significant at the .10 level **: significant at the .05 level ***: significant at the .01 level
Table 10: Prediction Success For Model Three Predicted 0
1
0
71
36
1
23
36
Actual Number of correct predictions: 107 Percent of correct predictions: 64.5
28
dependent variable in 65 percent of the observations. The chi-square statistic rejected the null hypothesis that the explanatory variables as a set were insignificant in explaining variation in the dependent variable at the 0.0001 level and the McFaddens R2 was calculated at 0.21. The results for Model Three appear in Tables 9 and 10.
While growers who classified themselves as mature were less likely to have significant increases in gross sales over the previous five years (model two), they were the group which was most likely to be satisfied with the returns earned from organic farming. Together, these findings suggest that farms in the mature stage of business development have higher total sales than farms in the initial and growth phases of development. Furthermore, because of the higher level of sales and because they are more likely to already be using the available resources optimally, it is more difficult to generate increased sales through increases in production. For mature organic farms, increased sales might be generated through agritourism (model three), by converting a higher number of acres from conventional to organic practices (model two) or by using logos to identify produce as certified organic (model two).
Consistent with model two, those who reported using logos to identify their produce as certified organic were 17 percent more likely to be satisfied with their returns from organic farming. As stated previously, the majority of organic logo users also believed that logo usage increased their gross sales. However, those who were involved in state marketing programs (which usually involves a state promotional logo) were found to be less likely to be satisfied with the returns from the organic portion of their business. There may be several reasons that contribute to this finding.
For instance, the
overwhelming majority of produce promoted by state marketing programs is nonorganic. Therefore to promote organic produce and conventional produce side by side on the basis of being locally grown, the organic produce is likely priced higher than the conventionally grown produce and may seem less attractive to the consumer. Promoting organic produce as locally grown would probably only provide satisfactory results when differentiating between local and non-local organic produce.
29
Those who, in addition to organic practices, also used IPM control techniques on other fields in their farm were 21 percent more likely to be satisfied with their returns from organic farming.
Those who offered consumers some form of agritourism were 25
percent more likely to be satisfied with their organic profits. Both findings are consistent with model one, which also showed a positive impact of IPM and agritourism. Both IPM and agritourism are essentially forms of diversification and insurance for organic farmers, which help to bolster profits in years when pest damage may be extraordinarily high.
A number of distribution channels were tested for an impact on producers’ level of satisfaction with organic profits. Only the direct mail channel proved to be statistically significant. Producers who sold organic produce directly to consumers through the mail were found to be 23 percent less likely to be satisfied with returns from organic production. Direct mail would probably be best suited for the distribution of organic seed or dried organic herbs.
As anticipated, those who had recent increases in gross sales and those with higher levels of gross sales were both more likely to be satisfied with their returns from organic farming.
Summary of Explanatory Variables The results from all three models can be summed up by Table 11 on the next page. A negative sign indicates that the variable was estimated to have a negative coefficient, and hence has a negative impact on the dependent variable. A positive sign indicates that the variable was estimated to have a positive coefficient, and hence has a positive impact on the dependent variable. The star symbol represents the significance level of the variable, which is interpreted at the bottom of the Table 11. Additionally, the most relevant independent variables are explained in detail in the conclusions section.
30
Table 11: Model Comparison: Model One
Model Two
Model Three
ORGANIC_ACRES
-*
+
-
MATURE
-
-***
+***
USE_LOGOS
-
+**
+*
RENT
+***
+
-
CATTLE
+***
-
+**
STATE_LOGO
-
+
-***
MILK
-***
-
+
HERB
+**
-***
-
IPM
+**
+
+*
AG_TOUR
+***
-
+*
RETAIL
+
+
+
VEGETABLE
-
+*
ORGANIC_YEARS
-***
+
HI_ORGANIC
+
+***
PROMOTE_EXP
-*
+
INCREASE
+***
+***
DIRECT_MAIL
-*
FAMILY
-
PYO
+
HI_SALES
+*
R_STAND
-
*: significant at the .10 level **: significant at the .05 level ***: significant at the .01 level
31
Summary and Conclusions About two-thirds of the sample plans to increase their organic production in the upcoming years. These organic producers are most likely to: •
currently rent some of their land,
•
produce cattle,
•
grow herbs,
•
use IPM,
•
provide forms of agritourism,
•
be a younger organic operation,
•
have had an increase in sales in the last five years.
About two-thirds of the sample has had an increase in their organic sales over the last five years. These organic producers are most likely to: •
have at least 70% of their total farming land in organic farming,
•
grow vegetables,
•
use labels to identify their products as certified organic,
•
be a younger organic operation.
About two-fifths of the sample states that they are satisfied with their returns from organic production.
These organic producers are most likely to:
•
have had an increase in sales in the last five years,
•
use labels to identify their products as certified organic,
•
produce cattle,
•
be an older organic operation.
The use of labels to identify products as certified organic has a positive effect on increasing sales from organic production, and hence also has a positive effect on the amount of being satisfied with returns from organic production. Without the labels used to identify products as certified organic, consumers will not know which products are
32
certified organic and which products are not. Label awareness will also be studied in the consumer part of the project, Phase II. The use of labels, according to this study, is a positive aspect of marketing organic produce.
Agritourism and renting land are two forms of increasing revenue to either begin or expand an organic farming operation. A large part of the sample that plans to increase their organic farming operation currently provides some form of agritourism, such as Pick-Your-Own stands, where customers can hand pick the products they want, or hayrides, where customers are given a ride in a horse-drawn wagon around the farm. Renting part of the land also has a positive effect of gaining enough revenue to expand an organic operation.
Younger operations should utilize agritourism and renting to
begin or expand an organic operation.
Cattle and vegetable producers, more than herb or fruit producers, were more likely to have a successful organic farming operation. This may be due to the fact that meats and vegetables are of higher average value when compared to herbs and fruits. In the northeastern United States, land value is extremely high when compared to any other part of the country. Organic producers in the northeast must produce higher intensity crops to remain in business.
The use of IPM and having a large (>70%) portion of total farming acres in organic production also makes farmers more likely to increase their organic production. Those who have already converted most of their land to organic farming (rather than conventional farming) are more likely to have had an increase in sales over the last five years and also plan to expand their organic farming operation. The use of IPM as a security measure to rid farms of pests has a positive effect on organic production as it provides an ‘insurance’ to organic growers.
Due to the high sensitivity of organic
farming, bad farming years can destroy an organic crop. Farmers who use IPM can use these practices on their crops to ensure at least some profit when organic production is hard or near impossible. Hence, IPM allows farmers to expand their operation without the fear of losing their entire crop.
33
As anticipated, the average farm size of the sample was extremely small when compared to the mean farm size of each of the participating states. Moreover, less than 18 percent of the respondents indicate that they are not satisfied with the profit margin they are able to generate from their organic production.
Tomatoes were grown
organically by more growers than any other crop was organically grown. However, producers reported the highest satisfaction with their returns from the three commodities grown by the fewest number of growers (apples, cattle and milk).
The findings of the cross-tabulations and regression analyses are consistent with organic marketing theory from past studies.
Interestingly, organic farmers in the
northeastern United States have a number of different issues to contend with. Due to the higher land values and higher population density, organic farmers in the northeast can more readily rent portions of their land and provide forms of agritourism to raise revenues. They also must grow higher intensity crops to pay for the higher value of land in use. Finally, the use of labels to identify products as certified organic is a necessity in an organic farming operation. The high value of northeastern land coupled with the high intensity of organic production should make organic production an increasingly larger part of the total farming operation in the northeast in the years to come. This is also displayed by the two-thirds of the sample that plan to extend their organic farming operation in the next five years.
34
Phase II – The Consumer Side A survey to collect the attitudes and opinions of consumers has also been developed. The questionnaire includes items related to the participant’s grocery purchasing practices, attitudes related to organic produce and organic agriculture, attitudes related to food borne risks, and socio-demographic questions.
The rough draft of this
questionnaire has been circulated to all coalition members. Once coalition members have commented on the structure and contents of the survey, it will be pre-tested. Mailing labels are being created for a stratified random sample of New Jersey, and the urbanized eastern Pennsylvania and southern New York. Approximately 600 surveys will be sent to the 21 counties of New Jersey, which will be targeted to accurately represent the population density of each county. An additional 250 questionnaires will each be sent in a similar fashion to Pennsylvania and New York for a total of 1,100 surveys.
35
References Bell, C. D., R.K. Roberts, B.C. English and W.M. Park. 1994. “A Logit Analysis of Participation in Tennessee’s Forest Stewardship Program.” Journal of Agricultural and Applied Economics. 26(2): 463-472. Burgess, R., J. Kovach, C. Petzoldt, A. Shelton, J. Tette. “Results of IPM Marketing Survey.” New York State IPM Program, NYS Department of Agriculture and Markets, NYSAES Geneva, Cornell University, Fingerlakes Research, Ithaca, NY, 1989. Byrne, P.J., C. Gempesaw II, and U.C. Toensmeyer. 1991. “An Evaluation of Consumer Pesticide Residue Concerns and Risk Perceptions.” Southern Journal of Agricultural Economics. 23(2). Byrne, P.J., U.C. Toensmeyer, C.L. German, and H.R. Muller. 1992. “Evaluation of Consumer Attitudes Towards Organic Produce in Delaware and the Delaware Region.” Journal of Food Distribution Research. 2:29-44. Dimitri, C., and N.J. Richman. April 2000. “Organic Food Markets in Transition.” Henry A. Wallace Center for Agricultural and Environmental Policy. Greenbelt, MD. Dunn, J.A. 1996. “International Organic Marketing Report.” Comercio de Costa Rica, November.
BioFair, Camara de
Estes, E., and V.K. Smith. 1996. “Price, Quality, and Pesticide-Related Health Risk Considerations in Fruit and Vegetable Purchases: An Hedonic Analysis of Tuscon, Arizona, Supermarkets.” Journal of Food Distribution Research. 27(3):59-76. Food Marketing Institute, Trends 1989: Consumer Attitudes and the Supermarket, Washington, DC. Govindasamy, R. and R.M. Nayga, "Characteristics of Farmer-To-Consumer Direct Market Customers: An Overview," Journal of Extension. Electronic Journal, August, 1996, 34(4). Govindasamy, R., J. Italia and C. Liptak. 1997. “Quality of Agricultural Produce: Consumer Preferences and Perceptions.” P-02137-1-97, New Jersey Agricultural Experiment Station, Rutgers University, New Brunswick, NJ. Govindasamy, R., R.M. Nayga, and D.M. Thatch. "Farmer-to-consumer DirectMarketing Operations: Issues and Analysis". Rutgers Cooperative Extension Fact Sheet, FS800, 1995.
36
Groff, A., C. Kreider, and U.C. Toensmeyer. 1993. “Analysis of the Delaware Market for Organically Grown Produce.” Journal of Food Distribution Research. 24(1):118-126. Gujarati, D. 1992. Essentials of Econometrics. New York, NY: McGraw Hill. Judge, G., R. Canterhill, W.E. Griffiths, H. Lutkepohl, and T.C. Lee. Introduction to the Theory and Practice of Econometrics. John Wiley and Sons, Inc., 1982. Klonsky, K., K. Norris, and R. Buckles. 1992. “How will Cleanup of Contaminated Farm Properties be Financed? Problems and Solutions.” Agricultural Finance Review. 52(23). Lockeretz, W. 1995. “Organic Farming in Massachusetts.” Journal of Soil and Water Conservation. 50(6). Lockeretz, W. 1997. “Diversity of Personal and Enterprise Characteristics Among Organic Growth in the Northeastern United States.” Biological Agriculture and Horticulture. 14(1). Misra, S., C. Huang, and S. Ott. 1991. “Consumer Willingness to Pay for PesticideFree Fresh Produce.” Western Journal of Agricultural Economics. 16(2). Morgan, J. and B. Barbour. 1991. “Marketing Organic Produce in New Jersey: Obstacles and Opportunities.” Agribusiness. 7(2):143-163. Nayga, R.M. Jr. 1993. “Away from Home Lamb Consumption in the United States: Implications for Australia and New Zealand.” Review of Marketing and Agricultural Economics. 61: 417-432. Pindyck, R., and D. Rubinfeld. 1991. Econometric Models and Economic Forecasts. New York, NY: McGraw-Hill. Sauber, C.M., 1994. 19:4:4.
“The Meaning of the Word Organic.”
Harvard Health Letter.
Senauer, B., 1989. “Food Safety: A Growing Concern.” Staff paper P89-38. Department of Agricultural and Applied Economics, University of Minnesota, October 3, 1989. U.S. Department of Agriculture. 1995. Pesticide and Fertilizer Use and Trends in U.S. Agriculture. AER-717 (Economic Research Service Report, (March). U.S. Department of Commerce, Bureau of the Census. 1992 Census of Agriculture: New Jersey State Data.
37
Weaver, R., D. Evans, and A.E. Luloff. 1992. “Pesticide Use in Tomato Production: Consumer Concerns and Willingness to Pay.” Agribusiness. 8(2). Zellner, J.A., and R.L. Degner. 1989. “Consumer Willingness to Pay for Food Safety.” Paper presented at the Southern Agricultural Economics Meeting, Nashville, TN. Zind, T. 1990. “Fresh Trends 1990: A Profile of Fresh Produce Consumers.” The Packer Focus, 1989-1990. Overland Park, KS: Vance Publishing.
38
f Deesadfgd
Department of Agricultural, Food, and Resource Economics Rutgers Cooperative Extension New Jersey Agricultural Experiment Station New Brunswick, New Jersey 08901
Survey of Organic Produce Farmers 1. What is your opinion about the popularity/opinion of organic produce among consumers?
High Low
Medium Don’t know
2. Do you use any logos to identify your fresh produce as certified organic?
Yes
No
3. If yes, how do you believe they affect your fresh produce sales?
Increase Decrease
No change Don’t know
4. Without regard to the number of years you have been growing organic produce, which of the following terms do you think best characterizes your stage of business development?
Initial Growth
Mature Decline
5. Do you feel as if there are adequate channels/consumer demand to market your organic produce?
Yes
No
6. Do you participate in an Integrated Pest Management (IPM) scouting program?
Yes
No
7. Do you provide forms of agritourism for consumers (such as hay rides, pick-your-own, etc.)?
Yes
No
8. What is the trend in your annual gross sales of organic produce in the last five years:
Increasing No change
Decreasing No clear trend
9. Please indicate all method(s) of advertising you use (Check all that apply)
Newspaper Radio/television Brochures
Direct mail Signs/posters/banners Other (specify) ___________________
Farmers’ Market Any other _______________________
10. Check all places you retail:
Roadside stands Pick Your Own CSA
11. Do you participate in a state-sponsored agricultural marketing program (i.e. Jersey Fresh, Pride of New York, Simply Delicious etc.)?
Yes
39
No
12. Please indicate the number of off site signs used for advertising (approximately)
_________
13. Please list some reasons why you selected organic methods as a production choice. ____________________________________________________________________________
_
_______________________________________________________________________________ 14. Do customers complain about blemishes or insect damage on the produce?
Yes
No
15. How satisfied are you with the profit margin from organic production?
Very Satisfied Somewhat satisfied
Satisfied Not at all satisfied
16. Please indicate the number of employees that fit into each group (production and retailing). Include yourself as appropriate. Family members
Non-family members
a. ____ Full-time (40 hours/week or more)
c. ____ Full-time (40 hours/week or more)
b. ____ Part-time (less than 40 hours/week)
d. ____ Part-time (less than 40 hours/week)
17. List in order of importance (as measured in dollar value of sales) the 6 principal farm products that you grow or produce. (Please be specific such as - strawberries, tomatoes, honey, etc.) a. ______________________________
d.______________________________
b. ______________________________
e.______________________________
c. ______________________________
f.______________________________
18. Do you sell or produce value added products such as baked goods, cider, painted pumpkins, etc.?
Yes
No
19. Do you grow cut flowers?
Yes
No
20. If yes, what percent of your gross dollar sales does this represent?
________________
%
21. Do you grow ethnic produce (Asian vegetable varieties for example)? Yes, organically No
Yes, non-organically
22. Do you grow herbal or nutraceutical crops? Yes, organically No
Yes, non-organically
23. Do you provide flyers or other forms of consumer education on the organic production process?
Yes
No
40
24. Which of the following crops do you produce organically, approximately how much of each is grown and what is the yield per acre:
Carrots
_____________ acres
_____________ yield/acre
Corn
_____________ acres
_____________ yield/acre
Tomatoes
_____________ acres
_____________ yield/acre
Peppers
_____________ acres
_____________ yield/acre
Herbs
_____________ acres
_____________ yield/acre
Broccoli
_____________ acres
_____________ yield/acre
Lettuce
_____________ acres
_____________ yield/acre
Eggplant
_____________ acres
_____________ yield/acre
Apples
_____________ acres
_____________ yield/acre
Cucumbers
_____________ acres
_____________ yield/acre
Beans or Peas
_____________ acres
_____________ yield/acre
Garlic, Leeks, Onions
_____________ acres
_____________ yield/acre
Potatoes
_____________ acres
_____________ yield/acre
Berries
_____________ acres
_____________ yield/acre
Milk
_____________ heads
_____________ yield/head
Cattle
_____________ heads
_____________ yield/head
______________________
_____________ acres
_____________ yield/acre
______________________
_____________ acres
_____________ yield/acre
YOUR ANSWERS TO THE FOLLOWING QUESTIONS WILL HELP US INTERPRET THE RESULTS OF THIS SURVEY AND WILL BE KEPT STRICTLY CONFIDENTIAL 25. Please indicate your gross sales (from all produce – conventional and organic) in 1998.
Under $5,000 $5,000-14,999 $15,000-29,999 $30,000-59,999
$60,000-99,999 $100,000-149,999 $150,000-199,000 $200,000-249,999
$250,000-299,999 $300,000-349,999 $350,000-499,999 $500,00 or more
26. What percentage of your gross income comes from organic produce sales?
__________%
27. What percentage of your revenue comes from retail sales?
__________%
28. What is your average annual advertising and promotional expenditure?
41
$ _________
29. How many acres do you farm organically?
_____________acres
30. How many acres do you farm non-organically?
_____________acres
31. Of the total, how many acres do you
a) Own?:
_____________acres
b) Rent?:
_____________acres
32. How does the organic portion of your farm business compare with five years ago?
An increase of _____ acres. Approximately the same.
A decrease of _____ acres.
33. How do you see the organic portion of your farm business in the next five years?
Expanding Decreasing
Remaining constant
34. For how many years have you grown organic produce?
_____________years
35. Do you have a greenhouse?
Yes
No
36. What type of area is your farm located in?
Urban Rural
Suburban
37. Please list some major obstacles organic growers face or barriers to entry in the organic market. _______________________________________________________________________________ _______________________________________________________________________________ 38. Do you classify yourself as a small farmer according to USDA guidelines?
Yes
No
39. In what range does your age (in years) fall? (Please circle one)
n
o
p
q
r
less than 20
21 - 35
36-50
51-65
over 65
40. Please select the highest level of education you have completed. (Please circle one)
n
o
p
q
r
s
t
Grade School
Some High School
High School Graduate
Some College
College Graduate
Some Graduate School
Masters Degree
u Doctoral Degree
The information provided will be used to prepare a report in which strict confidentiality will be observed. Many thanks for your interest and time in this research project!
42


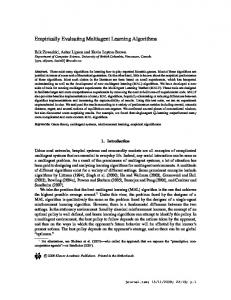


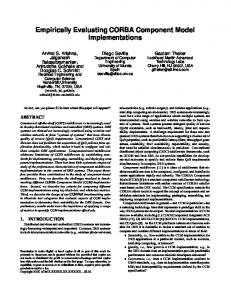


![Empirically evaluating the electoral college. In - Department of ... [PDF]](https://m.moam.info/img/260x300/empirically-evaluating-the-electoral-college-in-de_64e9f726098a9e2f148b45e8.jpg)


