From: AAAI Technical Report WS-02-06. Compilation copyright © 2002, AAAI (www.aaai.org). All rights reserved.
En-Route Sector Metering using a Game-theoretic Approach Goutam Satapathy*,
Vikram Manikonda*, John Robinson #, #Todd Farley
*IntelligentAutomation Inc. 7519StandishPlace, Suite 200 Rockville, Maryland20879
[email protected],
[email protected] Abstract Currently, Traffic Management Coordinators in the Air Route Traffic Control Centers establish flow constraints at various sector meter fixes, based on their best estimates of the predicted traffic demand into their sector. Sector flow rates are not coordinated between neighboring sectors or centers. Incorrect sector meteringrates can lead often lead to a cascade effect resulting in delays in the schedulesof aircraft several sectors away. In this paper we develop an approach for dynamicsector metering based on game theory. The approach is based on a Bayesian game with communication,wherein the sectors determine mutually beneficial metering rates (based on collaboration and exchange of metering rates and negotiated ScheduledTimesof Arrival) chosen so as to optimize delay, controller workloadand capacity. Weformalize the model for a simplified scenario consisting of two sectors belonging to two different centers, attempting to set the flow rates at their boundaries. The simplified modelsfor the two-player (sector) game capture the coupling of dynamics between the two sectors and possible interactions between incoming and outgoing traffic flows. The inboundaircraft from other sectors and outboundflow rate restriction to other sectors are generatedfrom a stochastic time series model. To demonstrate feasibility we implementour approachon a simplified version of agent-based decision support to captures inter center/sector communication and decentralized decision-making
#NASAAmesResearch Center Moffett Field, CA94035-1000 jerobinson@~rc.nasa.gov ffarle¥@~rc.nasa.gov Currently, Traffic ManagementCoordinators (TMCs) the Air Route Traffic Conlrol Centers (ARTCC) establish flow constraints at various sector meter fixes, based on their best estimates of the predicted traffic demand,or sectors affected by adverse weather conditions. Arrival rates into a sector are usually determinedfor sectors close to airports with high demand,and these rates typically flow down(radially outward) to en route sectors. Typically controllers add a safety buffer to this rate to accommodate for any unforeseencircumstances.Sector flow rates are not coordinated betweenneighboring sectors or centers based on the estimated demandon their sectors. Furthermore, metering times at sectors are assigned based on miles-intrail restrictions (distance-based spacing). While this approachworksreasonably well for low traffic densities, for higher densities (coupled with the dynamics and uncertaintyof the traffic) this approachfails. Inappropriate sector meteringrates near a busyairport can often lead to a cascade effect resulting in delays in the schedules of various aircraft several sectors away.In addition, it has beenobservedthat fixed miles-in-trail restrictions basedon quantization to maintain the metering rates can be inefficient. Controller workloadcan be improvedby giving the controller the flexibility to imposevariable in-trail restrictions betweenaircraft, as long as an averagemetering rate over a certain duration is maintained,and safety is not compromised. Time-basedspacing (or "metering")of arrival traffic flows has been shownto be more efficient than distance-based spacing, or "in-trail restrictions," as shownby Sokkappa in a theoretical study (Sokakapa.1989). Sokkappa’sfindings were validated by Swenson, who documentedsignificant improvements in delay and throughput versus in-trail spacing using NASA’s Traffic Management Advisor (TMA)in operational field tests at Dallas-Fort Worth International Airport (DFW)(Swenson, Hoang, et. 1997)
Introduction As air traffic congestion and delay have increased in the post-deregulationera, the air transportation community has sought to identify moreefficient methodsof Traffic Flow Management(TFM) in order to best utilize existing capacity. AdvancedTFMstrategies have the potential to improve system throughput and reduce delay without requiting substantial rework of the National Airspace System (NAS)infrastructure (e.g., airspace redesign, Communication, Navigation and Surveillance (CNS) upgrades, etc.) and without imposingnewaircraft equipage requirements.
Researchers at NASA AmesResearch Center are pursuing a distributed scheduling concept to implementtime-based meteringin constrained, transition airspace (Farley, Foster, Hoangand Lee 2001). Instead of relying on a single, monolithic scheduler to computea workableand efficient schedule for the entire region, as is the ease for current time-based metering systems, a distributed scheduling
Copyright ©2000,American Association for ArtificialIntelligence (www.aaai.org). Allrightsreserved.
66
scheme relies on a loosely integrated network of schedulers, each governing small airspace regions. A scheduler might govern an area as small as a single airspace sector or as large as an enroute Center. The envisioned time-based metering operation will be more sensitive to local ATCconstraints and goals, but will still enable facilities to implementan efficient, time-based metering approachto air traffic management on a regional scale.
acceptance rates and minimumseparation requirements only. Uncertainty in arrival time estimates was included. Lowfidelity models for computation of estimated and scheduled boundary-crossing times (ETAs and STAs, (Scheduled Time of Arrival) respectively), trajectory conflicts, and controller advisories werealso developed.A simplified implementationof the algorithms is adoptedfor this study, capturing inter-sector communicationand decentralized decision-making.
A key challenge in this workis to determinehow---andto what extent--to couple the distributed schedulers in order to generate a set of schedules which are individually workableand collectively beneficial. That is, collectively they producea significant throughputbenefit.
Due to space restriction, we only briefly describe the domain. Readers mayrefer to (Nolan, 1994) for a more detailed description of current NAS operations.
Notation
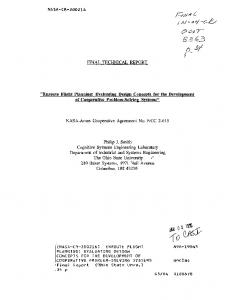
This paper develops a game-theoretic approach for coupling distributed scheduling algorithms. The approach is based on a Bayesian gamewith communication,wherein distributed schedulers negotiate acceptance rates to optimize system-wide delay, controller workload, and throughput. Oneinstance of the scheduler is assumedto be computingtrajectory projections (estimated boundarycrossing times, or ETAs(Estimated Timeof Arrival)) each defined airspace region. The ETAsare exchanged between neighboring agents and are compared against negotiated acceptance rates. Overflow situations are resolved by negotiating changesin acceptancerates or by assigning delay to the offendingaircraft. For the purposes of this initial investigation, a modelwasformalizedbased on a simplified airspace consisting of two neighboring sectors (Figure 1). The sectors set acceptance rates for arrivals across the shared boundaryto their respective sector. This simplified modelfor a two-player (i.e., twosector) game captured the coupling of dynamicsbetween the two sectors, and it captured the possible interactions
SiC": Sectori in center Cu mf : Sector meter fix (inboundor outbound) ctrl: A control point (A control point is an intersection or mergingpoint of two airways or a bifurcation point of an airway). m,: The indices of the inbound meter fixes with respect to the sector mo: The indices of the outbound meter fixes with respect to the sector r=y, r,,,, rmo: The sector meterfix flow rate through meter fix mfor meter fix indexed by m~or mo At: Thetime unit in the specified flow rate (i.e., 10 minutes if the flow rate is specified as 4/10 minutes). sarc,: Sector arrival rate - the rate at whichaircraft enter the sector S/c" . This is equal to the sumof flow rates into the sector S/c’- E r,,, .
J sdrc~ : Sector departure rate - the rate at which
}I ulanIImmmm~mulllllmu¯~
aircra~ depart the sectorsc" . Thisis equal to the sumof flow rates fromthe sector S/C" into other sectors-
E r,,omo E~u
The capacity of a sector - the maximum number of aircraft that can be present in a sector at a given time. It differs from sector to sector depending the sector controller’s ability to manageaircraft to~ The absolute value of time whena stage game starts. (The gametheoretic approachesproposed for the sector metering problem consists of several stage gamesand is played an infinite numberof times.) AT: The duration of the stage game c:
oj
Figure1: A layoutof the airwa~,sin twosectors for the two player game-theoreticmodelfor sector metering betweenincomingand outgoing traffic flows. The inbound aircraft from other (non-playing)sectors and the outbound flow rate restrictions imposedby those other sectors were generated from a stochastic time-series model. The metering times assigned within each sector to complywith the negotiated acceptancerates were not based uponfixed, in-trail spacing restrictions. Rather, they were basedupon assignment of minimumdelay subject to the negotiated
67
s:
The minimum aircraft separation distance based on safety requirements v,,~: The maximum cruise speedof an aircraft. v~n: The minimum cruise speed of an aircraft. The minimum separation time that must be kept based on FAA’s restriction on the minimum separation distance and the assumption of uniform cruise speed maintained by all aircraft (Notethat 6 is not sames/v,=). j, k: The aircraft are indexed in such a waythat the PSTAof a lowindexedaircraft is earlier than the PSTA of a higher indexedaircraft. !: A control point in sector’s airways. The control pointsare indexedas/1, 12, .... li, ... suchthat the STAs of the incoming aircraft must be determined at li beforel~+1. du, :The distance betweentwocontrol points. d,,,m, :Thedistance distancebetween betweenatwo meter dmd meter fixfixes. and a control " :The
aj,m,
point. :Thefh aircraft enteringat meth inboundmeterfix
ETAo~,mf : ExpectedTimeof Arrival of an aircraflj at a meter fix mf, a control point, inboundor outboundmeter fix STAoj,~.m f : ScheduledTimeof Arrival of an aircraftj at a meter fix mf(STA is alwaysequal or greater than ETA) PSTAoj,,,,m,: Predicted STAof the aircraft aj,m, at meth inboundmeter fix such that PSTAoj,~,mr< PSTA%~.,,,m. (Predicted STAsare used only for optimization) PSTAo/~,t,: Predicted STAof the aircraft a/,me at lw control point. (Predicted STAsare used only for optimization) PSTAoj,.,,m,: Predicted STAof the aircraft a/,m, at moth outbound meter fix. (Predicted STAsare used only for optimization) PETA%,,.mo : Predicted ETAof the aircraft a/,me at th mo outbound meter fix, given that PETAoj~.m,= PSTAoj,,,mt " (Predicted ETAs are used only for optimization) B(/, u, at, az): Abeta probabilitydistribution overl_ 1 for all ak, and
Oj°
flow rate
E r,.oiS E rmo(i)and E r,.o is "o~’ "o~111 moe~" E r~o(i ) . The sectors also need to converge at
aj, as long as PSTAoj...,, < PSTAa,..., (This constraint evaluates the numberof aircraft present in the sector’s airspace whenan aircraft enters the sector’s airspace) / COIC,, Thecalculatedflow rate at m o t rmo ) doesnotviolate r,,~.
2moeS~l
equilibrium
Theflow rate a,tc. r~ Is calculated by the followingequation: Vaj.., if(STA%..m ° < (t o + AT)),
5¯
S~l I converges to
equilibrium STA,if STAa~...,mo(i)0STAaj....mo(i-1) for each aircraft a/,. leaving any of the outboundmeterfixes betweento and (to + AT). The sameis true for the sector
r~a/c = max( a,..
PSTAs. The sector
~
c2 S
g(STAa,...,no -, 0))
^(STA,t..~0 >STA,I...u 0) STAaj..,rao
)
For each bucket from the list of remaining buckets, calculate the utility value. Pick the bucket with maximum utility. Note that rerouting is required, if we have following conditions: > and Vmin (STAa;..,t, - STAa;.. ,m, ) din,t, Vmin (STAa;...t ,t~ ) >dt~t,÷~ m- STAa;..
NSTAs andFlowrate fromthe opponent sectot-~aye~
Send~ opt~alST/ks
Rou~ .[ mama. PsrAs
(no,H~yeO ~cto~
In our two sector-player gamesetup, the sector Scl sends the optimal STAa.°. m as. NSTAom"’.too Sl c2 (where mo is o mfx) and I C2sends o ptimal S TAo masNSTAo. ,, to S~la (wheremois mf~)as longas optfma°lSTAsis less’ t~an (to + AT).Thesectors also exchangeoptimalflow rate c°tc calculated using optimal STAo. :,r... The optimal flow ~te calculated using a movingaverage methodis as follows: the numberof aircraft countedto cross the sector boundary meter fix mo between¯ STAo. m and (STAo,,".°. -o At) is - the .*. o flow rate whenthe a|rcraft a.. crosses the meter fix mo. The average of all such flow rate over the number of aircraft crossing betweento and (to + AT)is the optimal flow rate rmoat the meterfix mofor the period betweento and (to + AT). Figure 10 illustrates howoptimization routine is invoked iteratively until both sector convergesto and equilibrium flow rate and STAs.The sector Sl cl converges to a flow rate~ ~ rmo if at the z ~h iteration, it finds moeS~,’
rmo(i)D r~ o(i-1)" Si
milarly, Th
e se ctor
sC2converges to a ~ r,,o if at the t ~h iteration,
it
Figure1 O: Iterative optimization process until calculated flow rate for twoconsecutive iterations are the same The numberof iterations required for convergencecan be assessed from the airspace dynamics(i.e., howfrequently the flow rates change from one stage gameto another and the trajectories of the aircraft) andthe predictability of the PSTAs.Westudy this through simulation described in the next section.
Implementation for GameSimulation To study the robustness, sensitivity, stability (i.e. convergence) and uniqueness of the solution (i.e. equilibrium sector boundaryflow rate), we developedand implementedsoftware for optimization and simulation of the two-playergame.As a part of the simulator we modeled some features of decision support tools and sector controller rules used for issuing holding directives. The simulation and the optimization were adequately coupled/interfaced since the optimization routine requires data (set of aircraft still flying the airspace when optimization gets started prior to AT)from simulation and vice versa. In the following sections we discuss the implementation aspect of the software in somedetail.
2moE~ll
finds E rmo (i) 0 E rm° (i- I). Note that both sector 2 2moC~ moe~ll need to convergeat the sameiteration in order to determine
76
User set parameters Theuser is allowedto set up AT,start time (to), flow rate unit (At), minimumseparation distance (s), minimum aircraft cruise velocity (Vmi,), maximum aircraft cruise velocity (v,~), capacity (C), and weights in the utility
function. The default values of these parametersare: AT= lhr (3600seconds), to = 00:02, At = 20 minutes,s = 5miles, Vm~n= 6miles/min, (v~ = llmiles/min, c = 10. The parameters such as airway segment information are read from files (sectorl_config.txt §or2_config.txt). Each meter fix has its ownconfiguration file that sets up parametersrequired for the time series modelfor flow rate generation, the Gaussianerror parametersassociated with the time series model, the shape parameters of the Beta probability distributions used to determinePSTAsof the incomingaircraft, and the list of trajectories that can be randomlyassigned to the aircraft entering through that meter-fix (this is true only for the inboundmeterfix from the non-playingsectors). Thechoice of these parametersis discussedat lengthin the followingsection. Data collection and generation Tuningparametersfor estimation of the PSTAsbased on hast observations Thefirst set of parametersrequiredfor the estimationof the PSTAsbased on past observation are the values of la, dp, and the meanand variance of the Gaussian error e of the time series model. These parameters can be determined based on ETMSdata. Weused several combinations of IX (0 - 8), d~ (0.0 - 0.25), Gaussianerror mean(0 - 2) Gaussianvariance (0 - 0.44) for our experimentaldesign. In a time series analysis, the meanand variance of the Gaussianerror is calculated basedon the past observations, but in our experimental design we used the constant Ganssian meanand variance. Whenthe value of the ~b, Gaussian mean and variance is 0.0 then the maximum inflow rate at the inboundmeter fix for which the time series is relevantis Ix at the specifiedflowrate unit (At). there is somenon-zero Gaussian variance associated with it, then the maximum inflow rate at the meterfix oscillates th around~t. Thevalue of the ~b indicates howstrongly the n stage flow rate dependson the (n-l) th stage. The modeldescribed in Figure 7 estimates the PSTAsof each aircraft given the flow rate fromthe time series model for the nth stage game. The shape parameters of the probability distributions are set in such a way that the distribution is moreskewedtowardsthe left for the first few aircraft entering the meter fix starting from to and gradually the skew shifts towards the right as the PSTAs calculated from the model as described in Figure 7 approach(to + AT). For example,for the meterfix mf~the shapeparametersare arrangedas: (2, 40), (3, 42), (5, (6, 36), (8, 34), (10, 33), (12, 32) .... As far optimizationis concerned,the PSTAjof the jth aircraft is determinedby replacing bj (refer to the modeldescribedin Figure 7) by the meanof the distribution bj, which is defined by the shape parametersas: (cq/(cq+c~2)). When PSTAjis determined to lie betweento and (to + AT), aircraft object is generated whichis assigned with that PSTAjto be the time at whichit is expected to enter the meterfix. Eachaircraft generatedis assigneda trajectory.
77
The inbound meter fix configuration file lists all the trajectories that canbe assignedto an aircraft if an aircraft originates from that meter fix. For example, the aircraft originating at the meterfix mf~can havetwotrajectories mf~---~trlo---~trla--~mfy---~trlf---~fh andmf~--octrla---~trla--~ mfy--gctrlf---~fg. Thetrajectories are assignedat random. The generated aircraft objects are sent to the neighboring sector, if their PSTAj at the enteringmeterfix will result in their exiting into the neighboringsector betweento and (to AT).Eachsector obtains a list of such aircraft objects that just contains information about the sequence, but does not have information regarding the time at whichthe aircraft would enter the opponent’s sector though the sector boundarymeterfix. Thesectors predict their flow rate and timeof entry (i.e. PSTAjat the sector boundarymeterfix). Tuning parameters for estimation of the PSTAsgiven the set of aircraft Theset of aircraft objects sent by a sector is the sumof two subsets: 1. Thesubset of the generatedaircraft objects for the period betweento and (to + AT)whosePSTAjat the sector boundarymeterfix is betweento and (to + AT). 2. Thesubsetof aircraft objects that are alreadyin the airspace, but whoseETAsat the sector boundarymeter fix is betweento and(to + AT) Estimation and assignmentof PSTAjat the sector boundary meter fix to each of the aircraft objects sent by the neighboring sector is similar to the previous case. The values of ~t, d~, and the meanand variance of the Gaussian error 6 of the time series model reflect the numberof inboundmeterfixes of the neighboringsector feeding into and /tmfsector values of /.t of twoexample, time series a/-Gf, particular boundary meter fix.theFor if ~ are the modelsfor the meterfix mf~and mf~.then the/~ of the time series model for mfy is approximately (/G/o +Pr#c)" Similarly other parametersof the time series modelfor mfy reflect a similar relation with the parametersof the time series model for the meter fix mf~ and mf~. The shape parametersof the probability distributions that determine the PSTAjof each ff aircraft for the optimization are howeverset independently of the shape parameters of the probability distributions that determinesthe PSTAsat mf~ and mf~ Tuning parameters for estimation of the PSTAsbased on exchanged NSTAs The NSTAsare exchanged after the first optimization iteration. The PSTAsare calculated from NSTAsand the optimal flow rate sent by the opponentsector. Hence,there is no need to predict the flow rate or generated PSTAs using a probability distribution. Instead a time series model is used as a correction model to convert an NSTAto a PSTA.Theparametersof this time series model(i.e., Ix, ~bl,
~Pz, dp3... etc. dependingthe order of the model)must be built or trained with data assumingseveral gameshave been played so that we have (STAj-NSTAj)data for each fh aircraft. However,in order to play the games,we need to assume a time series model with its parameters that approximatelyreflects a realistic situation ~. For this experimentaldesign, we assumeda first order time series modelwith la = 20, dpl = 0.5, Ganssianerror mean= 0, and Gaussianvariance = 10000.Note that the variance reflects the reliability of the correction model.A varianceof 10000 indicates that the PSTAscalculated using the correction model might lie between _+300 seconds. For this experimentaldesign we kept the samela and d~ for eachff aircraft. Optimization The optimization routine is invoked with the flight informationof all the aircraft that will be flying throughthe sector’s airspace betweento and (to + AT).For example,the optimization routine of the sector Scl takes into considerationthe followingaircrat~ into its initial bucket: I.
The set of aircraft entering throughmf, betweento and (to + AT)as calculated by the model- "Estimation PSTAsbased on past observations".
2.
Theset of aircraft entering throughmf~betweento and (to + AT)as calculated by the model- "Estimation PSTAsbased on past observations"
3.
Theset of aircraft entering throughmf~betweento and (to + AT)as calculated by the model- "Estimation PSTAsgiven the set of aircraft" (for the fast optimization routine) or by the model- "Estimationof PSTAs given the NSTAs" (for subsequent optimizationiteration).
4.
Theset of aircraft that has enteredthe airspaceprior to to andare still in the airspaceafter to.
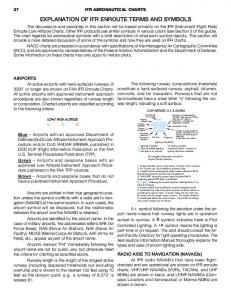
A bucket is branchedoff into two buckets as described in the optimizationroutine. Figure11 illustrates howa bucket is branched off into two buckets. Each new bucket of aircraft is consideredfurther if the newSTAsassigned to the aircraft indicating STAsat the control points can be maintained without exceeding the maximumcruise velocity. The control point STAsassigned to the aircraft mayneed to be increased or adjusted depending on the holding Onewayto estimate the parametersof the time series is to collect the difference betweenSTAs(not ETAs)at the sector boundarywhenan aircraft departs an airport and whenit actually arrives at the sector boundary.This information can be collected from ETMS data and sector controller’slog file.
78
ALiA.~I2A Z0,2740, 32~0, 37401 AR2.1’~d2Z20,. ................. ] ALlY~II g40,21~0,2670,3160] ARI 2,’-~19~0 .................... I ,hl,t 2~:1114~ I ~ 2070, 2r~ AP,2~I’/30 ................... I I 1250,1~401 ARI.I~I420,16~) .......... ] Jl)eL~ycarl b~al~ol-t~tl I 150,16401 .~RLI~ [1/,0~ 1410,1510, lg30 I by reducing vdocit~| ..................|,AIAI~I ...................... I / or
Delayneedsto be incr~sed / dependlng on holding pallern
~
//t,,i r i~’~ ~ with I~[]e di~l-eao4~ 150 ~ But requited time difference 300 based on
This Call becomein feasibh {in fe&’~iblehi Ibis ¢x~e)
rainseparationtime
Figure11: Illustration of howa bucketis branchedinto two buckets and whatvalues are changed(In this case STAsat the control points are changed) pattern to be enforced. Someother rules applied to check the validity of the STAsare illustrated in Figure 12. For example,in mergingairways, the aircraft to be held depend on the location of the other aircraft causingit hold. If thifis is delayedthenthis mustalso be delayed
/ °’°’°°’°’°’;I’O,o...0oO..,.o.o.,.. °
:
#"
.........
"
."
/ If tJds is delayed so that it hasto be held [ close to the control point ~thenti~s must also be delayed
~.......:o.,......,~.... o
X
This mustbe hel
,< 4~
Figure12: Safety criteria applied to adjust the STAs Software and Simulation of the Game Weimplementedthe optimization and simulation modules using OpenCybeleTM agent infrastructure in order to implementthe interface easily (Refer www.openeybele.org for more details on OpenCybele).OpenCybeleallows easy decompositionof problem into agents and activities and allows the programmers to write decision support tools that run concurrently with the simulation threads. In the implementation,the optimization for the two sectors takes place concurrentlyin different executionthreads. The simulator is used to simulate the behaviorof a sector controller issuing advisories to aircraft and introducing randomnessto the time of entry of aircraft from nonplaying sectors. The mainfeatures of the simulator are as follows: 1. The rates at whichaircraft are injected into the sectors during the simulationare different fromthe rates used in the optimization algorithm. This implies that the values of ~t, dp, and Gaussianerror parametersof the time series modelused for simulation are slightly different from the
ones used in optimization. This was done to show the robustness of our algorithm. Weconjecture that a large difference in the aircraft-feed rate will demonstratethe need to develop accurate time series modelor mandate exchange of NSTA similar to the exchange of NSTA by the twosector players in this experimentalsetup. 2. The probability distributions shape parameters used to calculate PSTAsis slightly different in simulation to demonstratethe robustnessof the algorithm. 3.The simulator contains features to issue control advisories such as (1) reduce speed or (2) hold aircraft. Thesimulatordoes not issue tactical advisories such as howto hold an aircraft due to limited time and resource. Since this part of the simulation can be eventually be replacedby other high fidelity TMA tools. Analysis of Simulation Results Weran several simulation scenarios, by changing the maximum inflow rate at meter fixes mf~, mf~, mf,, and mj~ to analyze the sector boundaryflow rates determinedby the game.Thesescenarios are describedas follows: 1. The IX and ~ of the time series modelthat restrains the maximum flow rate of aircraft throughmf~is set to 8 and 0.2 respectively. The meanand variance of the Gassuain error associated with modelis set to 0 and 0.111. The flow rate throughall other inboundmeter fixes is set to zero for both sectors. Because of this setting, one observesat most(8+_2) aircraft entering per 20 minutes into the sector Sc’ and at most(8_+2)aircraft are leaving per 20 minutes into the sector Si G from Sq which happensto be the negotiated sector boundaryflow rate from Sc~ to Sc2. The sector boundary flow rate from Sc2 to Sci is zero. In the next stage gamewhichoccurs after (AT/Simulationspeed) seconds(i.e., 3600/20= seconds), the maximum flow rate into the sector q will
the sector S~. This holding is due to the flow rate restriction set for the outboundflow rate throughmeter fixes mfgand mJ~.The IX and dp of the time series model that sets this flowrate for every stage gameare 3 and 0.2 respectively. 3. In the third scenario, IX and ~b of the time series model that restrains the maximum flow rate of aircraft through mf~and mf~are both set to 4 and 0.2 respectively and the tx and dp of the time series modelthat restrains the maximum flow rate of aircraft through mf~are set to 3 and 0.2. In this scenario, one mayobserve a non-zero negotiated sector boundaryflow rate being set from both sectors. As the gamecontinues, one mayobservethat the negotiated sector boundaryflow rate from the sector from Sq to S~ will keep on rising higher than the negotiated sector boundaryflow rate from the sector from S~ to SIci . One mayalso observe that there will be aircraft holding in sector S~ prior to sector boundary meterfix mf~and on the segmentconnectingmf~and cole in order to maintainthe lowsector boundaryflow rate at mf~. That means,SIc2 will witness someadvisories due to the sector boundaryflow restriction, whichit wouldnot have occured if there were no aircraft injected to the sector Sq and/or east-west airway intersecting west-east airwayat controlpoints ctrl~ andctrlc. 4.In the fourth scenario, aircraft enter through all the inboundmeter fixes. Ix and dp of the time series model that restrains the maximum flow rate of aircraft through mf~and mfc are set to 6 and 0.2 respectively and the IX and d~ of the time series model that restrains the maximum flow rate of aircraft through mf~and mj) is set to 3 and 0.2. Becauseof the high inflow rate of aircraft into the sector Sq in addition to someaircraft from S~ to Sc~, one mayobserve that the flow rate from S~ to Sc~ is muchless than the sumof the inflow rate through
be at most(8 + 0.2x(8+_2)+_2)aircraft per 20 minutes. 2. The IX and d~ of the time series modelthat restrains the maximum flow rate of aircraft throughmf~and mf~are set to 5 and 0.2 respectively. The meanand variance of the Gassuain error associated with both modelsis set to 0 and 0.111. In this scenario, one maysometimesobserve holdingat the mergingcontrol point ctrlb. Asa result, the sector boundaryflow rate from SG to Sc’ will be less
mf~and mJ~Similar to the third scenario, the sector boundary flow rate through meter fix mf~ does not increase with stage gameas the flow rate through meter fix mfy increases. One mayargue that the numberof advisories incurred by the sector S~ due to low flow rate set at meter fix mf~will decrease as a result of increasing the flow rate. However,by increasing flow rate, the sector Sc~ will try to increase its flow rate
than the sumof the inflow rate through meter fixes mfo and mf~. The maximum inflow rate through one of these meter fixes will be (5+_2). In the next stage game,the maximum inflow rate will be (5 + 0.2x(5+_2)+_2) and on. Note that during gameexecution, one mayobserve holding prior to the outboundmeterfixes mfgand mj~in
through mfy. Consequently, the sector S~ will incur additional advisories for holding aircraft prior to the outboundmeter fLx mfgand mJ~because of the low flow rate restriction at the meterfix mfgand m/~comparedto
79
the sector boundaryflow rate at mfr In summary,the sector S~ does not gain by increasing the flow rate at mf~but the sector Sct gains by lowflow rate set at the meterfix mf~. Observethat the metering times (i.e., time at which the aircraft enter or scheduled to enter) are not calculated basedon miles-in-trail restriction in order to maintainthe flow rate. The metering times are calculated based on a movingaverage methodso that the maximum flow rate is the set flowrate. In other words,in any givenflowrate unit (e.g., 20 minutes), the numberof aircraft crossing a meter fix does not exceedthe flowrate set for that meterfix. This is an importantmigrationfromcurrent techniqueof setting metering times that creates an unnecessary number of advisories. The un-equalintervals of the scheduledarrival and departure times of aircraft demonstratethat we do not follow miles-in-trail restriction. However,we observed minimum separation distance betweentwo aircraft. Wealso noticed that the average delay occurredin a particular AT period for both sectors are low while the density remains reasonablyhigh. Animportantand intuitive observation is that computation time for optimization does not depend on the numberof aircraft, but their expectedPSTAat the time of entry that maylead to holding and thus require the need to create morebuckets. Therefore, if the initial bucket contains PSTAsof the aircraft that lead to conflict (minimum separation distance violation) at every control point betweenevery two aircraft then the computationtime may increase exponentially. However,the likelihood of such a scenariois not high in real world. Alsoobservethat the time (i.e., the numberof optimization iterations) it takes for the sectors to convergeto a solution 0aSTAsat the sector boundary&the flow rate) dependson the following- (1) parametersof the correction model, (2) capacity constraints, (3) outboundflow rate constraint, and (4) the numberof control points involving east-west airwaysintersecting west-east airways. In our experimental set up, since we did not consider capacity and outbound flow rate constraints in our optimization,and since the right sector does not haveany control points involving east-west airway intersecting west-east airways, our optimization convergesafter every two iterations. This is because the fight sector accepts any flowrate that the left sector sends. Lastly, we believe that the time for convergencedepends on howmanysectors are negotiating concurrently, and is importantaspect to considerin multi-sector negotiation. Conclusions In this paper we developed a theoretical frameworkfor sector metering based on a Bayesian game with communication, and implemented the optimization and simulationin OpenCybele agent infrastructure. For specific
80
scenarios, we also demonstratedhowthe sector boundary flow rates are negotiated after every ATperiod depending on the rate at whichaircraft are injected and the numberof aircraft present in the airspace from the previous AT period. The sector boundaryrates are not calculated based on miles-in-trail restriction. Based on our preliminary observations, discussions with Subject Matter Expertise (SME) and Aviation Consultants regarding these observations we conclude that our the approach provides an innovative and feasible solution to collaborative sector metering to reduce delays, improve efficiency and controller workload. Future workincludes the extension of the two-sector game and the developmenta DSTfor multi-sector metering using more realistic sector/center geometries, traffic flow interactions and ETMS data to tune the time series and optimization models. Issues related to convergenceof the game,stability and sensitivity of the algorithms, and realtime issues will be addressed. Highfidelity modelsfor the sector utility will be developed. Acknowledgments This research is supported in part by the NASASBIR Phase I contract NAS2-01025.The opinions presented are those of the authors and do not necessarily reflect the views of the sponsors. References Erzberger, H. 1994. Center-TRACON Automation System (CTAS), presented at the Capacity Technology Subcommittee, FAAResearch and DevelopmentAdvisory Committee,Washington,DC, July. Farley, T. C., J. D. Foster, T. Hoang,K. K. Lee. 2001. A Time-Based Approach to Metering Arrival Traffic to Philadelphia, AIAA-2001-5241, First AIAAAircraft Technology, Integration, and Operations Forum, Los Angeles,California, October16-18. Nolan, M. S. 1994. Fundamentalsof Air Traffic Control, Belmont, California, WadsworthPublishing Company. Osborne, M. J. and Rubinstein A. 1994 A Course in game theory, The MITPress: Cmpbridge,MA. Sokakapa, B. G. 1989. The impact of Metering Methodson Airport Throughput, MITREMP-89W000222 Swenson,H. N., Hoang,T., Engelland, S., Vincent, D., Sanders, T., Sanford, B., and Heere, K. 1997. Design and OperationalEvaluationof the Traffic ControlCenter, First USA/EuropeTraffic ManagementR&DSeminar, Sacaly, france, June. G. Satapathy, Distributed and collaborative logistics planning and replanning under uncertainty: a multiagent based approach, PhDThesis, Industrial Engineering, PennsylvaniaState University, University Park, PA, 1999. Wong,G. L. 2000. The DynamicPlanner: The Sequencer, Scheduler, and RunwayAllocator for Air Traffic Control Automation NASA/TM-2000-209586, April.