ORIGINAL ARTICLE
Endoplasmic Reticulum Stress Inhibits STAT3-Dependent Suppression of Hepatic Gluconeogenesis via Dephosphorylation and Deacetylation Kumi Kimura,1 Tomoko Yamada,1,2 Michihiro Matsumoto,3 Yoshiaki Kido,4,5 Tetsuya Hosooka,4 Shun-ichiro Asahara,4 Tomokazu Matsuda,4 Tsuguhito Ota,1 Hiroshi Watanabe,6 Yoshimichi Sai,2 Kenichi Miyamoto,2 Shuichi Kaneko,7 Masato Kasuga,3 and Hiroshi Inoue1
In the liver, signal transducer and activator of transcription 3 (STAT3) plays an important role in the suppression of gluconeogenic enzyme expression. While obesity-associated endoplasmic reticulum (ER) stress has been shown to increase hepatic gluconeogenic enzyme expression, the role of ER stress in STAT3dependent regulation of such expression is unclear. The current study aimed to elucidate the effect of ER stress on the STAT3dependent regulation of hepatic gluconeogenic enzyme expression. Genetically obese/diabetic db/db mice and db/db mouse–derived isolated hepatocytes were used as ER stress models. A tyrosine phosphatase inhibitor, a deacetylation inhibitor, and an acetylated mutant of STAT3 were used to examine the effect of ER stress on hepatic STAT3 action. ER stress inhibited STAT3-dependent suppression of gluconeogenic enzyme gene expression by suppressing hepatic Janus kinase (JAK)2 and STAT3 phosphorylation. A tyrosine phosphatase inhibitor restored ER stress–induced suppression of JAK2 phosphorylation but exhibited no improving effect on suppressed STAT3 phosphorylation. STAT3 acetylation is known to correlate with its phosphorylation. ER stress also decreased STAT3 acetylation. An acetylated mutant of STAT3 was resistant to ER stress–induced inhibition of STAT3-phosphorylation and STAT3-dependent suppression of hepatic gluconeogenic enzyme gene expression in vitro and in vivo. Trichostatin A, a histone deacetylase (HDAC) inhibitor, ameliorated ER stress–induced inhibition of STAT3 acetylation and phosphorylation. The current study revealed that ER stress inhibits STAT3-dependent suppression of hepatic gluconeogenic enzymes via JAK2 dephosphorylation and HDAC-dependent STAT3 deacetylation, playing an important role in the increase of hepatic glucose production in obesity and diabetes. Diabetes 61:61–73, 2012
From the 1Frontier Science Organization, Kanazawa University, Kanazawa, Ishikawa, Japan; the 2Department of Medicinal Informatics, Kanazawa University Graduate School of Medical Science, Kanazawa, Japan; the 3Diabetes Research Center, Research Institute, National Center for Global Health and Medicine, Tokyo, Japan; the 4Department of Internal Medicine, Division of Diabetes, Metabolism, and Endocrinology, Kobe University Graduate School of Medicine, Kobe, Japan; the 5Department of Biophysics, Division of Medical Chemistry, Kobe University Graduate School of Health Sciences, Kobe, Japan; the 6Brand’s Brain Research Centre, Cerebos Pacific Limited, Singapore; and the 7Department of Disease Control and Homeostasis, Kanazawa University Graduate School of Medical Science, Kanazawa, Japan. Corresponding author: Hiroshi Inoue,
[email protected]. Received 8 December 2010 and accepted 6 October 2011. DOI: 10.2337/db10-1684 This article contains Supplementary Data online at http://diabetes .diabetesjournals.org/lookup/suppl/doi:10.2337/db10-1684/-/DC1. Ó 2012 by the American Diabetes Association. Readers may use this article as long as the work is properly cited, the use is educational and not for profit, and the work is not altered. See http://creativecommons.org/licenses/by -nc-nd/3.0/ for details. diabetes.diabetesjournals.org
I
ncreased hepatic glucose production in diabetes has widely been attributed to increased hepatic gluconeogenesis (1), and transcriptional regulation of the expression of gluconeogenic enzymes, such as G6pc and Pck1, coding for glucose-6-phosphatase (G6Pase) and PEPCK, respectively, plays an important role in the control of hepatic gluconeogenesis (2). Cyclic AMP-responsive element– binding protein (CREB) and forkhead box O1 (FoxO1) are transcriptional inducers of gluconeogenic enzyme gene expression (3,4). Glucagon enhances CREB activity in a fasting state, and insulin suppresses transcriptional activities of CREB and FoxO1 by activating phosphoinositide 3-kinase (PI3-K) after eating (5,6). We have identified previously an important role for signal transducer and activator of transcription 3 (STAT3), as a transcriptional suppressor of gluconeogenic enzyme gene expression, in the physiological regulation of hepatic gluconeogenesis (7). We have also demonstrated that activation of hepatic STAT3 is induced in an interleukin (IL)-6–dependent manner by braininsulin action, which is known to indirectly regulate hepatic gluconeogenic gene expression (8,9). Brain-insulin action increases IL-6 expression in the liver, which leads to hepatic STAT3 activation and subsequent suppression of hepatic gluconeogenic enzyme gene expression (8). The activated STAT3 has been shown to act on the promoter region of the G6pc gene, a hepatic gluconeogenic enzyme gene, and suppress its expression (10). STAT3 is activated when it undergoes tyrosine phosphorylation by Janus kinase (JAK) in response to stimulation with IL-6 (11). The tyrosine phosphorylation and activation of STAT3 have also been shown to be regulated by acetylation (12). Although STAT3 exhibits an increased transcriptional activity when it is acetylated by CREB-binding protein/p300, it can be deacetylated by type-1 histone deacetylase (HDAC) and sirtuin 1 (SirT1) (12–14). In an obese/diabetic state, increased CREB activity in the liver and disrupted PI3-K signaling can cause an increase in hepatic glucose production (15,16). In fact, studies using obese/diabetic models, such as leptin receptor–deficient db/db mice, have shown increased expression of hepatic gluconeogenic enzyme genes (15). Recent studies suggest that endoplasmic reticulum (ER) stress in the liver plays an important role in impaired hepatic PI3-K signaling in obesity and diabetes (17). ER stress is a type of stress that occurs in ERs, an intracellular organelle responsible for the folding of secreted proteins and membrane proteins, and is caused by an imbalance between protein folding stress and the processing capacity of ER in mice in an DIABETES, VOL. 61, JANUARY 2012
61
ER STRESS AND GLUCONEOGENIC REGULATION BY STAT3
obese/diabetic state (18). Increased ER stress leads to phosphorylation of inositol-requiring kinase-1a (IRE1a) and PKR (double-stranded RNA-dependent protein kinase)like ER kinase and activation of activating transcription factor-6, thereby inducing expression of CHOP (CCAAT/ enhancer-binding protein homologous protein) and Grp78, an ER chaperone (18). Increased ER stress also leads to activation of c-Jun NH2-terminal kinase, disrupting insulin PI3-K signaling (17). ER stress in the liver is closely related to increased hepatic glucose production in obesity and diabetes (19). Indeed, reducing ER stress by administering chemical chaperones, such as 4-phenyl butyric acid (PBA) and tauroursodeoxycholic acid (TUDCA), in obese mice results in an improvement of impaired hepatic insulin signaling and decrease in hepatic glucose production (19). While it has been demonstrated that ER stress in obesity/ diabetes increases hepatic gluconeogenesis by disrupting insulin signaling and producing the transcriptional induction of gluconeogenic enzyme genes, the effect of ER stress on STAT3-dependent suppression of gluconeogenic enzyme genes remains to be elucidated. The current study, using leptin receptor–deficient db/db mice and db/db mouse– derived primary cultured hepatocytes, revealed that obesityassociated ER stress inhibits STAT3-dependent suppression of hepatic gluconeogenesis by inhibiting phosphorylation and acetylation of hepatic STAT3. RESEARCH DESIGN AND METHODS Animal experiments. Experiments using mice were carried out in accordance with the guidelines for the care and use of laboratory animals at Kanazawa University. Male mice (8–10 weeks old) were housed with free access to water and food under a 12-h light-dark cycle until used in experiments. C57BLKS/J Iar +Leprdb /+Leprdb (db/db) mice as a genetically obese/insulin–resistant model and C57BLKS/J Iar +Leprdb/ m+ (db/+m) mice as a control were obtained from the Institute for Animal Reproduction (Ibaraki, Japan). C57BL/6J Slc mice were obtained from Japan SLC, Inc. and used as wild-type mice. For the intraperitoneal glucose tolerance test (GTT), mice were fasted for 16 h and glucose (1 g/kg body wt) was intraperitoneally administered. Mouse IL-6 (Peprotech, Rocky Hill, NJ) or saline as the control vehicle was administered through an intravenous cannula after 4–6 days of recovery from cannulization at 40 ng/kg/min to nonobese mice and at 30 ng/kg/min to db/db mice, together with somatostatin (Sigma-Aldrich, St. Louis, MO) at 3 mg/kg/min continuously over 3 h after 16 h of fasting. PBA (Enzo Life Sciences, Farmingdale, NY) was mixed in drinking water at a concentration of 4 mg/mL and administered ad libitum for 14 days. Tunicamycin (Sigma-Aldrich) or DMSO (Wako, Osaka, Japan) was diluted 1:100 in physiological saline and intraperitoneally administered at 500 mg/kg body wt, 8 h before IL-6 administration. Hyperinsulinemiceuglycemic clamp studies were performed after 4–6 days of recovering from cannulization as described previously with minor modification (7). During clamp studies, human insulin was infused at 1.25 mU/kg/min into nonobese mice and at 10 mU/kg/min into db/db mice, with variable amounts of 40% glucose solution to maintain a blood glucose level of 90–120 mg/dL. Blood glucose was measured every 10 min. Glucose infusion rate (GIR) and endogenous glucose production (EGP) were measured between 90 and 120 min after the initiation of insulin-infusion. Analysis of blood parameters. Plasma activity of aspartate transaminase and alanine transaminase was measured by the relevant assay kits (Wako). Plasma insulin, glucagon, and IL-6 concentration was determined by mouse insulin ELISA kit (Shibayagi, Gunma, Japan), mouse glucagon EIA kit (Yanaihara Institute, Shizuoka, Japan), and Quantikine Mouse IL-6 ELISA kit (R&D Systems, Minneapolis, MN), respectively. Hepatic glycogen content was measured as described previously (16). Isolated hepatocytes. Mouse hepatocytes were isolated for one experiment from a male mouse (8–12 weeks old) using a modification of a method described previously (20). After culturing in William’s medium E without FCS for 24 h, mouse IL-6 was added to the culture medium at a final concentration of 50 ng/mL, and cells were collected 3 h after IL-6 stimulation or as described in the Fig. 1C legend. Cells were pretreated with the following agents for 6 h before cell harvest: 1 mg/mL tunicamycin, 1 mmol/L palmitic acid (Wako), 1 mmol/L sodium orthovanadate (Wako), 3 mg/mL protein-tyrosine phosphatase 1B (PTP1B) inhibitor (Merck Biosciences, Darmstadt, Germany), 1 mmol/L trichostatin A (TSA; Sigma-Aldrich), and 10 mmol/L Ex527 (Tocris Bioscience, 62
DIABETES, VOL. 61, JANUARY 2012
Ellisville, MO). Pretreatment with PBA at 1 mmol/L or TUDCA at 500 mg/mL was performed for 6 h. To examine both gene and protein expression of gluconeogenesis enzymes, 0.1 mmol/L 8-(4-chlorophenylthio)-adenosine 39:59-cyclic monophosphate sodium salt (Sigma-Aldrich), a cAMP analog, was added to the culture medium at the same time as IL-6 stimulation and incubated for 3 h. HDAC activity was measured with the fluor-de-Lys HDAC assay kit (Biomol, Plymouth Meeting, PA). PTP1B activity was determined using a Millipore assay kit (Billerica, MA). Adenovirus vector–mediated gene transduction. A STAT3-expressing vector carrying FLAG tag, as described previously (21), was used. A STAT3–4R mutant with lysine residues 679, 685, 707, and 709 replaced by arginine residues and a STAT3-K685Q mutant with lysine 685 replaced by glutamine were created by PCR. Adenoviruses were introduced into isolated hepatocytes 12 h after isolation at the multiplicity of infection (plaque-forming unit per cell) described in the figure legends. Mice were infected with an adenovirus encoding b-galactosidase, wild-type STAT3, and K685Q via infusion of a 5 3 108 pfu adenovirus solution into the caudal vein. We set up four experiments to investigate the effect of wild-type STAT3 and K685Q on hepatic glucose metabolism. In experiment 1, to investigate expression and phosphorylation of hepatic STAT3, mice were killed for liver collection after 16 h of fasting or 2 h after glucose administration (4 g/kg body wt). In experiment 2, to investigate metabolic phenotype, blood glucose levels in mice under randomly fed conditions were measured for 6 days after infection. An intraperitoneal GTT (1 g/kg body wt) was performed on day 7, and the liver was collected from mice still in a randomly fed state on day 8. In experiment 3, a hyperinsulinemic clamp analysis was performed 7 days after infection. In experiment 4, to examine the effect of HDAC inhibitors on phenotype, an intraperitoneal GTT (1 g/kg body wt) was performed using an intraperitoneal injection of DMSO, TSA (10 mg/kg body wt), or Ex527 (10 mg/kg body wt), and the liver was collected 3 h after glucose administration, 7 days after infection with adenovirus. Immunoprecipitation and Western blotting. The following antibodies for immunoblotting were obtained: anti–phosphorylated Tyr705-STAT3, anti– acetylated Lys685-STAT3, anti-Akt, anti–phosphorylated Jak2, anti-Jak2, anti–acetylated lysine, anti-IRE1a (Cell Signaling Technology, Danvers, MA), anti–phosphorylated IRE1a (Novus Biologicals, Littleton, CO), anti-CHOP, antiSTAT3, anti-p300, anti-G6Pase, anti-PEPCK (Santa Cruz Biotechnology), anti–bactin (Sigma-Aldrich), anti-SirT1 (Millipore, Bedford, MA), and anti-SOCS3 (Immuno-Biological Laboratories, Takasaki, Japan). Data are representative of at least three independent immunoblot analyses. Western blot images were visualized using enhanced chemiluminescence and quantified by densitometry on a LAS-3000 Imager (Fujifilm, Tokyo, Japan). Quantitative PCR. The relative abundance of mRNA was calculated using 36B4 as the control gene. Primers are listed in Supplementary Table 1. Statistical analysis. Data are expressed as mean 6 SE. Statistical analyses were performed using Student’s t test and ANOVA. Differences were considered significant at P , 0.05.
RESULTS
ER stress inhibits STAT3 phosphorylation. Tunicamycin and palmitate are known to induce ER stress (17,22). Indeed, we found that wild-type mouse–derived isolated hepatocytes exhibited increased phosphorylation of IRE1a and increased expression of CHOP after treatment with tunicamycin or palmitate, indicating increased ER stress (Fig. 1A and B). Increased ER stress was also associated with a decrease in IL-6–dependent phosphorylation of STAT3 (Fig. 1A and B). Tunicamycin treatment also inhibited IL-6–dependent JAK2 phosphorylation (Fig. 1C), and the tunicamycin inhibitory effects on the phosphorylation of STAT3 and JAK2 were pronounced in response to IL-6 stimulation for 3 h, but were less pronounced on 1-h stimulation (Fig. 1C). ER stress inhibits activation of STAT3 and suppression of hepatic gluconeogenic enzyme expression. SOCS3 protein is expressed by IL-6 stimulation in a STAT3dependent manner and inhibits STAT3 activation (23). Lean mouse-derived isolated hepatocytes exhibited decreased SOCS3 expression with decreased STAT3 phosphorylation after treatment with tunicamycin (Fig. 2A). Next, we used isolated hepatocytes derived from genetically obese/ diabetic model db/db mice to examine the effects of ER diabetes.diabetesjournals.org
K. KIMURA AND ASSOCIATES
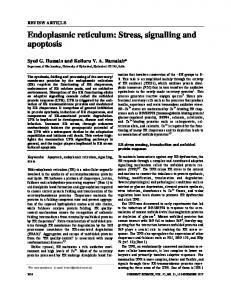
FIG. 1. Induction of ER stress decreases tyrosine phosphorylation of hepatic STAT3. A and B, top: Wild-type mouse–derived hepatocytes were pretreated with tunicamycin (A) or palmitate (B) followed by stimulation with IL-6 and analyzed for expression of CHOP, phosphorylation of IRE1a, and tyrosine phosphorylation of STAT3. Quantitation of IRE1a and STAT3 phosphorylation levels is normalized to total IRE1a and STAT3 (bottom), respectively, and is represented as mean 6 SE. *P < 0.05; open bar, vehicle-treated hepatocytes; closed bar, tunicamycin (A)- or palmitate (B)-treated hepatocytes. C: Wild-type mouse–derived hepatocytes were treated with tunicamycin for 6 h, and cells were stimulated with IL-6 for 1, 2, or 3 h before harvest. Cells were then analyzed for the expression levels of tyrosine phosphorylation of JAK2 and STAT3 (left). Quantitation of JAK2 and STAT3 phosphorylation is normalized to total JAK2 and STAT3, respectively, and is represented as mean 6 SE. *P < 0.05 (right); ○, untreated hepatocytes; ■, tunicamycin-treated hepatocytes.
stress on STAT3 activation and suppression of hepatic gluconeogenic enzyme expression. When compared with lean control mouse–derived hepatocytes, db/db mouse–derived hepatocytes exhibited increased ER stress, as indicated by increased CHOP expression and IRE1a phosphorylation, and a decrease in IL-6–dependent phosphorylation of STAT3 (Fig. 2B and C). Pretreatment with PBA or TUDCA has been shown to alleviate ER stress in cultured cells (19). db/db mouse–derived hepatocytes pretreated with PBA or TUDCA decreased CHOP expression and IRE1a phosphorylation, indicating reduced ER stress, and increased IL-6– dependent phosphorylation of STAT3 (Fig. 2B and C). Production of SOCS3 protein and induction of mRNA by diabetes.diabetesjournals.org
IL-6 decreased in db/db mouse–derived hepatocytes compared with lean mouse–derived hepatocytes, and PBA treatment increased IL-6–induced SOCS3 mRNA, but not SOCS3 protein, in db/db mouse–derived hepatocytes (Fig. 2B and D). In isolated hepatocytes, cAMP-induced expression of the hepatic gluconeogenic enzyme genes Pck1 and G6pc was suppressed by treatment with IL-6 in a STAT3-dependent manner (7). db/db mouse–derived hepatocytes exhibited decreased IL-6–dependent suppression of hepatic gluconeogenic enzyme gene expression, but the suppressive effect was increased by pretreatment with PBA (Fig. 2E and F). To examine the in vivo effect of ER stress on hepatic STAT3 activation in mice, we then analyzed the level of DIABETES, VOL. 61, JANUARY 2012
63
ER STRESS AND GLUCONEOGENIC REGULATION BY STAT3
FIG. 2. ER stress impairs activity of hepatic STAT3 in isolated hepatocytes. A: Wild-type mouse–derived hepatocytes were treated with tunicamycin and analyzed for IL-6–stimulated expression of SOCS3 protein. B and C, top: db/db mouse–derived hepatocytes were pretreated with PBA (B) or TUDCA (C) and analyzed for the level of expression of SOCS3 protein, phosphorylation of IRE1a, and tyrosine phosphorylation of STAT3 after stimulation with IL-6. b-Actin was used as a loading control. Quantitation of IRE1a and STAT3 phosphorylation levels is normalized to total IRE1a and STAT3 (bottom), respectively, and is represented as mean 6 SE. *P < 0.05; open bar, lean hepatocyte; closed bar, db/db hepatocytes. D–F: db/db mouse–derived hepatocytes were pretreated with PBA and analyzed for the induction of SOCS3 mRNA expression (D) and the suppressive effect of IL-6 on cAMP-induced expression of Pck1 mRNA (E) and G6pc mRNA (F) by quantitative RT-PCR. Data are represented as mean 6 SE. *P < 0.05 (n = 4 in each group); open bar, untreated hepatocytes; closed bar, IL-6–treated hepatocytes.
64
DIABETES, VOL. 61, JANUARY 2012
diabetes.diabetesjournals.org
K. KIMURA AND ASSOCIATES
hepatic STAT3 phosphorylation after continuous intravenous IL-6 administration. Induction of ER stress in mice by intraperitoneal administration of tunicamycin resulted in decreased IL-6–stimulated phosphorylation of hepatic STAT3 and suppressed expression of SOCS3 (Fig. 3A). Next, we performed the same analysis in genetically obesity/ diabetes model db/db mice. db/db mice showed no change in IL-6–stimulated phosphorylation of STAT3 in the skeletal muscle and white adipose tissue, but a clear decrease in phosphorylation of STAT3 in the liver compared with lean controls (Fig. 3B). Hepatic upregulation of mRNA of Grp78, an ER chaperone, in db/db mice indicated the
increase of ER stress in the liver (Fig. 3C), as described previously for leptin-deficient ob/ob mice (17). Administration of PBA decreased hepatic Grp78 expression to a level comparable with that of lean controls, suggesting that PBA administration alleviates hepatic ER stress (Fig. 3C). Concomitantly with the decrease of hepatic Grp78, PBA administration increased IL-6–stimulated hepatic STAT3 phosphorylation in db/db mice (Fig. 3B). db/db mice also exhibited decreased IL-6–induced suppression of hepatic gluconeogenic enzyme gene expression compared with lean controls, which was reversed by treatment with PBA (Fig. 3D and E). There was no significant difference in food
FIG. 3. ER stress impairs activity of hepatic STAT3 in db/db mice. A: Tunicamycin was intraperitoneally administered to wild-type mice, and the levels of IRE1a phosphorylation and STAT3 tyrosine phosphorylation as well as expression levels of SOCS3 induced by continuous IL-6 administration were determined by Western blotting. Arrows indicate SOCS3 protein; *nonspecific band. B–E: Lean control mice (lean), db/db mice (db), and PBA-treated db/db mice were subjected to continuous IL-6 administration in the presence of somatostatin. B: Level of STAT3 tyrosine phosphorylation 3 h after continuous administration of IL-6 in the liver, skeletal muscle (Mus), and white adipose tissue (WAT; left). Quantitation of STAT3 phosphorylation levels is normalized to total STAT3 and is represented as mean 6 SE (right). *P < 0.05 (n = 6 in each group); open bar, lean mice; closed bar, db/db mice; striped bar, PBA-treated db/db mice. C–E: Gene expression levels of Grp78 (C), Pck1 (D), and G6pc (E) in the liver by quantitative RT-PCR. Data are represented as mean 6 SE. *P < 0.05 (n = 6 in each group); open bar, saline (veh)-treated; closed bar, IL-6–treated mice. diabetes.diabetesjournals.org
DIABETES, VOL. 61, JANUARY 2012
65
ER STRESS AND GLUCONEOGENIC REGULATION BY STAT3
intake and body weight between PBA-treated db/db mice and untreated db/db mice. Nonfasting blood glucose levels 14 days after treatment with PBA tended to be lower in PBA-treated db/db mice (381 6 57 mg/dL; n = 6) than in untreated db/db mice (474 6 84 mg/dL; n = 6), although the tendency did not reach statistical significance. There was no significant difference in blood IL-6 concentration after continuous intravenous IL-6 administration or in the hepatic IL-6 mRNA expression level between lean controls, untreated db/db mice, and PBA-treated db/db mice. ER stress decreases JAK phosphorylation. We then examined how ER stress suppresses STAT3 phosphorylation. Protein-tyrosine phosphatases, including PTP1B, have been shown to suppress STAT3 activation by dephosphorylating JAK2 (24,25), and recent reports have revealed that PTP1B expression is increased under ER stress (26,27). Actually, we found that PTP1B activity is increased in tunicamycin-treated isolated hepatocytes (Fig. 4A). Furthermore, db/db mouse–derived hepatocytes or tunicamycin-treated isolated hepatocytes exhibited decreased IL-6–stimulated phosphorylation of JAK2, which was reversed by treatment with vanadate (Fig. 4B and C). However, despite the restoration of IL-6–dependent phosphorylation of JAK2 by treatment with vanadate, only a slight improvement was observed for IL-6–dependent phosphorylation of STAT3 (Fig. 4B and C). Similarly, treatment with a PTP1B inhibitor resulted in restoration of tunicamycininduced suppression of phosphorylation of JAK2 but not of STAT3 (Fig. 4D). ER stress decreases STAT3 acetylation. STAT3 acetylation has been shown to be correlated with activation and tyrosine phosphorylation of STAT3 (12). We analyzed the level of acetylation of hepatic STAT3 after continuous intravenous IL-6 administration. When compared with lean controls, db/db mice exhibited a clear decrease in IL-6– dependent acetylation of STAT3, and treatment of db/db mice with PBA resulted in improvement of IL-6–dependent STAT3 acetylation to a level comparable with that of lean controls (Fig. 5A). db/db mouse–derived hepatocytes also exhibited decreased IL-6–dependent acetylation of STAT3, which was increased with improvement in STAT3 phosphorylation after pretreatment with PBA (Fig. 5B). We then transduced wild-type STAT3, nonacetylated mutant STAT3– 4R, and acetylated mutant STAT3-K685Q into isolated hepatocytes via adenovirus vector and analyzed the level of STAT3 phosphorylation after stimulation with IL-6. As described previously (12), 4R mutant with lysine residues 679, 685, 707, and 709 replaced by arginine exhibited decreased IL-6–stimulated phosphorylation of STAT3, which was coincident with the loss of acetyl lysine signaling on Western blot analysis both with anti–acetyl lysine antibody and anti– acetylated Lys685-STAT3 antibody (Fig. 5C). K685Q mutant exhibited increased IL-6–stimulated STAT3 phosphorylation, and residual phosphorylation was observed even after treatment with tunicamycin (Fig. 5D). When pretreated with vanadate to restore JAK2 phosphorylation, wild-type STAT3 exhibited a mild restoration of tunicamycin-induced suppression of phosphorylation, whereas K685Q mutant exhibited a significant restoration of phosphorylation (Fig. 5D). Isolated hepatocytes manipulated to overexpress wildtype STAT3 show suppressed hepatic gluconeogenic enzyme expression after stimulation with cAMP (7). We then overexpressed wild-type STAT3 or K685Q mutant in isolated hepatocytes to examine their effects on hepatic gluconeogenic enzyme gene expressions (Supplementary Fig. 1). When transduced into lean control mouse–derived 66
DIABETES, VOL. 61, JANUARY 2012
isolated hepatocytes, both wild-type STAT3 and K685Q mutant suppressed such expression in a dose-dependent manner (Fig. 5E and F). On the other hand, db/db mouse– derived hepatocytes manipulated to overexpress K685Q mutant exhibited a greater suppression of such expression than those overexpressing wild-type STAT3 (Fig. 5E and F). STAT3 acetylation increases suppression of hepatic glucose production in db/db mice. We induced mouse livers to overexpress wild-type STAT3 or K685Q mutant via intravenous adenovirus injection to examine their effects on in vivo glucose metabolism and hepatic gluconeogenic enzyme gene expression (Fig. 6A). We have shown that hepatic STAT3 is activated after glucose administration in lean mice (8). As in lean control mice, glucose administration in db/db mice induced hepatic STAT3 phosphorylation (Fig. 6A). In accordance with the finding that the K685Q mutant is resistant to ER stress–induced suppression of STAT3 phosphorylation, the K685Q mutant exhibited increased phosphorylation in db/db mice liver, whereas there was no difference in phosphorylation between wild-type and K685Q mutants in lean controls (Fig. 6A). In both lean control and db/db mice, hepatic overexpression of wild-type STAT3 and K685Q mutant decreased the blood glucose level compared with b-galactosidase (Fig. 6B and C). In lean control mice, no clear difference was seen in blood glucose levels under ad libitum food conditions between wild-type STAT3 and K685Q mutant (Fig. 6B). In db/db mice, however, K685Q mutant provided a greater decrease in the blood glucose level than wildtype STAT3 (Fig. 6C). In db/db mice, wild-type and K685Q mutant overexpression reduced plasma aspartate transaminase and alanine transaminase levels compared with b-galactosidase (Supplementary Fig. 2). Plasma levels of insulin, glucagon, and IL-6 showed no significant difference between mice with overexpressed b-galactosidase, wild-type, and K685Q mutants (Supplementary Fig. 3), and there was no statistical difference in body weight or dietary intake in db/db mice. In the intraperitoneal GTT, no clear difference was seen in blood glucose levels between wild-type STAT3 and K685Q mutant in control mice (Fig. 6D), whereas in db/db mice, K685Q mutant provided a greater improvement in glucose tolerance than wild-type STAT3 (Fig. 6E). STAT3 overexpression ameliorated fasting hyperinsulinemia in db/db mice, whereas there was no difference in plasma insulin levels after fasting and during the intraperitoneal GTT between wild-type and K685Q overexpression in both lean control and db/db mice (Fig. 6F and G). With regard to hepatic gluconeogenic enzyme expression, wild-type STAT3 and K685Q mutant provided a comparable degree of suppression of enzyme expression in control mice at both the mRNA and protein level (Fig. 7A and B), whereas in db/db mice, K685Q mutant suppressed mRNA and protein expression of G6Pase significantly to a greater degree than wild-type STAT3 (Fig. 7B). Furthermore, G6Pase suppression resulted in a greater increase of hepatic glycogen content in K685Q mutant mice than in wild-type db/db mice (Fig. 7C). To measure EGP, we performed hyperinsulinemic-euglycemic clamp studies by infusing insulin at 1.25 mU/kg/min into nonobese mice and at 10 mU/kg/min into db/db mice to produce a clear insulin effect. During insulin clamp studies, no clear difference was seen in EGP suppression or GIR between wild-type STAT3 and K685Q mutant in controls (Fig. 7D). In db/db mice, K685Q mutant induced a greater increase in EGP suppression and GIR than wild-type STAT3 (Fig. 7E). diabetes.diabetesjournals.org
K. KIMURA AND ASSOCIATES
FIG. 4. Inhibition of protein tyrosine phosphatase improves ER stress–induced suppression of JAK2 phosphorylation. A: Lean mouse–derived hepatocytes were pretreated with tunicamycin and PTP1B inhibitor followed by stimulation with IL-6 and analyzed for the effect of ER stress on cellular PTP1B activity. PTP1B activity was expressed as a percentage of that of the controls. B: db/db mouse–derived hepatocytes were treated with sodium orthovanadate (Vana) and analyzed for the levels of IL-6–dependent JAK2 phosphorylation and STAT3 phosphorylation (left). Quantitation of phosphorylation of IRE1a and STAT3 is normalized to total IRE1a and STAT3, respectively, and is represented as mean 6 SE (right). *P < 0.05; open bar, lean hepatocyte; closed bar, db/db hepatocytes. C and D: Lean mouse–derived hepatocytes were pretreated with tunicamycin and sodium orthovanadate (Vana) or a PTP1B inhibitor (PTP1Bi) followed by stimulation with IL-6 and analyzed for the levels of phosphorylation of IRE1a and tyrosine phosphorylation of JAK2 and STAT3 (left). Quantitation of IRE1a, JAK2, and STAT3 phosphorylation levels is normalized to total IRE1a, JAK2, and STAT3, respectively, and is represented as mean 6 SE (right). *P < 0.05.
diabetes.diabetesjournals.org
DIABETES, VOL. 61, JANUARY 2012
67
ER STRESS AND GLUCONEOGENIC REGULATION BY STAT3
FIG. 5. Acetylated mutant of STAT3 is less susceptible to ER stress–induced suppression of STAT3 activation. A: Control mice (lean), db/db mice (db), and PBA-treated db/db mice were subjected to continuous IL-6 administration in the presence of somatostatin, and the level of acetylation of hepatic STAT3 was determined by Western blotting (left). Quantitation of STAT3 acetylation levels is normalized to immunoprecipitated STAT3 and is represented as mean 6 SE (right). *P < 0.05 (n = 6 in each group); open bar, lean mice; closed bar, db/db mice; striped bar, PBA-treated db/db mice. B: db/db mouse–derived isolated hepatocytes were pretreated with PBA and analyzed for the level of IL-6–stimulated acetylation of STAT3 (left). Quantitation of STAT3 acetylation levels is normalized to immunoprecipitated STAT3 and is represented as mean 6 SE (right). Open bar, lean hepatocyte; closed bar, db/db hepatocytes. C: Lean mouse–derived isolated hepatocytes were forced to express wild-type STAT3 or 4R mutant via adenovirus vector, treated with tunicamycin, and analyzed for the level of IL-6–dependent acetylation and tyrosine phosphorylation of exogenously induced STAT3. Cell extracts were immunoprecipitated with anti-FLAG antibody and analyzed by anti–acetyl-lysine (AcK), acetyl-STAT3, phospho-STAT3, and total STAT3 antibody. D: Lean mouse–derived hepatocytes were forced to express wild-type STAT3 or K685Q mutant via 68
DIABETES, VOL. 61, JANUARY 2012
diabetes.diabetesjournals.org
K. KIMURA AND ASSOCIATES
Class 1-HDAC plays an important role in ER stress– induced suppression of STAT3 acetylation. Class 1 HDAC and SirT1 have been shown to be involved in the process of STAT3 deacetylation (12,14). Pretreatment with TSA, an HDAC inhibitor, resulted in restoration of decreased IL-6–dependent phosphorylation and acetylation of STAT3 in tunicamycin-treated or db/db mouse–derived hepatocytes (Fig. 8A and B), whereas pretreatment with Ex527, a SirT1 inhibitor, did not (Fig. 8C and D). To examine the effect of HDAC or SirT1 on hepatic STAT3 phosphorylation in vivo, we injected TSA or EX527 into lean and db/db mice transfected with b-galactosidase, wild-type STAT3, or K685Q mutant–carrying adenovirus. Although both TSA and Ex527 increased hepatic STAT3 activation 3 h after glucose administration in lean mice, TSA increased hepatic STAT3 phosphorylation to a much greater degree than Ex527 in db/db mice with b-galactosidase or wildtype STAT3 (Fig. 8E). K685Q mutant db/db mice showed no clear enhancement of STAT3 phosphorylation by TSA or EX527 (Fig. 8E). Plasma IL-6 levels were below minimum detectable sensitivity in lean mice and showed no significant difference between control db/db mice (Supplementary Fig. 4). DISCUSSION
Hepatic ER stress has been shown to cause increased expression of hepatic gluconeogenic enzyme genes via disruption of insulin/PI3-K signaling (19). The current study has revealed that ER stress impairs suppression of hepatic gluconeogenic enzyme gene expression by disrupting STAT3 signaling. ER stress induced by treatment with tunicamycin or palmitate significantly suppressed IL-6–dependent phosphorylation of STAT3. IRE1a signaling plays a role in feedback mechanism for tunicamycin-induced ER stress (28) and is one of the causal agents for obesity-induced ER stress (29), indicating that phosphorylation of IRE1a reflects the increase in ER stress. IRE1a phosphorylation was enhanced in db/db mouse–derived hepatocytes in addition to the increase of CHOP, another marker of ER stress, suggesting that ER stress is increased in db/db mouse– derived hepatocytes. db/db mouse–derived hepatocytes also exhibited impaired STAT3 activation and decreased STAT3dependent suppression of hepatic gluconeogenic enzyme expression. Administration of chemical chaperone PBA to ob/ob mice has been shown to improve glucose tolerance and decrease hepatic glucose production (19). In the current study, db/db mice treated with PBA also showed a tendency for improvement in blood glucose levels, while the tendency did not reach statistical significance, possibly because of genetic background. In db/db mice, IL-6 administration results in decreased hepatic STAT3 phosphorylation and suppressed the inhibition of gluconeogenic enzyme gene expression, whereas PBA administration enhances both processes. In white adipose tissue, another tissue sensitive to ER stress, IL-6–induced STAT3 phosphorylation showed no difference between lean mice, db/db mice, and db/db mice treated
with PBA. The response of adipose-STAT3 to IL-6 infusion was blunter than that of the liver and muscle, possibly because adipose tissue is one of the main tissues to secrete IL-6. This blunt response might have masked the effect of PBA in the adipose tissue. These findings suggest that alleviation of ER stress in the obese/diabetic state contributes to improvement of impaired IL-6/STAT3 signaling in the liver. SOCS3 is known to inhibit IL-6/STAT3 signaling (23). SOCS3 protein was decreased in tunicamycin-treated or db/db mouse–derived hepatocytes such that the inhibition of STAT3 activation is not associated with SOCS3 expression. PTP1B is also known to inhibit STAT3 activity via JAK dephosphorylation, which activates STAT3 (24,25), and recent reports have indicated that PTP1B expression is upregulated in pancreatic b-cells and liver in response to ER stress (26,27). ER stress has been shown to suppress leptin-dependent phosphorylation of STAT3 via PTP1B in neuroblastoma cell lines (30). In the current study, we found that PTP1B activity was increased by treatment with tunicamycin and that treatment with vanadate or a PTP1B inhibitor restored ER stress–induced suppression of JAK2 phosphorylation. Nevertheless, treatment with vanadate or a PTP1B inhibitor resulted in only a slight restoration of the ER stress–dependent decrease in STAT3 phosphorylation in hepatocytes. These findings suggest the involvement of mechanisms other than suppressed JAK2 phosphorylation in the ER stress–dependent decrease in STAT3 phosphorylation in hepatocytes. It has been reported that STAT3 acetylation plays an important role in dimer formation, binding affinity to DNA and nuclear localization of STAT3, and is also closely correlated with its phosphorylation (13,14). We found in the current study that STAT3 acetylation is decreased by ER stress and restored by pretreatment with PBA. As reported previously, STAT3–4R, a nonacetylated mutant of STAT3, exhibited decreased IL-6–dependent phosphorylation (12), whereas STAT3-K685Q, an acetylated mutant, exhibited increased IL-6–dependent phosphorylation, suggesting a correlation between acetylation and phosphorylation of STAT3. K685Q mutant exhibited residual phosphorylation in the presence of ER stress, and decreased phosphorylation was restored in association with improvement in JAK2 phosphorylation after treatment with vanadate. These findings suggest a close relationship between ER stress–induced suppression of STAT3 acetylation and impaired STAT3 phosphorylation. Our results showed no significant difference between K685Q mutant and wild-type STAT3 with regard to suppression of hepatic gluconeogenic enzyme gene expression in lean mouse–derived hepatocytes and in the liver of lean mice. However, K685Q mutant more strongly suppressed hepatic gluconeogenic enzyme gene expression than wild-type STAT3 in db/db mouse–derived hepatocytes and in the liver of db/db mice. In db/db mice, the K685Q mutant exhibited amelioration of hyperglycemia by intraperitoneal GTT, increased the GIR, and suppressed EGP in a hyperinsulinemic-euglycemic clamp test to a greater degree than wild-type STAT3. Hepatic STAT3 activation increases
infection with an adenovirus vector, treated with tunicamycin and orthovanadate (Vana) for 6 h, and analyzed for the level of IL-6–dependent tyrosine phosphorylation of exogenously induced STAT3. The top row shows the levels of STAT3 tyrosine phosphorylation from an immunoprecipitate with anti-FLAG antibody. The bottom row shows the levels of JAK2 phosphorylation from whole cell lysate. E and F: Lean mouse–derived hepatocytes or db/db mouse–derived isolated hepatocytes were forced to express wild-type STAT3 or K685Q mutant via infection with an adenovirus vector at multiplicity of infection values 3 and 10 and analyzed for their suppressive effect on expressions of Pck1 (E) and G6pc (F) by quantitative RT-PCR. Data are represented as mean 6 SE. *P < 0.05 (n = 4 in each group); open bar, b-galactosidase overexpression (control); closed bar, wild-type STAT3; striped bar, K685Q-infected mutant. diabetes.diabetesjournals.org
DIABETES, VOL. 61, JANUARY 2012
69
ER STRESS AND GLUCONEOGENIC REGULATION BY STAT3
FIG. 6. Acetylated mutant of STAT3 suppresses glucose intolerance in db/db mice. db/db mice (db) or control mice (lean) were manipulated to express wild-type STAT3 or K685Q mutant in their livers via infection with adenovirus vector and then examined for hepatic phosphorylation of STAT3 induced by glucose administration (A), blood glucose levels in a randomly fed state (B and C), and a GTT (D–G). A: Tyrosine phosphorylation of hepatic STAT3 in the fasting state and after glucose administration (left). Quantitation of STAT3 phosphorylation levels is normalized to b-actin and is represented as mean 6 SE (right). *P < 0.05 (n = 4 in each group); open bar, fasting mice; closed bar, glucose-administered mice. B and C: Blood glucose levels in mice in a randomly fed state are represented as mean 6 SE (n = 6 in each group) in lean mice (B) and db/db mice (C). Blood glucose level (D and E) and plasma insulin levels (F and G) during the GTT in lean mice (D and F) or in db/db mice (E and G) are represented as mean 6 SE (n = 6 in each group). *P < 0.05 vs. b-galactosidase overexpression; †P < 0.05 vs. wild-type STAT3 overexpression; ○, b-galactosidase overexpression; □, wild-type STAT3 overexpression; ■, K685Q mutant overexpression.
70
DIABETES, VOL. 61, JANUARY 2012
diabetes.diabetesjournals.org
K. KIMURA AND ASSOCIATES
FIG. 7. Acetylated mutant of STAT3 suppresses EGP in db/db mice to a greater degree than wild-type STAT3. db/db mice (db) or control mice (lean) were manipulated to express wild-type STAT3 or K685Q mutant in their livers via infection with adenovirus vector and examined for expression of hepatic gluconeogenic enzymes and hepatic glycogen content. A and B: Expression levels of Pck1 (A) and G6pc (B) were measured by quantitative RT-PCR (left) and Western blotting (right). Data are represented as mean 6 SE (n = 6 in each group). C: Hepatic glycogen content. Data are represented as mean 6 SE (n = 4 in each group). D and E: Insulin sensitivity was assayed using an euglycemic-hyperinsulinemic clamp in lean control mice (lean; D) and db/db mice (db; E). Left: glucose infusion ratio; middle: EGP before and after insulin-clamp; right: glucose disposal rate. Data are represented as mean 6 SE (n = 4 in each group). *P < 0.05 vs. b-galactosidase overexpression.
diabetes.diabetesjournals.org
DIABETES, VOL. 61, JANUARY 2012
71
ER STRESS AND GLUCONEOGENIC REGULATION BY STAT3
FIG. 8. HDAC inhibitor restores ER stress–induced decrease in STAT3 acetylation. A–D: Tunicamycin-treated hepatocytes (A and C) or db/db mouse–derived hepatocytes (B and D) were treated with TSA (A and B) or Ex527 (C and D) and analyzed for levels of IL-6–dependent acetylation and phosphorylation of STAT3 (left). Quantitation of STAT3 acetylation level is normalized to immunoprecipitated STAT3 (top right), and quantitation of STAT3 phosphorylation levels is normalized to total STAT3; both are represented as mean 6 SE (bottom right). *P < 0.05. Open bar, lean hepatocyte; closed bar, db/db hepatocytes. E: db/db mice (db) or control mice (lean) overexpressed wild-type STAT3 or K685Q mutant in their livers was examined for effects of HDAC inhibitors on hepatic STAT3 phosphorylation after glucose administration determined by Western blotting (left). Quantitation of STAT3 phosphorylation level is normalized to b-actin and is represented as mean 6 SE (right). *P < 0.05 (n = 5 in each group); open bar, DMSO (veh)-treated mice; closed bar, TSA-treated mice; striped bar, Ex527-treated mice.
72
DIABETES, VOL. 61, JANUARY 2012
diabetes.diabetesjournals.org
K. KIMURA AND ASSOCIATES
after glucose administration or a hyperinsulinemic clamp test (8), and we found that the overexpressed STAT3 wild-type or K685Q mutant was less activated in the fasting state and potently activated after glucose administration. A greater increase of STAT3 K685Q activation after glucose administration would explain the more potent phenotype with lowered blood glucose after intraperitoneal GTT and EGP during hyperinsulinemic clamp state and the absence of a phenotype under fasting blood glucose and EGP conditions, compared with wild-type STAT3. These findings suggest an important role for the suppression of STAT3 acetylation in impairment of the STAT3-dependent suppression of hepatic gluconeogenic enzyme genes and EGP in db/db mice. STAT3 has been shown to be acetylated by CREB-binding protein/p300 and deacetylated by HDAC and SirT1 (12,14). SirT1-dependent deacetylation of STAT3 has been demonstrated as an important process inducing hepatic gluconeogenic enzyme gene expression in a fasting state (12). We also found that a SirT1 inhibitor, Ex527, increased hepatic STAT3 phosphorylation to the same degree as a HDAC inhibitor or TSA in lean mice. These findings suggest that SirT1 plays an important role in the regulation of hepatic STAT3 activation under normal physiological conditions. However, TSA improved STAT3 activation in tunicamycintreated or db/db mouse–derived hepatocytes and db/db mice liver to a greater degree of potency than Ex527, suggesting that ER stress–dependent suppression of STAT3 acetylation and phosphorylation is less affected by SirT1 inhibition but is restored by pretreatment with a HDAC inhibitor. In conclusion, the results indicate that ER stress inhibits IL-6/STAT3-dependent suppression of hepatic gluconeogenic enzymes via JAK2 dephosphorylation and STAT3 deacetylation and thus plays an important role in increased expression of these enzymes in obesity and diabetes. The mechanism by which HDAC-dependent deacetylation of STAT3 is regulated by ER stress remains to be elucidated in future studies. ACKNOWLEDGMENTS
This work was supported by the Program for Promotion of Basic and Applied Research for Innovations in Biooriented Industry (BRAIN) to H.I.; a Grant-in-Aid for Young Scientists (B, 09008108) and a Grant-in-Aid for Scientific Research on Innovative Areas (23126509) from the Ministry of Education, Culture, Sports, Science and Technology of Japan (MEXT) to H.I.; a Grant-in-Aid for Creative Scientific Research (18GS0317) from MEXT to M.K.; a grant from Uehara Memorial Foundation to H.I.; and the Program for Improvement of Research Environment for Young Researchers from Japan Science and Technology Agency. No potential conflicts of interest relevant to this article were reported. K.K., T.Y., S.-I.A., T.M., and H.W. researched data. S.K., Y.K., T.H., and M.K. contributed to the discussion. M.M. and T.O. researched data and contributed to the discussion. Y.S. and K.M. reviewed and edited the manuscript. H.I. researched data and wrote the manuscript. The authors thank M. Nishio and Y. Anraku, Kanazawa University, for technical assistance. The authors also thank ThinkSCIENCE, Inc. (Tokyo, Japan) for help with preparing the manuscript. REFERENCES 1. Magnusson I, Rothman DL, Katz LD, Shulman RG, Shulman GI. Increased rate of gluconeogenesis in type II diabetes mellitus. A 13C nuclear magnetic resonance study. J Clin Invest 1992;90:1323–1327 diabetes.diabetesjournals.org
2. Radziuk J, Pye S. Hepatic glucose uptake, gluconeogenesis and the regulation of glycogen synthesis. Diabetes Metab Res Rev 2001;17:250–272 3. Herzig S, Long F, Jhala US, et al. CREB regulates hepatic gluconeogenesis through the coactivator PGC-1. Nature 2001;413:179–183 4. Matsumoto M, Pocai A, Rossetti L, Depinho RA, Accili D. Impaired regulation of hepatic glucose production in mice lacking the forkhead transcription factor Foxo1 in liver. Cell Metab 2007;6:208–216 5. Dentin R, Liu Y, Koo SH, et al. Insulin modulates gluconeogenesis by inhibition of the coactivator TORC2. Nature 2007;449:366–369 6. Nakae J, Kitamura T, Silver DL, Accili D. The forkhead transcription factor Foxo1 (Fkhr) confers insulin sensitivity onto glucose-6-phosphatase expression. J Clin Invest 2001;108:1359–1367 7. Inoue H, Ogawa W, Ozaki M, et al. Role of STAT-3 in regulation of hepatic gluconeogenic genes and carbohydrate metabolism in vivo. Nat Med 2004; 10:168–174 8. Inoue H, Ogawa W, Asakawa A, et al. Role of hepatic STAT3 in brain-insulin action on hepatic glucose production. Cell Metab 2006;3:267–275 9. Obici S, Zhang BB, Karkanias G, Rossetti L. Hypothalamic insulin signaling is required for inhibition of glucose production. Nat Med 2002;8: 1376–1382 10. Ramadoss P, Unger-Smith NE, Lam FS, Hollenberg AN. STAT3 targets the regulatory regions of gluconeogenic genes in vivo. Mol Endocrinol 2009;23: 827–837 11. Akira S. IL-6-regulated transcription factors. Int J Biochem Cell Biol 1997; 29:1401–1418 12. Nie Y, Erion DM, Yuan Z, et al. STAT3 inhibition of gluconeogenesis is downregulated by SirT1. Nat Cell Biol 2009;11:492–500 13. Wang R, Cherukuri P, Luo J. Activation of Stat3 sequence-specific DNA binding and transcription by p300/CREB-binding protein-mediated acetylation. J Biol Chem 2005;280:11528–11534 14. Yuan ZL, Guan YJ, Chatterjee D, Chin YE. Stat3 dimerization regulated by reversible acetylation of a single lysine residue. Science 2005;307:269–273 15. Dentin R, Hedrick S, Xie J, Yates J 3rd, Montminy M. Hepatic glucose sensing via the CREB coactivator CRTC2. Science 2008;319:1402–1405 16. Miyake K, Ogawa W, Matsumoto M, Nakamura T, Sakaue H, Kasuga M. Hyperinsulinemia, glucose intolerance, and dyslipidemia induced by acute inhibition of phosphoinositide 3-kinase signaling in the liver. J Clin Invest 2002;110:1483–1491 17. Ozcan U, Cao Q, Yilmaz E, et al. Endoplasmic reticulum stress links obesity, insulin action, and type 2 diabetes. Science 2004;306:457–461 18. Hotamisligil GS. Endoplasmic reticulum stress and the inflammatory basis of metabolic disease. Cell 2010;140:900–917 19. Ozcan U, Yilmaz E, Ozcan L, et al. Chemical chaperones reduce ER stress and restore glucose homeostasis in a mouse model of type 2 diabetes. Science 2006;313:1137–1140 20. Matsumoto M, Ogawa W, Teshigawara K, et al. Role of the insulin receptor substrate 1 and phosphatidylinositol 3-kinase signaling pathway in insulininduced expression of sterol regulatory element binding protein 1c and glucokinase genes in rat hepatocytes. Diabetes 2002;51:1672–1680 21. Minami M, Inoue M, Wei S, et al. STAT3 activation is a critical step in gp130-mediated terminal differentiation and growth arrest of a myeloid cell line. Proc Natl Acad Sci USA 1996;93:3963–3966 22. Wei Y, Wang D, Topczewski F, Pagliassotti MJ. Saturated fatty acids induce endoplasmic reticulum stress and apoptosis independently of ceramide in liver cells. Am J Physiol Endocrinol Metab 2006;291:E275–E281 23. Yoshimura A, Mori H, Ohishi M, Aki D, Hanada T. Negative regulation of cytokine signaling influences inflammation. Curr Opin Immunol 2003;15: 704–708 24. Zabolotny JM, Bence-Hanulec KK, Stricker-Krongrad A, et al. PTP1B regulates leptin signal transduction in vivo. Dev Cell 2002;2:489–495 25. Cheng A, Uetani N, Simoncic PD, et al. Attenuation of leptin action and regulation of obesity by protein tyrosine phosphatase 1B. Dev Cell 2002;2: 497–503 26. Bettaieb A, Liu S, Xi Y, et al. Differential regulation of endoplasmic reticulum stress by protein tyrosine phosphatase 1B and T cell protein tyrosine phosphatase. J Biol Chem 2011;286:9225–9235 27. Agouni A, Mody N, Owen C, et al. Liver-specific deletion of protein tyrosine phosphatase (PTP) 1B improves obesity- and pharmacologically induced endoplasmic reticulum stress. Biochem J 2011;438:369–378 28. Lee AH, Iwakoshi NN, Glimcher LH. XBP-1 regulates a subset of endoplasmic reticulum resident chaperone genes in the unfolded protein response. Mol Cell Biol 2003;23:7448–7459 29. Park SW, Zhou Y, Lee J, et al. The regulatory subunits of PI3K, p85alpha and p85beta, interact with XBP-1 and increase its nuclear translocation. Nat Med 2010;16:429–437 30. Hosoi T, Sasaki M, Miyahara T, et al. Endoplasmic reticulum stress induces leptin resistance. Mol Pharmacol 2008;74:1610–1619 DIABETES, VOL. 61, JANUARY 2012
73