The radial probzbility density of the Relaxed Excited State (RES) of the F center in KBr has been .... The solid line represents the function P(p) and the number ...
JOURNAL DE PHYSIQUE
Colloque C9, supple'ment ali no 1 1- 12, Tome 34, Nooembre-Dkcembre 1973, page C9- 141
ENDOR SPECTRUM AND WAVEFUNCTION FOR THE RELAXED-EXCITED STATE OF THE F CENTER IN KBr G. BALDACCHINI Laboratori Nazionali di Frascati del C N E N , Frascati, Italy and L. F. MOLLENAUER Bell Laboratories, Holmdel, New Jersey, USA
RCsumk. - La densite de probabilite radiale de I'Etat Excite Relaxe (RES) du centre F dans KBr a ete deduite de mesures de frkquences hyperfines. Les resultats ne permettent pas de choisir entre les etats 12s > et I 2p >. Cependant, la densit6 de probabilite experimentale peut Ctre assez bien representee par un etat diffus I 2p > ornettant la dkpendance angulaire. Abstract. - The radial probzbility density of the Relaxed Excited State (RES) of the F center in KBr has been extracted from measured hyperfine frequencies. The results do not allow statements to be made about the model of 2 s > versus j 2p > state. However the experimental probability density can be represented fairly well by a diffuse 12p > state lacking the angular dependence.
1. General considerations and previous results. Recently L. F. Mollenauer and coworkers have been able to detect for the first time the E N D O R resonance in the relaxed-excited state (RES) of the F center in KI [I], [2]. The most difficult and fundamental problems result from tlie short lifetime T of tlie RES. Indeed in order to affect tlie F center optical cycle [3] the electron has to (( j i ~ l ) the ) nuclear reversal during its stay in the RES. Hence the nuclear direction must be reversed in a time shorter than T. Owing to the fact that the linewidth of the nuclear resonances is pratically determined by the short lifetime r , the last condition becomes :
where y, is the gyromagnetic ratio of the nuclei and H, is one half the amplitude of the oscillating rf lield, H,, = 2 H , . We have used in ( I ) the normal transition probability from the st:lte 171 to /,I - I for n system of nuclear spins with angular momentum I. We disregarded completely the enhancement of the nuclear transition probability [4] which occurs in the presence of an hyperfine interaction. Hence the condition ( I ) is more restrictive than the true one. Keeping this in mind we will use the sign equal in ( I ) from now on. In general a lield H,, ol' the order of 100 Oe and at a frequency of several tens of MHz is necessary lo satisfy the ( I ) in :I typical ENDOR euperiment. The problem of senerating such high I/,,- was solved by Mollenauer clr ( I / . [?] by using a n ingenious experi-
mental arrangement. We will not describe here the apparatus, which was done elsewere, but we will be content to say that the rf field is generated by two loops of copper wire. 0 ~i 0.2 mm, which enclose a n I mni'. From ( I ) we calculate H,, = 50 Oe area of for F center in KI, t = 3.2 x s [ 5 ] . This implies at 30 MHz and at the liquid helium temperature a power dissipation by tlie loop of 8 mW. Now because of the Kapitza resistence [6] the temperature of the copper wires is 0.7 K higher than the bath temperature, To = 1.7 K. I t is clear that in such conditions the system is highly unstable. Much worse is the situas [7]. tion for F center- in KBr where r = 2 x In this case H,, = 100 Oe and the power dissipation is 30 rnW, which brings the temperature of the loop 2.5 K higher than the bath. This means that if we use the maximum experimentally acceptable H,, for both KI and KBr cryslals, the signal to noise ratio is much worse in KBr than i n KI. The EN DOR spectrum of F center in KI revealed with this apparatus is fairly good and tlie hyperfine frequencies are SO well resolved that we were able to extract from them the radial probability density for the RES [8]. I n the case of KBr another difficulty has to be consiticred. The E N D O R spectrum contains two spectra due to tlie isotopes Br7" ( I = 2. gpl,//l = 1 066.7 HziG. -, 50 ",; natural abundance) and Br8' ( 1 = 2 , g/1/,//~ = 1 140.9 Hz/G, 50 'I,' natural abundance) ; g is 11ic nuclear spectroscopic splitting l'rtctor a n d p,, istlic Bohr magneton. Never~liclesswe h~~cceeded in detecting the E N D O R spec-
-
-
-
Article published online by EDP Sciences and available at http://dx.doi.org/10.1051/jphyscol:1973927
-
,/I)
C9- 142
G. BALDACCHINI A N D L. F. MOLLENAUER
1 1.8 M H z
N
(\lhl)m;,x
> state
the RES of F center in KT a pure I 2p angular dependence :
trum in KBr [8]. As expected the spectrum was not resolved and the identification of the hyperfine frequencies was almost impossible. Only the maximum hyperfine frequency was extracted from it, i. e.
without
(4)
. and taking in account the experimental value of the ESR linewidth A H = 270 Oe, we obtain, from (2) 0.48 and A 2. 3 000 for the RES of F and (3,, center ill KBr.
If P(pi) is the electron probability density at the nuclear site i, where p is expressed in units of the nearest-neighbor distance d = 3.298 A for KBr, the hyperfine frequency is given by :
--
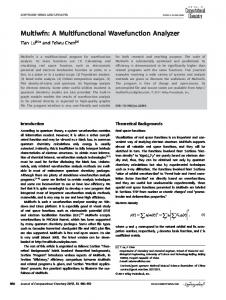
2. Actual results. - The n~etliod followed in thc previous section to calculate the values of rl and A I S highly unsatisfactory. First of all we used only one feature of tlie ENDOR spectrum, i. e. (\I,,) ,,,,,, without matching the electron probability denslty P ( p ) to the whole spectrum. Secondly, the experimental valuc of is approximated within 10 % which reflects on 11 and A . For these reasons we tried to extract more informatlon from the experimental ENDOR spectra. Indeed we obtained several spectra relative to different samples, always lioping to get a good one, which was never tlie case. Later we analysed these spectra more carefully taking the mean value of 12 (twelve) of them point by point. In this manner the SIN ratio is expected t o improve by a factor v1-12 = 3.5. In figure la, solid curve, the ENDOR spectrum so
where A is tlie amplification factor and C is 2.319 2 MHz for Br7' and 2.500 1 for Br8'. Assuming as for F center in KI that the ESR linewidth is due to hyperfine broadening, we have :
-
(\lhf),,,.,,
where AH is tlie full width at half power points of the ESR line of the RES and the sums over i and , j refer to the isotopes Br79 and Brs' respectively. Since the nuclear Zeeman frequencies at tlie magnetic field used are v, = 21.52 MHz (Br79) and \iz = 23.20 MHz (Br8') and the E N D O R frequencies are given by v, = v, + v,,, the maximum hyperfine frequency measured refers to the BrS1 isotope. Assuming as for
-
EXPERIMENTAL
a I I
22
23
24
I
I
25
26
I
27
28
29
- JE (MHZ)
*
30
,
31
I
32
I
33
34
35
E
ln
z
/---
Z-
I
b 1
2
8
6 48
72 24 24 2:-36
I-
ln 0
~r~~
24 12
---. .-..---246 ..--____-.12 ------. ...__,. .--. .--.. -.
W
-I 4 Z
37
36
, , ,'
,'
*
I
I
I
1
1
3
4
5
6
7
-~
h (MHZ) f
-
8
9
-..-
, -------__._..___
I
10
I
11
12
13
14
15
16
FIG.la. - Experimental ENDOR spectrum (solid curve) compared with computer s i m ~ ~ l a t i o(dashed n curve). Theoretical E N D O R spectrum due to Br79 b ) and Brsl c). The numbers besides the dashed curves are the numbers n, of equivalent nuclei which are responsible of that partion of curve.
E N D O R S P E C T R U M A N D W A V E F U N C T I O N F O R T H E R E L A X E D - E X C I T E D STATE
obtained is displayed versus v, and I*,,. Obviously it is not structured like tlie similar spectrum of K1 [I] but it has enough peaks at 35, 32.3, 30.5 and 28.5 M H z to make possible a theoretical fitting. We made a computer sitnulation of this spectrum based on the theoretical hyperfine frequencies (2) and witli linewidths adjusted for a best fit. As expected the linewidtlis used here are larger tlian those previously used for KI 181. Each normalized line was multiplied by an intensity factor
A = 5 M H z to reflect tlie dependence on tlie number of equivalent nuclei, 11,. in eacli shell, to reflect the fact that tlie probability for flipping a nuclear spin goes as v:, and to reflect the fact tliat cross-relaxation effects tend to short-circuit the E N D O R at low value of .,I\ The best fit is shown in figure la, dashed curve. To obtain this fit we shifted pratically only one frequency clearly indicated in figure 2, circles, where the 1
2
H A L I D E ShELL N U M B E R 3 4 5 6 7 8 1 0 1 2 14
25
15-
A
I
-.
.c
,'0-
' 0 0
D
5-
070
, 1
!
2
3
4
5
6
7
Tlie RES radiative lifetime, T = 2 x s, implies for the squared transition matrix element, 1 x 12, a value between 0.007 6 d 2 and 0.01 1 0 d 2 , the two limits obtained with and without local field correction. But ( x l 2 is also given by :
where I 2p > is the RES wavefunction, whose probability density is given by (4) and I Is > is the wavefunction for the non-relaxed ground state. We take the expression proposed by Fowler [9] for F center in NaCI :
Using (6) and (4) in (5) we obtain :
In order to remain in the interval of ( x I 2 implied by tlie lifetime T . x has to vary between 2.23 and 2.09. Tliese numbers are respectively -- 3 % and 9 "/;: smaller than tlie value used by Fowler for NaCI. Tlie aim of this work was to test the reliability of tlie model which assignes to the RES of F center a very diffuse 2p-like [9], [lo] wavefunction, in contrast with the very compact one for the ground state. The model was used successfully to explain the E N D O R spectrum in K I [8] and now. applied to the more complicated case of KBI-. it gives a satisfactory agreement with tlie partially resolved ENDOR spectrum. in conclusion we can say that at least for KI and KBI- no doubts retnain on the diffuse wave function of tlie RES of F center. (See note added.) We would like to acknowledge the constant support given us by C. D. JelTries. Professor at tlie Physics Department of the University of California, Berkeley, where tlie experimental part of this work was done. o Salvo for tlie Also we are indebted witli A l v ~ ~ l -Di ~ ~ s e f uassistence l with tlie computer calculation.
-
20-
1
C9- 143
8
FIG.2. - Probability density P(p) versus u n i c ~of the lattice parameter d = 3.298. Solid curve is eq. (4) for 11 0.48. The dots and circles represent the frequencies used in the computer simulation. The number besides each dot or circle is the number ns of equivalent nuclei of the halides shell. hyperfine frequencies. dots, li)r Br7' ; ~ n d Br8' are reported. The solid line represents the function P ( p ) and the number besides eacli dot o r circle represents li In tlie number 1 7 , of equivalent ~iucleii n e ~ ~ c sliell. figure Ib and I ( . tlie separate spectra of' ENDOR for Br79and ~ r *are given : the sum 01' tlie two gives [lie dashed line in fisure IN. Tlie lit is obtained witli '1 = 0.48 and A = 2 990. v:ilues similar to tlie previous ones obtained using only thc niaximum liyperlinc frequency. Howevcr tliesc values itre riow morc reliable and the uncertainty upon tIiem is much smaller.. Fur example a variation of 0.01 in tlic vi11~1co f 11 makcs the fitting almost impossible.
Note added. - Follo\ving completion of this manuscript. W. B. Fowler pointed out to t!s that tlie I 2s > \vavefunctio~iwe used in a previous paper [8], whilc trying various ad~iiixtures\\/it11 the I 2p > wavefunction. is not tlie correct one. Indeed both tlie wavefunctions these had tlie same w l u e of 11, which is the parameter respclnsible for their radial extent. On the contrary the correct 1 2s > state seems to be a very compact one. In this case tlic ( 2s > and ( 2p > radial probability densities are almost [he same for p > y1-2. (We would like to stress tliut o ~ experimental ~ r data cannot give a n y inforriiation on [lie wavefunction of the R E S for values o1.p smaller tlian .12,which is the distance 01' tlic liearcst halide shell.) I-lence tlic cc)nclusion dra\vn ill 18). tliat tlie RES of the k- centcr i n KI i \ a purc 1 2p > like state is incor-
C9- 144
G. BALDACCHINI A N D L. F. MOLLENAUER
rect ; this is also true for the RES of KBr, which this paper deals with. However the form (4) chosen for the RES remains a good approximation to the correct I 2s > state probability density in the region of interest. In the light of this new evidence the calculation for the matrix element I x l 2 seems to remain quite good even if there is some doubt of the correctness of the form (6) of the I Is > state, as pointed recently also by S. Wang et al., P i p . Rev. B 7 ( 1973) 1695. There is
some evidence that the 1 Is > state actually has a (( lo11g foil )) that makes the matrix element much bigger than we once thought. In conclusion we have determined the radial probability density of the RES with great accuracy and in our opinion this should be of considerable value to those who are trying to understand the relaxation process of the F center. However our results do not bear directly on the question of I 2s > versus I 2p > state !
References M., J. P11,v.r.Soc. Jal~nti33 (1972) [7] HONDA,S. and TOMURA, 1003. [8] MOLLENAUER, L. F. and BALDACCHINI, G., PIrys. Rev. [2] MOLLENAUER, L. F. and PAN, S., P / I ~ sRev. . B 6 (1972) Lett. 29 (1972) 465. In figures I and 2 of this work 772. we made a mistake. The number of equivalent nuclei [3] MOLLENAUER, L. F., PAN, S. and YNGVESSON, S., P/IJ~s. in the halide shells 7 and 13 are 48 and 72 respectively Rev. Lett. 23 (1969) 683. instead of 30 and 56 as stated there. This mistake reflects on the computer simulation, figure 2, in the [4] ABRACAM,A. and BLEANEY, B., elect rot^ Paratnagnetic sense of a better agreement between theory and expeResonance of Transition lotis (Clarendon, Oxford) riment with a new value for the cross-relaxation 1970, 228. constant A = 10.8 MHz. 151 FROHLICH,D. and MAHR,H., P11j.s. Rev. 141 (1966) 692. [9] FOWLER, W. B., P11j:v.Rev. 135 (1964) 1725. [6] HOARE,F. E., JACKSON, L. C. and KURTI,N., E.~p~,ritnet~/al [lo] Bos~, L., P0131~1, P. and SPINOLO, G . , PIIJ'S.Rev. 175 Cryophysics (London, Butterworths) 1961, 313. (1968) 1133. [ l ] MOLLENAUER, L. F., PAN, S. and WINNAC-KEK, A., PIIJ's. Rev. Lett. 26 (1971) 1643.
DISCUSSION A. M. STONEHAM. - a ) Ham's most recent work indicates that the lowest relaxed excited state should be almost entirely s-like, and that any large p-admixture would be inconsistent with other work on the relaxed state ; b, Ham's analysis of the F-centre "ggests that s-p admixture is enough to explain the long lifetime, even without an extended excited state. It would be nice to look at this 'ystern your methods.
G . BALDACCHINI. - a) I would like to add that
Ham feels that only an s-like wave-function could explain the isotropy of the ESR lines and ENDOR spectra. In any case at moment there is not a complete theoretical work on the nature of the RES.
6) Unfortunately I don't see now how to overcome the experimental difficulties arising from the short lifetime of the F-center i n Even more the factors of the ground state and the are not too different from each other and there would be an overlapping of the two EPR lines which is really disturbing in our method.