ENERGETIC NEUTRAL ATOMS FROM THE HELIOSHEATH. P. Wurz, A. Galli, S. Barabash, and A. Grigoriev. Physics Institute, University of Bern, CH-3012 Bern ...
A
The Astrophysical Journal, 683:248Y 254, 2008 August 10 # 2008. The American Astronomical Society. All rights reserved. Printed in U.S.A.
ENERGETIC NEUTRAL ATOMS FROM THE HELIOSHEATH P. Wurz, A. Galli, S. Barabash, and A. Grigoriev Physics Institute, University of Bern, CH-3012 Bern, Switzerland; Institute of Space Physics, IRF, S-98128 Kiruna, Sweden Received 2008 March 19; accepted 2008 April 28
ABSTRACT We present the measurement and analysis of hydrogen energetic neutral atoms (ENAs) recorded with the NPD sensor of the ASPERA-3 instrument on board Mars Express during the cruise phase and the Mars orbit phase. We conclude that the origin of these ENAs is the inner heliosheath. The ENA energy spectra are all very similar and can be fitted well by a two-component power law. The ENA intensities, integrated from 0.3 to 10 keV, vary in the range of 5 ; 10 3 to 3 ; 10 4 cm�2 sr�1 s�1. This report is an update of our earlier paper using the final NPD calibration data and improved sensor knowledge from two years of NPD operation. The present ENA measurements fit together well with earlier ENA data that were obtained from other spacecraft at higher energies, and which also have their likely origin in the inner heliosheath. Comparison of the measured ENA energy spectra with results from several heliospheric models shows that some of these models predict significantly lower ENA intensities at Earth orbit. Subject headingg s: acceleration of particles — ISM: general — plasmas Online material: color figures 1. INTRODUCTION
This paper is an update to an earlier publication by Galli et al. (2006a). The update became necessary because the improved calibration data of the Neutral Particle Detector (NPD) of ASPERA-3 and ASPERA-4 became available since the time of the original publication (Grigoriev 2007). In short, in the new calibration data the detection efficiency of the NPD sensor of ASPERA-3 instrument (Mars Express) is about a factor of 2 higher; thus the absolute values of the measured ENA intensities have decreased by this factor. Moreover, the angular response of the NPD sensor was revised. Thus, all the NPD data had to be reprocessed with the new NPD calibration function (Galli 2008). In addition, having gained two years of experience with ENA measurements near Mars (the main scientific objective of the NPD sensor) has resulted in the exclusion of most of the NPD data recorded in Mars orbit because of possible contamination by Martian ENAs. Our interpretation that this ENA signal originates from the inner heliosheath (Galli et al. 2006a; Wurz et al. 2006) has recently been challenged by Wood et al. (2007). The authors based their conclusions on extrapolations of our ENA energy spectra toward the energy range covered by the Ly� measurements that they performed with the Hubble Space Telescope (HST ). We will show that their arguments are not valid in the discussion section of this paper.
The Sun is the source of a supersonic flow of plasma, the solar wind (SW ), that fills all interplanetary space, and which rams into the local interstellar cloud (LIC), resulting in a large interaction region. The interaction region comprises distinct boundaries: the solar wind termination shock, where the solar wind is slowed down to subsonic speeds; the heliopause separating solar wind plasma from interstellar plasma; and the bow shock in the interstellar medium (if it exists). Because of the relative motion of the solar system with respect to the LIC with 26 km s�1, interstellar neutral atoms can pass the heliopause and penetrate into the solar system, even down to Earth orbit (e.g., Mo¨bius et al. 2006). The heliospheric termination shock (TS) has been identified by the Voyager 1 instrumentation to be at 94 AU during late 2004 ( Burlaga et al. 2005; Decker et al. 2005; Stone et al. 2005). Voyager 2 crossed the TS on 2007 August 30 at a distance of 84 AU. Heliospheric energetic neutral atoms (ENAs) are predominantly hydrogen atoms that have been produced on the far side of the termination shock in the inner heliosheath, the area between the termination shock and the heliopause. There, ENAs are continually produced by charge exchange between interstellar neutral atoms and protons from the solar wind, from pickup ions, or from other ion populations (e.g., Chalov et al. 2003; Fahr and Scherer 2004). These processes are predicted to result in a flux of inwardmoving ENAs that are detectable at Earth orbit (Hsieh et al. 1992; Gruntman et al. 2001; Fahr & Scherer 2004). Imaging these ENAs and measuring their energy spectra provides information on the termination shock, on the heliosheath surrounding it, and in general about the interaction of the heliosphere with the local interstellar cloud. ENA imaging has become an established means of remote sensing of plasma distributions in planetary and space science (Wurz 2000), and even the lowest ENA energies are now accessible with suitable detection techniques (Wurz et al. 2006). The Interstellar Boundary Explorer (IBEX ) mission of NASA will be recording spatially and spectrally resolved ENA images with high instrument sensitivity ( McComas et al. 2004). In the following we will present ENA data recorded with the Analyzer of Space Plasma and Energetic Atoms (ASPERA-3) instrument on the Mars Express mission of the European Space Agency (ESA).
2. NPD/ASPERA-3 OBSERVATIONS The ASPERA-3 instrument on the Mars Express spacecraft has been designed to study the interaction of the solar wind with the Martian atmosphere and to characterize the plasma and neutral particle environment in the vicinity of Mars (Barabash et al. 2004). The ASPERA-3 instrument comprises four different sensors. The Ion Mass Analyzer and the Electron Spectrometer measure local ion and electron distribution functions, respectively, and the Neutral Particle Detector ( NPD) and the Neutral Particle Imager ( NPI ) detect energetic neutral atoms. The results presented here are restricted to neutral particle measurements performed with the NPD sensor. The NPD consists of two identical sensors, NPD1 and NPD2, that are sensitive to ENAs in the energy range from 0.1 to 10 keV using the time-of-flight (TOF) technique. Each NPD sensor has one start surface (where the start signal for the TOF measurement is created) and three stop surfaces (where each one provides the 248
ENERGETIC NEUTRAL ATOMS FROM HELIOSHEATH
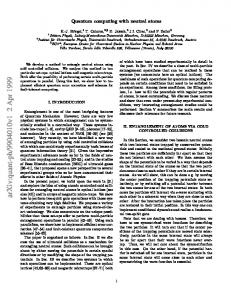
Fig. 1.— Pointing of the field of view of the six NPD channels on 2003 July 13 at 20:30:00 UT. The Mars Express spacecraft was on its cruise to Mars at that time. Mars was located at �22� longitude and �5� latitude during that time, at a distance of 6:389 ; 107 km.
stop signal for the TOF measurement and the angular channel). Each angular channel has an angular resolution of roughly 40� in azimuthal direction and 6� in elevation direction, the latter defined by the entrance system. Together, these six azimuth channels give an instantaneous field of view of NPD of 180� ; 6 � (see Fig. 1 for illustration of the field of view for a measurement during the cruise phase). The energy and the mass of an incident particle can be reconstructed from the TOF between start and stop surface and from the pulse height of the stop signal. In principle, this design enables us to distinguish oxygen from hydrogen ENAs. The charge exchange cross section for He is very low for our energy range (Gruntman et al. 2001), and the abundance of He is less than that of H in all space plasma environments by a factor of 10 or more. Thus, we can exclude the possibility that He ENAs are recorded by the NPD sensor.
249
From the recorded TOF spectra we can construct energy spectra of the ENAs since the NPD detection efficiency and the TOF resolution are known (Galli et al. 2006a; Galli 2008). An example for such an inversion is shown in Figure 2 for a measurement performed during the cruise phase. The top panel shows the original TOF data, the reconstructed TOF signal for the ENAs, and the background. The original TOF spectrum has some noise, but the signal-to-noise ratio is usually sufficient to construct an energy spectrum. There is a significant background resulting from solar Ly� photons backscattered by the interstellar gas and from stellar UV light. Fortunately, the UV background is understood very well (Galli et al. 2006b) and can be removed from the data with good confidence (see the dashed line in top panel of Fig. 2). The resulting energy spectrum of this measurement is shown in the bottom panel of Figure 2. At low ENA energies the NPD efficiency is low and the uncertainty of this number is high, which results in large error bars. Thus, only ENA data above 300 eV are useful for further analysis. We fit the energy spectrum by a twocomponent power law if the signal-to-noise ratio is high enough to derive an energy spectrum from the TOF spectrum. At lower ENA energies the spectrum is flatter than at higher energies, with a rollover between these two ranges below about 1 keV. In the energy spectrum shown in Figure 2, the fit gave E �2:26 and E �4:01 for the two ranges, with a rollover at 0.73 keV. ENA measurements with NPD have been performed during the cruise phase and during the Mars orbit phase. In Mars orbit, most of the observed ENA signals are a result of the interaction of the solar wind with the Martian atmosphere ( Futaana et al. 2006a, 2006b; Galli et al. 2006c, 2008b). The measurement of this signal is the prime scientific objective of the NPD sensor of the ASPERA instrument (Barabash et al. 2004). However, during favorable observation conditions, e.g., when NPD is pointing away from Mars, observation of an ENA signal not originating from
Fig. 2.— Top: TOF spectrum, averaged over 1259.1 s and recorded with channel 2 of NPD-2 of ASPERA-3 during 2007 July 13 in the cruise phase (see Fig. 1 for the observation geometry). Three traces are shown; one is the original data (thin line), one is the reconstructed signal (thick line), and the third is the UV background (dashed line). Bottom: Energy spectrum derived from the TOF spectrum above. Integral flux is [0:2 : : : 10 keV] ¼ [(1:8 ; 10 4 ) � (4:0 ; 103 )]/(cm3 sr s).
250
WURZ ET AL.
Vol. 683
Fig. 3.— Image of ENA intensities observed at the night side of Mars plotted in MSO longitude and latitude, using NPD measurements from 2004 April 27 to May 26 (from Galli et al. 2008b). Areas marked in white indicate that there are no measurements available, and black areas indicate that there are measurements but without an ENA signal above the detection threshold. The violet areas give the lowest intensities of (5 ; 10 3 )Y(2 ; 10 4 ) cm�2 s �1 sr�1. The red line denotes the Mars limb; the black cross is the Sun direction. The position of the planet center lies between �24� and �1� longitude, 30� and 48� latitude, and an altitude range is from 0.3 to 0.6 RP . This image includes 184 different measurement intervals from 2004 April 27 to May 26; the average field of view has a size of 60� ; 20� because of footpoint motion.
the Martian environment seemed justified (Galli et al. 2006a). Since then we have analyzed two years of ENA measurements recorded in Mars orbit. Figure 3 shows a typical map of these ENA emissions that has been compiled from a month of observations during 2004, with the spacecraft located at the night side, plotted in the Mars Solar Orbital (MSO) coordinate system1 (Galli et al. 2008b). The isolated signal around 135� MSO longitude and 45� MSO latitude was considered to be a good candidate for a non-Martian ENA signal in our earlier analysis. However, the large angular extent of the Martian ENA cloud reaching out to �150� MSO longitude means that the isolated ENA signal could be of Martian origin, since it is located at +135� MSO longitude. Note that the large angular spread of ENA signals in Figure 3 is partly a result of the large field of view and some cross talk between the three angular channels of NPD (Galli 2008). Observations like this made us conclude that the orbit of the Mars Express spacecraft is too close to the planet to consider an ENA signal not to be of Martian origin. Thus, we excluded most of the observations performed in Mars orbit from the present investigation of ENAs of interstellar origin. In the data selection process we dismissed all observations for which the field of view was directed into the Sun-ward hemisphere. We also dismissed all observations in Mars orbit, with the exception of the very first observations, which were obtained more than 10 Martian radii away from Mars. Observations made in the magnetosheath were dismissed as well because of a possible contamination with locally created ENAs. The remaining measurements of ENAs considered to be of interstellar origin are listed in Table 1. During operations very early in the mission (in the commissioning phase) the observed ENA signal was decreasing rapidly, on a timescale of 20 minutes, during a measurement, which we attribute to 1 Fig. 3 is shown in a cylindrical projection of the MSO reference frame, where the x-axis is the MSO longitude, and the y-axis is the MSO latitude in degrees. The MSO reference frame is defined as follows: X points from Mars to the Sun, Z points to the North pole of the Martian orbital plane. By this definition, the Sun direction is always at (0� , 0� ).
outgasing of the sensor and/or spacecraft. Mostly likely, water is the major outgasing species with a fraction of hydrocarbons (from cleaning solvents) when an instrument is warmed up in vacuum. Water contamination is known to increase the secondary electron emission (SEE) on particle impact. Since the detection of particles with NPD relies on SEE, both for the start and the stop measurement in the TOF section of NPD (Barabash et al. 2004), the water contamination will cause a temporary increase in the detection efficiency until the water escapes to space. Note that the highest ENA signals were observed during these times. Thus, we think that these measurements have to be treated with caution. Such a rapid signal decrease was not observed during later times of the mission. In the data analysis we checked carefully to exclude the following alternative signal sources or background sources as a possible source for the observed ENA signal. 1. There is no correlation of the ENA signal with nearby UV bright stars coming into the field of view of the NPD sensor. Moreover, the background spectra caused by UV photons are completely different from spectra of a particle signal (see Fig. 2, top). 2. There is no correlation with planets ( Earth, Mars, Jupiter), since measurements where a planet was in or near the field of view of the instrument were not considered in the analysis. 3. Neutralized ions of corotating interaction regions (CIR) can be ruled out as a source for these ENAs because the ion fluxes needed in the CIRs to account for the observed ENAs intensities are 3 orders of magnitude higher than the actual CIR fluxes. A solar-wind-related origin has been investigated, e.g., a correlation with Parker angle, and can be ruled out. Note that the flow direction of the ENAs in question is toward the Sun. During the re-evaluation of the NPD/ASPERA-3 data we very carefully investigated the possibility of these ENAs being created somewhere on the Mars Express spacecraft via scattering of solar wind ions from some mechanical structure, which renders them to a large fraction as ENAs. By carefully checking the design
No. 1, 2008
ENERGETIC NEUTRAL ATOMS FROM HELIOSHEATH
251
TABLE 1 Complete List of ENA Signals, Which are Considered to Be of Interstellar Origin
Date 2003 2003 2003 2003 2003 2003 2003 2003 2003 2003 2003 2003 2003 2003 2003 2003 2003 2003 2003 2003 2003 2003 2003 2003 2003 2003 2004 2004 2004 2004 2004 2004
Jul 6 ................. Jul 6 ................. Jul 7 ................. Jul 7 ................. Jul 8 ................. Jul 8 ................. Jul 9 ................. Jul 9 ................. Jul 10 ............... Jul 10 ............... Jul 11 ............... Jul 11 ............... Jul 12 ............... Jul 12 ............... Jul 13 ............... Jul 13 ............... Jul 13 ............... Jul 13 ............... Jul 25 ............... Jul 25 ............... Jul 25 ............... Jul 25 ............... Oct 14 .............. Oct 14 .............. Oct 14 .............. Oct 14 .............. Jan 5................. Jan 5................. Jan 5................. Jan 5................. Apr 9................ Apr 9................
Channel
Modea
k ecl (deg)
�ecl (deg)
0 2 0 2 0 2 0 2 0 2 0 2 0 2 0 2 0 2 0 2 0 2 0 2 0 2 0 2 0 2 0 2
Raw Raw Raw Raw Raw Raw Raw Raw Raw Raw Raw Raw TOF TOF Raw Raw TOF TOF Raw Raw TOF TOF Raw Raw TOF TOF Raw Raw TOF TOF TOF TOF
273 325 273 325 273 325 273 324 273 324 272 324 272 324 256 305 269 313 268 320 268 320 49 357 49 357 88 36 88 36 148 96
15 14 15 14 15 14 15 14 15 14 15 14 15 14 18 50 14 49 15 14 15 14 �15 �15 �15 �15 �15 �15 �15 �15 �15 �15
ENA Intensity (10 4 cm�2 sr�1 s�1)
Rollover ( keV )
Spectral Shapeb
Comments
� � � � � � � � � � � � � � � � � � � � � � � � � � � � � � � �
� 0.3 � 0.1 � 0.1 � 0.1 � 0.1 � 0.1 � 0.1 � 0.1 � 0.1 � 0.1 � 0.1 � 0.1 � 0.3 � 0.1 � 0.1 � 0.1 � 0.2 � 0.1 � 0.1 � 0.2 � 0.2 � 0.1 ... 1.0 � 0.1 0.4 � 0.2 0.8 � 0.1 0.5 � 0.1 1.5 � 0.8 ... 0.4 � 0.1 2.0 � 1.0 ...
2cpl 2cpl 2cpl 2cpl 2cpl 2cpl 2cpl 2cpl 2cpl 2cpl 2cpl 2cpl 2cpl 2cpl 2cpl 2cpl 2cpl 2cpl Peak 2cpl 2cpl 2cpl Ill 2cpl 2cpl 2cpl 2cpl 2cpl Ill 2cpl 2cpl Ill
Decreasing Decreasing Decreasing Decreasing Decreasing Decreasing ... ... ... ... ... ... ... ... ... ... ... ... ... ... ... ... ... ... ... ... ... Mars orbit Mars orbit Mars orbit Mars orbit Mars orbit
2.5 4.7 2.0 5.1 2.0 4.2 1.6 2.3 1.9 2.2 1.9 2.4 1.5 1.5 0.7 1.8 1.8 1.8 0.7 1.0 1.2 1.2 0.5 1.1 0.6 0.6 1.2 2.9 1.7 1.6 1.6 1.6
1.1 1.0 1.0 1.3 1.0 1.1 0.5 0.5 0.7 0.6 1.0 0.6 0.5 0.4 0.2 0.4 1.0 0.5 0.2 0.2 0.3 0.3 0.5 0.3 0.2 0.2 0.5 1.0 0.7 0.5 0.5 0.5
1.2 0.8 0.6 0.9 0.9 0.8 0.8 0.9 0.8 0.8 0.5 0.9 0.6 0.9 0.7 0.7 0.4 0.7 0.6 0.7 0.5 0.8
Notes.— Only data recorded with the NPD-2 sensor passed the various selection criteria. The pointing of the bore sight of the of the field of view in ecliptic coordinates is given by k ecl and �ecl for the longitude and latitude, respectively. a The NPD sensor can be operated in three sensor modes: raw, TOF, and Binned, of which the modes raw and TOF are useful for the present analysis. b If the energy spectrum can be fitted by a two-component power law the spectral shape is ‘‘2cpl’’; if such a fit is not possible then the spectral shape is ‘‘ill’’ defined. ‘‘ Peak’’ refers to a spectrum that cannot be fitted by a two-component power law, but whose shape is not ill defined.
drawings of Mars Express spacecraft with respect to the field of view of the NPD sensor it was concluded that the generation of observed ENAs on a spacecraft structure can be excluded (Galli 2008). The entire data set of NPD data was carefully searched and 32 energy spectra were identified, each of which satisfy the above criteria, that were attributed to energetic hydrogen atoms originating in the inner heliosheath. The typical flow direction of these ENA particles is toward the Sun. In short there are the following findings: 1. The total ENA intensities integrated over energy of these spectra are a bit variable (see Table 1). The measured values range from FENA ¼ 5 ; 10 3 cm�2 s�1 sr�1 to FENA ¼ 3 ; 10 4 cm�2 s�1 sr�1, with the former being the detection threshold. 2. The median ENA intensity over all 32 measurements is FENA ¼ (1:7 � 0:5) ; 10 4 cm�2 s�1 sr�1. When ignoring the first six measurements, the median ENA intensity is FENA ¼ (1:6 � 0:5) ; 10 4 cm�2 s�1 sr�1. 3. Heliospheric ENA intensities are observed for all ecliptic longitudes. Because of the poor sky coverage it is not meaningful to plot a map of the observed intensities. 4. All energy spectra of interstellar ENAs are very similar in shape and are best described by a two-component power law.
The average parameters for the spectra are a first slope with power of �2:4 � 0:2, a second slope of �3:8 � 0:2, and the rollover at E ¼ 0:78 � 0:1 keV. See bottom panel of Figure 2 for an example. 5. Data from the interplanetary cruise to Mars, during which most of these measurements were performed, show less scatter than data recorded in Mars orbit, the latter possibly resulting from contaminations by ENAs of the Martian origin. The total ENA intensities of the individual measurements we report here are about a factor 2 lower than in our earlier report (Galli et al. 2006a), because of the use of the final NPD calibration data (Grigoriev 2007). The mean ENA intensity over all measurements also dropped by this factor of 2. Moreover, the fluctuation between the individual ENA measurements is small, with these ENA signals being typically 1:5 ; 10 4 cm�2 s�1 sr�1 within a factor of 2. This fluctuation is much smaller than in our earlier report and is caused by excluding most of the data recorded in Mars orbit, which are probably contaminated by Martian ENAs. Hydrogen atoms arriving at Mars orbit from the heliosheath have travel times ranging from 0.3 to 2.4 yr for the energy range covered by the NPD measurements. For the rollover energy of 780 eV the travel time is about 1.1 yr. Thus, most of the temporal variations in the ENA intensity at the termination shock will smear out by the time they arrive at Mars orbit, and the similarity of the
252
WURZ ET AL.
Vol. 683
Fig. 4.— Calculated ENA-H energy spectra together with the measurements from NPD (from Fig. 2), from IMAGE HENA (E. Roelof 2005, private communication; Kallenbach et al. 2005), and from SOHO CELIAS (Hilchenbach et al. 1998). The dashed line and the dash-dotted line (‘‘ENA [Strong TS]’’ and ‘‘ENA [ Weak TS]’’) are from McComas et al. (2004) for a strong and a weak TS, respectively, the dotted lines (‘‘MHD model [nose]’’ and ‘‘MHD model [tail]’’) are data from a self-consistent axisymmetric MHD plasma / kinetic-neutral model ( Heerikhuisen et al. 2007), the short-dashed line (‘‘ENA Flux [Shocked SW]’’) shows data from Fahr & Scherer (2004), and the long-dashed curves (‘‘ENA flux [ Pickup protons]’’) show cases from the calculation by Chalov et al. (2003). The HST measurements are indicated by the dotted line that represents an upper limit for the ENA fluxes derived from the observations by Wood et al. (2007).
observed energy spectra is not surprising. The variations in ENA intensity we observe are explained by the different observation directions and by loss of incoming ENAs due to charge exchange with solar wind protons and photoionization. Given the 1/r 2 radial falloff for both processes, the loss of ENAs is very localized, e.g., within a few AU of Mars. For ENAs traveling from the termination shock region into the inner heliosphere, about 80% of the reach Mars orbit and about 60% reach Venus orbit under regular solar wind conditions. However, a coronal mass ejection with a plasma density increased by a factor of 10 will cause a total extinction of the ENA signal. Given the frequency and spatial extent of CMEs ( Yashiro et al. 2004; Riley et al. 2006), we have to assume that heliosheath ENA observations are affected on a regular basis, i.e., the partial or total signal extinction on short timescales compared to the travel time of these ENAs. 3. NPD/ASPERA-4 OBSERVATIONS Unfortunately, the accommodation of the ASPERA-4 instrument on the Venus Express spacecraft is such that the solar panels occa-
sionally appear in the field of view of the NPD sensor (Barabash et al. 2007). Solar wind ions (mostly protons) impinging on these solar panels will neutralize and produce an ENA foreground that masks other ENA signals if the solar panels are inside or near the field of view of NPD. This problem has to be carefully considered in the data analysis and can be handled well, as was demonstrated for the analysis of the ENA signal arising from the interaction of the solar wind with the Venus atmosphere (Galli et al. 2008a). However, for the present analysis this problem results in the exclusion of many data sets because of possible contamination (Galli 2008). During the first half year of ASPERA-4 operations, 2006 JanuaryYJune, a total of 20 suitable observations have been made that meet the same selection criteria as for the Mars Express NPD measurements, with the additional criterion of the solar arrays being out of the NPD field of view. In only 3 out of 20 cases a distinct peak in the TOF spectrum shows up that corresponds, according to the final calibration (Grigoriev 2007), to an ENA intensity of (1Y2) ; 10 4 cm�2 sr�1 s�1. The sky coverage of these
No. 1, 2008
ENERGETIC NEUTRAL ATOMS FROM HELIOSHEATH
253
20 observations is quite well distributed, but the statistical coverage is too poor to draw a meaningful map. After all, to observe a true nonplanetary ENA signal with Venus Express NPD is the exception, not the rule. In part the low number of nonplanetary ENA detections compared to the Mars Express NPD observations (Table 1) can be ascribed to the detection threshold, which is twice as high for Venus Express NPD than it was for Mars Express NPD (Grigoriev 2007; Galli 2008). Moreover, only few cruise phase observations were possible for Venus Express NPD, due to spacecraft operational constraints. In summary, we can only give an upper limit for the ENA intensity of a few 104 cm�2 sr�1 s�1 for the nonplanetary ENA signals observed with ASPERA-4. The low number of ENA detections (3 out of 20) implies that the nonplanetary ENA signal seen in 2003 with Mars Express NPD has become weaker by a factor of about 2 in comparison to the signal seen in 2006 by Venus Express NPD. Photoionization and charge exchange account for a reduction of the ENA intensity by 20% only when traveling from 1.5 to 0.7 AU (based on Gruntman et al. 2001). 4. DISCUSSION As discussed before (Galli et al. 2006a; Wurz et al. 2006), we interpret the nonplanetary ENA measurements reported above as energetic hydrogen atoms arriving from the region of the inner heliosheath. In addition to the NPD measurements there are two more data sets available, one from the HENA instrument on IMAGE (E. Roelof 2005, private communication; Kallenbach et al. 2005) and one from the HSTOF sensor of the CELIAS instrument on SOHO (Hilchenbach et al. 1998). These measurements are shown in Figure 4 for the apex direction of the LIC flow. The NPD data points are from the cruise phase from 2003 July 13 (see Fig. 2). The reported HENA data are only upper limits (E. Roelof 2005, private communication). HSTOF data sets for several ecliptic longitudes exist (Hilchenbach et al. 1998). For the latter data set an enhancement by a factor of 2 in the tailward direction of the LIC has been reported. Most of what we know from the region beyond the termination shock is the result of detailed model calculations. These calculations not only predict the shape and the physical parameters in the four regimes of the heliospheric interface, they also predict energy spectra of ENAs produced in that region and traveling inward to Earth orbit. Several calculated ENA energy spectra for an observer at Earth orbit are reproduced in Figure 4 (Chalov et al. 2003; Fahr & Scherer 2004; McComas et al. 2004; Heerikhuisen et al. 2007), together with the ENA measurements from Figure 2. There is a large range in the predictions of ENA intensity by the various models, as can be seen in Figure 4. Moreover, most of these model calculations, with one exception, considerably underestimate the ENA intensity arriving from the heliosheath when compared to the NPD, HENA, and HSTOF measurements. Note that most of the NPD measurements are concerned with ENA emission from the Martian environment, where the measured ENA intensities and spatial distributions agree within a factor of 2 with model predictions (Galli et al. 2008b). The heliospheric ENA intensities we reported earlier (Galli et al. 2006a) have been compared with optical measurements of hydrogen densities from the heliosphere (Wood et al. 2007). The authors studied Ly� line profiles of nearby stars with the HST. The Ly� line profiles show absorption features at the red wing caused by heliospheric hydrogen. These absorptions are in the velocity range of 50Y200 km s�1 corresponding to kinetic energies of 13Y207 eV of the hydrogen atoms. Since the energy range of our reliable ENA measurements ends at 300 eV we cannot directly compare them with the optical measurements (see Fig. 5). How-
Fig. 5.— Measurements of ENA-H energy spectra from NPD (from Fig. 2), from IMAGE HENA (E. Roelof 2005, private communication; Kallenbach et al 2005), and from SOHO CELIAS (Hilchenbach et al. 1998). The energy ranges of the existing and future instruments are indicated by gray shading. The two solid lines represent power laws of E�1:5 and E�4 to guide the eye. [See the electronic edition of the Journal for a color version of this figure.]
ever, to compare our ENA measurements with Ly� absorption features Wood et al. (2007) extrapolated the measured ENA energy spectrum from 300 eV to energies as low as 10 eV where no ENA measurements are available. The authors set up a matrix of 3 by 4 cases for their extrapolations; the three cases concerning the slope of the spectrum being a continuation of the measured spectral slope, a flat spectrum, and a negative slope of the ENA spectrum at lower energies, and the four cases being variations in ENA intensity consistent with the uncertainty of the earlier measurement by Galli et al. (2006a). Based on their extrapolations Wood et al. (2007) concluded that ‘‘the observed ENA fluxes likely predict too much heliosheath Ly� absorption in downwind directions to be consistent with the HST Ly� spectra. This represents a strong argument against a heliosheath origin for these ENAs, instead suggesting a local interplanetary source.’’ Actually, of the 12 cases Wood et al. (2007) studied (varying the intensity in a certain range, and using different spectral extrapolations) 8 cases did not show too much absorption at all. These two points make it difficult for us to comprehend their conclusion that our ENA intensities ‘‘are probably too high to be consistent with the relative lack of heliosheath absorption seen by HST’’ and we maintain our original conclusion that the observed ENA intensities originate in the inner heliosheath. After applying the final NPD calibration our ENA intensities are about a factor of 2 lower than in our earlier report (Galli et al. 2006a), reducing the postulated disagreement even more. However, we can use the calculations by Wood et al. (2007) to derive an upper limit on the ENA intensities at low energy, which we also plotted in Figure 4 and Figure 5. This upper limit is in agreement with all the model calculations. Taking all experimental data together, a simple energy spectrum of the heliospheric ENAs emerges that is composed of the power laws with spectral
254
WURZ ET AL.
indices of �1.5 and �4, for the lower and higher energies, respectively, and a rollover around 1 keV (as shown in Fig. 5). However, the actual shape of the ENA energy spectrum below 300 eV is not known at present, since the HST measurements give only an upper limit. This part of the ENA spectrum will be measured by the IBEX mission (McComas et al. 2004), which is scheduled for launch in summer 2008. The two energy ranges of the two IBEX ENA sensors, IBEX-Lo and IBEX-Hi, are shown in Figure 5. In particular the IBEX-Lo sensor will record ENAs down to 10 eV. In addition, IBEX will provide full sky maps for 14 energy ranges from 10 eV up to 6 keV. This will be a major step forward in studying the heliospheric interface. 5. CONCLUSIONS In this paper we reported the measurement of ENAs that most plausibly originate in the inner heliosheath and propagate into the inner heliosphere to the terrestrial planets. The energy spectra of these heliospheric ENAs are all very similar, and are well described by a two-component power law with a mean rollover at 780 eV. Extrapolating these energy spectra to higher energies results in a good agreement with IMAGE HENA and CELIAS / HSTOF data. The comparison of our ENA measurements with
theoretical models show that the intensities predicted by most of these models typically are between 1 and 2 orders of magnitude lower than the measured ENA intensities. We disagree with the conclusions derived by Wood et al. (2007) that the ENA signal we observe is in conflict with their HST measurements and thus the ENA signal cannot be from an interstellar source. Wood et al. (2007) based their conclusions on an extrapolation of our spectra to the energy range of Ly� measurements by HST. There is no overlap of the energy ranges (see Fig. 5). Moreover, in 8 of the 12 cases of the extrapolated energy spectra studied by Wood et al. (2007) no conflict with HST data was found. Thus, the conclusions derived by Wood et al. (2007) regarding the ASPERA observations are not valid.
The ASPERA-3 experiment on the European Space Agency ( ESA) Mars Express mission is a joint effort between 15 laboratories in 10 countries, all sponsored by their national agencies. We thank all these agencies as well as the various departments / institutes hosting these efforts. This work is supported by the Swiss National Science Foundation.
REFERENCES Barabash, S., et al. 2004, in Mars Express: The Scientific Payload, ed. Hsieh, H. S., Shih, K. L., Jokipii, J. R., & Gruntman, M. A. 1992, in Proc. Solar A. Wilson ( ESA-SP 1240; Noordwijk: Netherlands), 121 Wind Seven, 3rd COSPAR Colloq., Sensing the Solar-wind Termination ———. 2007, Planet. Space Sci., 55, 1772 Shock from Earth’s Orbit, ed. E. Marsch & R. Schwenn (Oxford: Pergamon), Burlaga, L. F., Ness, N. F., Acun˜a, M. H., Lepping, R. P., Connerney, J. E. P., 365 Stone, E. C., & McDonald, F. B. 2005, Science, 309, 2027 Kallenbach, R., Hilchenbach, M., Chalov, S. V., Le Roux, J. A., & Bamert, K. Chalov, S. V., Fahr, H. J., & Izmodenov, V. V. 2003, J. Geophys. Res., 108, 2005, A&A, 439, 1 1266, DOI: 10.1029/2002JA009492 McComas, D., et al. 2004, in AIP Conf. Proc. 719, Physics of the Outer Decker, R. B., Krimigis, S. M., Roelof, E. C., Hill, M. E., Armstrong, T. P., Heliosphere, ed. V. Florinski, N. V. Pogorelov, & G. P. Zank ( Melville: AIP), Gloeckler, G., Hamilton, D. C., & Lanzerotti, L. J. 2005, Science, 309, 2020 162 Fahr, H.-J., & Scherer, K. 2004, Ap&SS Trans., 1, 3 Mo¨bius, E., Bzowski, M., Mu¨ller, H.-R., & Wurz, P. 2006, in Solar Journey: Futaana, Y., et al. 2006a, Icarus, 182, 413 The Significance of our Galactic Environment for the Heliosphere and Earth, ———. 2006b, Icarus, 182, 424 ed. P. C. Frisch ( Dordrecht: Springer), 209 Galli, A. 2008, Ph.D. thesis, Univ. Bern Riley, P., Schatzman, C., Cane, H. V., Richardson, I. G., & Gopalswamy, N. Galli, A., Wurz, P., Barabash, S., Grigoriev, A., Gunell, H., Lundin, R., 2006, ApJ, 647, 648 Holmstro¨m, M., & Fedorov, A. 2006c, Space Sci. Rev., 126, 267 Stone, E. C., Cummings, A. C., McDonald, F. B., Heikkila, B. C., Lal, N., & Galli, A., et al. 2006a, ApJ, 644, 1317 Webber, W. R. 2005, Science, 309, 2017 ———. 2006b, Space Sci. Rev., 126, 447 Wood, B. E., Izmodenov, V. V., Linsky, J. L., & Y. G. Malama 2007, ApJ, 657, ———. 2008a, J. Geophys. Res., submitted 609 ———. 2008b, J. Geophys. Res., submitted Wurz, P. 2000, in The Outer Heliosphere: Beyond the Planets, ed. K. Scherer, Grigoriev, A. 2007, Ph.D. thesis, Swedish Institute of Space Physics H. Fichtner, & E. Marsch ( Katlenburg-Lindau: Copernicus Gesellschaft), 251 Gruntman, M., Roelof, E. C., Mitchell, D. G., Fahr, H. J., Funsten, H. O., & Wurz, P., Scheer, J., & Wieser, M. 2006, Surface Sci. Nanotech., 4, 394 McComas, D. J. 2001, J. Geophys. Res., 106, 15767 Yashiro, S., Gopalswamy, N., Michalek, G., St. Cyr, O. C., Plunkett, S. P., Rich, Heerikhuisen, J., Pogorelov, N. V., Zank, G. P., & Florinski, V. 2007, ApJ, 655, N. B., & Howard, R. A. 2004, J. Geophys. Res. Space Phys., 109, A07105, L53 DOI: 10.1029/2003JA010282 Hilchenbach, M., et al. 1998, ApJ, 503, 916