Energetic Particle Data from the Global Positioning System Constellation S. K. Morley, J. P. Sullivan, M. R. Carver, R. M. Kippen, R. H. W. Friedel, G. D. Reeves and M. G. Henderson
Steven Morley,
[email protected] 1
Los Alamos National Laboratory, Los
Alamos, New Mexico, USA
This article has been accepted for publication and undergone full peer review but has not been through the copyediting, typesetting, pagination and proofreading process, which may lead to differences between this version and the Version of Record. Please cite this article as doi: 10.1002/2017SW001604
c
2016 American Geophysical Union. All Rights Reserved.
Abstract.
Since 2000, Los Alamos National Laboratory (LANL) Com-
bined X-ray and Dosimeter (CXD) and Burst Detector Dosimeter for Block II-R (BDD-IIR) instruments have been fielded on Global Positioning System (GPS) satellites. Today, 21 of the 31 operational GPS satellites are equipped with a CXD detector and a further 2 carry a BDD-IIR. Each of these instruments measures a wide range of energetic electrons and protons. These data have now been publicly released under the terms of the Executive Order for Coordinating Efforts to Prepare the Nation for Space Weather Events. The specific goal of releasing space-weather data from the GPS satellites is to enable broad scientific community engagement in enhancing space weather model validation and improvements in space weather forecasting and situational awareness. The time period covered by this data release is approximately 16 years, which corresponds to more than 167 satellite-years of data. The large number of GPS satellites, distributed over 6 orbital planes, will provide important context for ongoing and historical science missions, as well as enabling new types of research not previously possible. Keypoints: • The 23 instrumented GPS satellites provide capable multi-point measurements of energetic electrons and protons • A recent data release has made >167 satellite-years of GPS particle data publicly available • GPS energetic particle data support current capability and open avenues for new research
c
2016 American Geophysical Union. All Rights Reserved.
1. Introduction The Global Positioning System (GPS) is well-known worldwide and is used daily by a large number of people, businesses and government agencies. Though its primary use is as one of several Global Navigation Satellite Systems (GNSS) [Parkinson and Gilbert, 1983], GPS position, navigation and timing services have also been used for many years in a range of sciences, from tracking the movement of Earth’s crust [Hammond and Thatcher , 2004] to tracking animals across the globe [Cagnacci et al., 2010]. GPS has far more to offer than just location and timing services, however. The best known use of GPS in space physics is, perhaps, to measure total electron content (TEC) [e.g. Yizengaw et al., 2006; Cherniak et al., 2015]. Although it is less well-known, many of the GPS satellites carry instruments to measure the space environment directly. On 29 October 2015, the White House Office of Science and Technology Policy (OSTP) released the National Space Weather Strategy and National Space Weather Action Plan [see Lanzerotti , 2015; Jonas and McCarron, 2016]. Alongside these key documents, OSTP also released a fact sheet [OSTP , 2015] providing additional information, detailing new actions to be taken by federal agencies including releasing, and making available via data.gov, space environment data from the United States Air Force’s Global Positioning System (GPS) satellites. As a result of this effort, four weeks of GPS energetic particle data from Los Alamos sensors were publicly released at the end of January 2016, hosted by the National Oceanic and Atmospheric Administration (NOAA) and indexed at data.gov. This was reported on by Knipp and Giles [2016], who noted some of the potential of publicly available GPS data, saying “now is the time for a new data revolution that
c
2016 American Geophysical Union. All Rights Reserved.
makes months, if not years, of historical GPS space environment data available to those who support the nation’s space industry”. This new space weather data revolution came one step closer on 13 October 2016, as the White House issued an Executive Order “Coordinating Efforts to Prepare the Nation for Space Weather Events” [Executive Order 13744 , 2016]. Under the terms of this order, 16 years of LANL-GPS energetic particle data products, covering the period from December 2000 to December 2016, have now been publicly released. As before, the data are archived by NOAA’s National Centers for Environmental Information (NCEI) and can be found through the data.gov service by searching for “GPS energetic particle data”. In this article we give an overview of the data set that has been released, within the context of some previous work, and comment on the areas of new research enabled by the LANL-GPS data release.
2. An Overview of the Released Data Currently there are more than 30 operational GPS satellites in medium-Earth orbit (MEO), distributed across 6 orbital planes, each orbiting the Earth in 12 hours at a nominal altitude of ∼20200 km. Although the orbit is near-circular it has a nominal inclination of 55◦ [see, e.g., Figure 2 of Morley et al., 2016], so the magnetic latitude changes along the orbit and each satellite samples magnetic field lines mapping to a wide range of McIlwain L [McIlwain, 1961]. Every half-orbit, the satellite moves from low L to high L and back again, covering the full range of sampled L values four times per orbit. Twenty-three of these satellites carry energetic particle detectors designed and built at Los Alamos National Laboratory; the data from these instruments are now publicly available for the first time. c
2016 American Geophysical Union. All Rights Reserved.
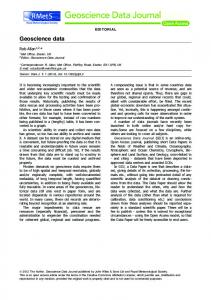
Figure 1 shows the temporal coverage of the publicly released data, which consists of data from both the Combined X-ray and Dosimeter (CXD) and Burst Detector Dosimeter for Block II-R (BDD-IIR) instruments. The data coverage for each satellite is indicated by the colored horizontal bars. The CXD-equipped GPS satellites are marked by the red bars and the satellites carrying BDD-IIR are marked with green bars. We also include the Van Allen Probes scientific mission (2012-) for context. The daily sunspot number is also shown for context and is given by the dark grey line. We show the recently recalibrated version of the sunspot number [cf. Clette et al., 2016] smoothed using a 27 day median filter. From 10 December 2000 through 31 December 2016, the temporal coverage amounts to over 142 satellite-years of CXD data and more than 24 satellite-years of BDD-IIR data. In total, over 167 satellite-years of energetic particle data have just been publicly released. These data products are provided at 4 minute cadence and consist of differential omnidirectional fluxes, along with selected ephemeris data, count rates and geomagnetic parameters computed from established magnetic field models. Table 1 provides selected details of these GPS satellites; we have updated the information given by [Morley et al., 2016] to include the most recent launches, as well as the satellites carrying BDD-IIR instruments. The data files are provided as a self-describing ASCII format, where the metadata are provided in a header using JavaScript Object Notation (JSON); these JSON-headed ASCII files were used for the previous release, as well as other public data sets, including the Van Allen Probes magnetic ephemeris data [Spence et al., 2013]. This format is supported by both the Autoplot visualization package [Faden et al., 2010], as well as the SpacePy
c
2016 American Geophysical Union. All Rights Reserved.
software library [Morley et al., 2011]. It has the benefits of a human-readable text file with a human- and machine-readable header for description and automated parsing of the data file. 2.1. Electron Data Electron measurements from the LANL-CXD instruments have recently been crosscalibrated against data from the Van Allen Probes [Morley et al., 2016]. Although the BDD-IIR instruments have not yet undergone the same detailed comparison to a scientific mission like Van Allen Probes, this work is planned. A description of the CXD instrument can be found in Tuszewski et al. [2004]; the BDD-IIR instrument has been described by Cayton et al. [1998]. The CXD instrument measures electrons from 120 keV up to energies greater than 5 MeV with 11 channels, while BDD-IIR measures electrons from 77 keV to greater than 5 MeV with 8 channels. Figure 2 shows electron flux data from February 2001 to December 2016 at three different energies (300 keV; 1 MeV; 2 MeV). The data presented are binned averages of the flux, where the bins are 8 hours in time and 1/4 in McIlwain L (LM , calculated for locallymirroring particles)[McIlwain, 1961]. At the start of this interval the data comes from just one satellite (ns54), but by February 2016 all 21 CXD-equipped satellites are included. While figure 2 presents 8 hour binned averages, we note that this is in no way necessary for recent intervals where many satellites are available. Indeed, using just 7 GPS satellites [Morley et al., 2010a] showed the variation of the electron radiation belt at a resolution of 1/5 in LM and 1 hour in time with very few gaps in coverage. Using 19 satellites, Morley et al. [2016] showed the dynamics of the radiation belt during the “St. Patrick’s Day” storm of 2015 with a resolution of 1/3 in LM and only 20 minutes in time. The excepc
2016 American Geophysical Union. All Rights Reserved.
tional data density that allows us to map the outer electron radiation belt at such short time scales provides a unique context for the high-quality measurements from Van Allen Probes and other missions. It also enables new discoveries by resolving the timescales of rapid enhancements and losses in the radiation belts, as well as potentially resolving how changes in flux occur with local time, in both radiation belt and substorm populations. A detailed study of the long-term variations in flux across the GPS orbit is beyond the scope of this article, but several features can be immediately noted from Figure 2. First, the deep solar minimum of 2009-2010 is extremely clear, including some brief radiation belt enhancements [see, e.g. Baker and Blake, 2013; Rodger et al., 2016]. Second, the interval after the deep solar minimum marks a recovery of radiation belt electron fluxes, but the overall flux level is depressed by comparison with the period 2001-2008. If we assume this as being “typical” radiation belt behavior, then a return to typical behavior was not seen until 2015, thus we could characterize the first 2.5 years of the Van Allen Probes mission as being during an unusually quiet period. Third, though the electron fluxes show broadly similar dynamics from 100s of keV to several MeV, there are energyand L-dependent differences. One such difference that we draw attention to here is the pronounced inner edge of the electron radiation belt seen at 300 keV; the fluxes at all energies decrease with LM , but for lower energies also drop at low L (4.LM .5). The prominence of this feature changes with energy and appears to be absent at 2 MeV. This is consistent with the recent work of Reeves et al. [2016], who used Van Allen Probes to explore the energy-dependent dynamics of the outer zone during 2013. This feature is perhaps most clearly seen since 2009, but appears to be present across the whole GPS dataset.
c
2016 American Geophysical Union. All Rights Reserved.
Though the LANL-GPS electron data have not been widely available until now, electron data from GPS have previously been used by several authors [see Friedel et al., 2005; Morley et al., 2016, for further details]. These data have been used to examine substorm injections [Lugo-Solis et al., 2005], radiation belt dropouts [Morley et al., 2010a, b; Yu et al., 2013], magnetotail plasma properties [Borovsky and Cayton, 2011; Denton and Cayton, 2011] and for data-assimilative modeling of the radiation belts [Bourdarie et al., 2005; Reeves et al., 2012]. These topics show the broad range of potential applications for the newly available energetic electron data. 2.2. Proton Data The CXD instrument measures protons from 6 MeV up to energies greater than 75 MeV with 5 channels, while BDD-IIR measures protons from 1.3 MeV to greater than 54 MeV with 8 channels. One of the key space weather events that these instruments measure is solar energetic particle (SEP) events [e.g. Reames, 2013]. Though the GPS proton data have rarely appeared in the literature, preliminary work showed their promise as a multi-point data set for the measurement of SEPs and understanding the penetration of SEPs in the magnetosphere [Cayton et al., 2007]. To briefly illustrate this here we present combined proton measurements from a number of CXD-equipped satellites. Figure 3a shows integral proton fluxes at >10 MeV and >30 MeV from LANL-CXD detectors on GPS (solid lines) and from the NOAA-GOES satellite (dashed lines). The presented CXD fluxes are calculated at hourly cadence by averaging the integral flux measured at each GPS satellite that is at LM ≥ 11 within that time bin. The >30 MeV integral flux from GOES has been reduced by a factor of 1.7 for this comparison, following the findings of Rodriguez et al. [2016]. Similar to many other instruments, the GPS proton c
2016 American Geophysical Union. All Rights Reserved.
detectors have a measurable background, which has not been removed from the proton flux in the present release. The current functional form used to calculate the energy spectrum includes a background term, and this has been omitted when calculating the fluxes displayed in this figure. The procedure for calculating the proton flux measured by the CXD instrument is currently being reviewed – including the background subtraction – and a comprehensive cross-calibration of these data is underway. Though this comparison is qualitative, it shows that the GPS satellites provide a useful measurement of the proton flux. For comparison with the NOAA GOES data we selected GPS proton data only when the satellites were at high L, and therefore minimally shielded by the geomagnetic field [e.g. Smart and Shea, 1994]. The large number of instrumented satellites in the GPS constellation allows simultaneous determination of the proton flux at a wide range of magnetic local times and McIlwain L. In turn this provides a direct test of the variation in geomagnetic cutoffs, which are known to vary with geomagnetic activity [see, e.g., Kress et al., 2004]. To demonstrate the geomagnetic shielding effect at a given time, we display the proton count rates, combined across all satellites, as a function of both time and LM . This is shown in figure 3b for the P1 channel (nominally >6 MeV), where the data are combined in bins of 2 hours in time and 1/3 in L. The proton count rates for 3 of the CXD channels (P1, P3 and P5) are shown for 21 UT on 7 December 2006, corresponding to a vertical slice in figure 3b near the peak of the first SEP, in figure 3c. The availability of these proton data enables new, multipoint studies of solar energetic particles, geomagnetic shielding, and cosmic rays.
c
2016 American Geophysical Union. All Rights Reserved.
3. Summary Twenty-three of the operational Global Positioning System satellites carry Los Alamos National Laboratory energetic particle sensors. Following Executive Order 13744, of 13 October 2016, the energetic particle data from GPS have been made publicly available. The data have been archived by NOAA NCEI and can be found by searching the data.gov portal. This article has given an overview of the 16 years (>167 satellite-years) of GPS data that have been released. The CXD electron fluxes, which have previously been shown to be of high-quality [Morley et al., 2016], clearly show the dynamics of the outer electron radiation belt during this time, and are consistent with previous work [e.g. Baker and Blake, 2013; Rodger et al., 2016; Reeves et al., 2016]. The LANL-GPS data allow mapping of the outer electron radiation belt with unprecedented data density [see, e.g., Morley et al., 2016], but enable a wealth of other studies. These measurements provide a new data set to test model predictions at MEO, as well as for enhancement of statistical and climatological models like AE9/AP9/SPM [Ginet et al., 2013]. Energetic proton data are also provided in the data release, and we have illustrated the utility of these measurements using CXD proton fluxes during a solar energetic particle event. These data have been shown to be qualitatively similar to the GOES proton data; the fitting procedure is currently being revised and a detailed cross-calibration is underway. New versions of the public data files with improved proton fluxes will be made available when this activity is complete. It is our hope that the scientific community shares the optimism of Knipp and Giles [2016] that this data set might represent the next space weather data revolution, and that
c
2016 American Geophysical Union. All Rights Reserved.
many new discoveries are made possible through the public release of the LANL-GPS data. Acknowledgments. We gratefully acknowledge the CXD team at Los Alamos National Laboratory, which designed and built the CXD and BDD-IIR instruments discussed in this article over the course of the past >20 years. This work was performed under the auspices of the US Department of Energy. SKM was funded by the Laboratory Directed Research and Development (LDRD) program, project 20150127ER. Analysis and plotting used the publicly available ROOT, LANLGeoMag and SpacePy libraries. SpacePy is available from http://sourceforge.net/p/spacepy and AutoPlot is available from http://autoplot.org. Sunspot data are from the World Data Center (WDCSILSO), Royal Observatory of Belgium, Brussels (http://www.sidc.be/silso/datafiles). Orbital elements for GPS were obtained from http://www.Space-Track.org.
The
LANL-GPS particle data are publicly available, hosted by NOAA NCEI, and can be found through the data.gov website, or directly at http://www.ngdc.noaa.gov/stp/spaceweather/satellite-data/satellite-systems/gps/. GOES integral proton fluxes were obtained from http://omniweb.gsfc.nasa.gov.
References Baker, D. N., and J. B. Blake (2013), SAMPEX: A Long-Serving Radiation Belt Sentinel, pp. 21–40, American Geophysical Union, doi:10.1029/2012GM001368. Borovsky, J. E., and T. E. Cayton (2011), Entropy mapping of the outer electron radiation belt between the magnetotail and geosynchronous orbit, Journal of Geophysical Research: Space Physics, 116 (A6), n/a–n/a, doi:10.1029/2011JA016470, a06216. c
2016 American Geophysical Union. All Rights Reserved.
Bourdarie, S., R. H. W. Friedel, J. Fennell, S. Kanekal, and T. E. Cayton (2005), Radiation belt representation of the energetic electron environment: Model and data synthesis using the Salammbˆo radiation belt transport code and Los Alamos geosynchronous and GPS energetic particle data, Space Weather, 3 (4), doi:10.1029/2004SW000065, s04S01. Cagnacci, F., L. Boitani, R. A. Powell, and M. S. Boyce (2010), Animal ecology meets gps-based radiotelemetry: a perfect storm of opportunities and challenges, Philosophical Transactions of the Royal Society of London B: Biological Sciences, 365 (1550), 2157– 2162, doi:10.1098/rstb.2010.0107. Cayton, T. E., D. M. Drake, K. M. Spencer, M. Herrin, T. J. Wehner, and R. C. Reedy (1998), Description of the BDD–IIR: Electron and proton sensors on the GPS, Tech. Rep. LA-UR-98-1162, Los Alamos National Laboratory, Los Alamos, NM 87545, USA, doi:10.2172/674727. Cayton, T. E., R. H. Friedel, A. Varotsou, J. P. Sullivan, and S. Young (2007), Multisatellite SEP observations by the GPS energetic particle detector constellation, AGU Fall Meeting Abstracts. Cherniak, I., I. Zakharenkova, and R. J. Redmon (2015), Dynamics of the high-latitude ionospheric irregularities during the 17 March 2015 St. Patrick’s Day storm: Groundbased GPS measurements, Space Weather, 13 (9), 585–597, doi:10.1002/2015SW001237, 2015SW001237. Clette, F., E. W. Cliver, L. Lef`evre, L. Svalgaard, J. M. Vaquero, and J. W. Leibacher (2016), Preface to topical issue: Recalibration of the sunspot number, Solar Physics, 291 (9), 2479–2486, doi:10.1007/s11207-016-1017-8.
c
2016 American Geophysical Union. All Rights Reserved.
Denton, M. H., and T. E. Cayton (2011), Density and temperature of energetic electrons in the Earth’s magnetotail derived from high-latitude GPS observations during the declining phase of the solar cycle, Annales Geophysicae, 29 (10), 1755–1763, doi: 10.5194/angeo-29-1755-2011. Executive Order 13744 (2016), Executive Order – Coordinating Efforts to Prepare the Nation for Space Weather Events, 81 Federal Register, pp. 71573–71577. Faden, J. B., R. S. Weigel, J. Merka, and R. H. W. Friedel (2010), Autoplot: a browser for scientific data on the web, Earth Science Informatics, 3 (1), 41–49, doi:10.1007/s12145010-0049-0. Friedel, R. H. W., S. Bourdarie, and T. E. Cayton (2005), Intercalibration of magnetospheric energetic electron data, Space Weather, 3 (9), doi:10.1029/2005SW000153, s09B04. Ginet, G. P., T. P. O’Brien, S. L. Huston, W. R. Johnston, T. B. Guild, R. Friedel, C. D. Lindstrom, C. J. Roth, P. Whelan, R. A. Quinn, D. Madden, S. Morley, and Y.-J. Su (2013), AE9, AP9 and SPM: New Models for Specifying the Trapped Energetic Particle and Space Plasma Environment, Space Sci. Rev., 179, 579–615, doi:10.1007/s11214013-9964-y. Hammond, W. C., and W. Thatcher (2004), Contemporary tectonic deformation of the basin and range province, western united states: 10 years of observation with the global positioning system, Journal of Geophysical Research: Solid Earth, 109 (B8), n/a–n/a, doi:10.1029/2003JB002746, b08403. Jonas, S., and E. D. McCarron (2016), White house releases national space weather strategy and action plan, Space Weather, 14 (2), 54–55, doi:10.1002/2015SW001357,
c
2016 American Geophysical Union. All Rights Reserved.
2015SW001357. Knipp, D. J., and B. L. Giles (2016), Global Positioning System Energetic Particle Data: The Next Space Weather Data Revolution, Space Weather, 14 (8), 526–527, doi: 10.1002/2016SW001483, 2016SW001483. Kress, B. T., M. K. Hudson, K. L. Perry, and P. L. Slocum (2004), Dynamic modeling of geomagnetic cutoff for the 23-24 November 2001 solar energetic particle event, Geophysical Research Letters, 31 (4), doi:10.1029/2003GL018599, l04808. Lanzerotti, L. J. (2015), Space Weather Strategy and Action Plan: The National Program Is Rolled Out, Space Weather, 13 (12), 824–825, doi:10.1002/2015SW001334, 2015SW001334. Lugo-Solis, A., R. Lopez, J. Ingraham, and R. Friedel (2005), Energetic electron bursts at high magnetic latitudes: Correlation with magnetospheric activity, Advances in Space Research, 36 (10), 1840 – 1844, doi:http://dx.doi.org/10.1016/j.asr.2005.07.062. McIlwain, C. E. (1961), Coordinates for mapping the distribution of magnetically trapped particles, Journal of Geophysical Research, 66 (11), 3681–3691, doi: 10.1029/JZ066i011p03681. Morley, S. K., R. H. W. Friedel, T. E. Cayton, and E. Noveroske (2010a), A rapid, global and prolonged electron radiation belt dropout observed with the Global Positioning System constellation, Geophys. Res. Lett., 37, L06,102, doi:10.1029/2010GL042772. Morley, S. K., R. H. W. Friedel, E. L. Spanswick, G. D. Reeves, J. T. Steinberg, J. Koller, T. E. Cayton, and E. Noveroske (2010b), Dropouts of the outer electron radiation belt in response to solar wind stream interfaces: global positioning system observations, Proc. Royal Society A, 466, 3329–3350, doi:10.1098/rspa.2010.0078.
c
2016 American Geophysical Union. All Rights Reserved.
Morley, S. K., J. Koller, D. T. Welling, B. A. Larsen, M. G. Henderson, and J. T. Niehof (2011), Spacepy - A Python-based library of tools for the space sciences, in Proceedings of the 9th Python in science conference (SciPy 2010), Austin, TX. Morley, S. K., J. P. Sullivan, M. G. Henderson, J. B. Blake, and D. N. Baker (2016), The Global Positioning System constellation as a space weather monitor: Comparison of electron measurements with Van Allen Probes data, Space Weather, 14 (2), 76–92, doi:10.1002/2015SW001339, 2015SW001339. OSTP (2015), FACT SHEET: New Actions to Enhance National Space-Weather Pre-
paredness, https://www.whitehouse.gov/sites/default/files/microsites/ostp/space weather fact sh date accessed: 2017-01-13. Parkinson, B. W., and S. W. Gilbert (1983), NAVSTAR: Global positioning system – Ten years later, Proceedings of the IEEE, 71 (10), 1177–1186. Reames, D. V. (2013), The two sources of solar energetic particles, Space Science Reviews, 175 (1), 53–92, doi:10.1007/s11214-013-9958-9. Reeves, G. D., Y. Chen, G. S. Cunningham, R. W. H. Friedel, M. G. Henderson, V. K. Jordanova, J. Koller, S. K. Morley, M. F. Thomsen, and S. Zaharia (2012), Dynamic radiation environment assimilation model: Dream, Space Weather, 10 (3), doi: 10.1029/2011SW000729, s03006. Reeves, G. D., R. H. W. Friedel, B. A. Larsen, R. M. Skoug, H. O. Funsten, S. G. Claudepierre, J. F. Fennell, D. L. Turner, M. H. Denton, H. E. Spence, J. B. Blake, and D. N. Baker (2016), Energy-dependent dynamics of keV to MeV electrons in the inner zone, outer zone, and slot regions, Journal of Geophysical Research: Space Physics, 121 (1), 397–412, doi:10.1002/2015JA021569, 2015JA021569.
c
2016 American Geophysical Union. All Rights Reserved.
Rodger, C. J., K. Cresswell-Moorcock, and M. A. Clilverd (2016), Nature’s grand experiment: Linkage between magnetospheric convection and the radiation belts, Journal of Geophysical Research: Space Physics, 121 (1), 171–189, doi:10.1002/2015JA021537, 2015JA021537. Rodriguez, J. V., I. Sandberg, R. A. Mewaldt, I. A. Daglis, and P. Jiggens (2016), Validation of the effect of cross-calibrated goes solar proton effective energies on derived integral fluxes by comparison with stereo observations, Space Weather, pp. n/a–n/a, doi:10.1002/2016SW001533, 2016SW001533. Smart, D., and M. Shea (1994), Geomagnetic cutoffs:
A review for space
dosimetry applications, Advances in Space Research, 14 (10), 787 – 796, doi: http://dx.doi.org/10.1016/0273-1177(94)90543-6. Spence, H. E., G. D. Reeves, D. N. Baker, J. B. Blake, M. Bolton, S. Bourdarie, A. A. Chan, S. G. Claudepierre, J. H. Clemmons, J. P. Cravens, S. R. Elkington, J. F. Fennell, R. H. W. Friedel, H. O. Funsten, J. Goldstein, J. C. Green, A. Guthrie, M. G. Henderson, R. B. Horne, M. K. Hudson, J.-M. Jahn, V. K. Jordanova, S. G. Kanekal, B. W. Klatt, B. A. Larsen, X. Li, E. A. MacDonald, I. R. Mann, J. Niehof, T. P. O’Brien, T. G. Onsager, D. Salvaggio, R. M. Skoug, S. S. Smith, L. L. Suther, M. F. Thomsen, and R. M. Thorne (2013), Science Goals and Overview of the Radiation Belt Storm Probes (RBSP) Energetic Particle, Composition, and Thermal Plasma (ECT) Suite on NASA’s Van Allen Probes Mission, Space Science Reviews, 179 (1), 311–336, doi:10.1007/s11214013-0007-5. Tsyganenko, N. A., and M. I. Sitnov (2005), Modeling the dynamics of the inner magnetosphere during strong geomagnetic storms, Journal of Geophysical Research: Space
c
2016 American Geophysical Union. All Rights Reserved.
Physics, 110 (A3), n/a–n/a, doi:10.1029/2004JA010798, a03208. Tuszewski, M., T. E. Cayton, J. C. Ingraham, and R. M. Kippen (2004), Bremsstrahlung effects in energetic particle detectors, Space Weather, 2 (10), doi: 10.1029/2003SW000057, s10S01. Yizengaw, E., M. B. Moldwin, P. L. Dyson, B. J. Fraser, and S. Morley (2006), First tomographic image of ionospheric outflows, Geophysical Research Letters, 33 (20), doi: 10.1029/2006GL027698, l20102. Yu, Y., J. Koller, and S. K. Morley (2013), Quantifying the effect of magnetopause shadowing on electron radiation belt dropouts, Annales Geophysicae, 31 (11), 1929–1939, doi:10.5194/angeo-31-1929-2013.
c
2016 American Geophysical Union. All Rights Reserved.
Instr. NORAD # SVN ID Orbit. Plane Block Data From (mm/yy) CXD 41328 ns70 2016-007A F IIF 02/2016 CXD 41019 ns73 2015-062A E IIF 11/2015 CXD 40730 ns72 2015-033A C IIF 08/2015 CXD 40534 ns71 2015-013A B IIF 04/2015 CXD 40294 ns69 2014-068A E IIF 12/2014 CXD 40105 ns68 2014-045A F IIF 09/2014 CXD 39741 ns67 2014-026A D IIF 07/2014 CXD 39533 ns64 2014-008A A IIF 05/2014 CXD 39166 ns66 2013-023A C IIF 07/2013 CXD 38833 ns65 2012-053A A IIF 11/2012 CXD 37753 ns63 2011-036A D IIF 10/2011 CXD 36585 ns62 2010-022A B IIF 06/2010 BDD-IIR 32711 ns48 2008-012A A IIR-M 03/2008 CXD 32384 ns57 2007-062A C IIR-M 01/2008 CXD 32260 ns55 2007-047A F IIR-M 11/2007 CXD 29601 ns58 2006-052A B IIR-M 12/2006 CXD 28874 ns53 2005-038A C IIR-M 10/2005 CXD 28474 ns61 2004-045A D IIR 11/2004 CXD 28361 ns60 2004-023A F IIR 07/2004 CXD 28190 ns59 2004-009A C IIR 03/2004 CXD 27663 ns56 2003-005A B IIR 02/2003 CXD 26690 ns54 2001-004A E IIR 02/2001 BDD-IIR 26605 ns41 2000-071A F IIR 12/2000 Table 1. Selected details of Global Positioning System satellites carrying LANL CXD and BDD-IIR energetic particle sensors. The columns give, in order, the instrument series, NORAD tracking number, the space vehicle number, the international designation, the orbital plane, block and the date from which energetic data are available. Expanded from Table 1 of Morley et al. [2016]
c
2016 American Geophysical Union. All Rights Reserved.
Figure 1. The temporal coverage of GPS satellites flying energetic particle detectors included in the recent data release. For context within the solar cycle we show the recalibrated daily sunspot number [Clette et al., 2016] with the dark grey line. The horizontal bars show the data coverage for each satellite, where different instrument suites have different colors. Each bar is annotated with the satellite name. The red bars mark the coverage of the CXD-equipped GPS satellites and the green bars mark the coverage of the BDD-IIR instrumented GPS satellites. The dark blue bars show the Van Allen Probes (2012-) scientific mission. Modified from Figure 1 of [Morley et al., 2016].
c
2016 American Geophysical Union. All Rights Reserved.
Figure 2.
The electron differential number flux measured by the LANL-CXD instruments on
GPS, sorted by McIlwain L (calculated using the TS04 magnetic field model [Tsyganenko and Sitnov , 2005]) at: 300 keV (top panel); 1 MeV (middle panel); and 2 MeV (bottom panel). The data are binned averages from all available CXD-equipped satellites with a temporal resolution of 8 hours and a resolution of 1/4 in LM .
c
2016 American Geophysical Union. All Rights Reserved.
Figure 3.
Proton measurements from CXD on GPS during the December 2006 SEP events.
Panel A shows the integral proton flux calculated from all CXD at L≥11 for each hourly time bin. The black and blue lines give the >10 MeV and >30 MeV flux, respectively. The fluxes from GPS are shown by the filled circles/solid lines and the dashed lines show the fluxes from GOES (corrected following Rodriguez et al. [2016]). Panel B displays the proton count rates in the P1 channel on CXD, combined across all satellites, at at resolution of 2 hours and 1/3 in LM . The right panel shows the count rates as a function of LM at 21 UT on 7 December 2006 for 3 proton channels.
c
2016 American Geophysical Union. All Rights Reserved.