Future Generation Computer Systems 28 (2012) 718–731
Contents lists available at SciVerse ScienceDirect
Future Generation Computer Systems journal homepage: www.elsevier.com/locate/fgcs
Energy-efficient and multifaceted resource management for profit-driven virtualized data centers Íñigo Goiri ∗ , Josep Ll. Berral, J. Oriol Fitó, Ferran Julià, Ramon Nou, Jordi Guitart, Ricard Gavaldà, Jordi Torres Universitat Politècnica de Catalunya and Barcelona Supercomputing Center, Jordi Girona 31, 08034 Barcelona, Spain
article
info
Article history: Received 29 June 2010 Received in revised form 29 November 2011 Accepted 16 December 2011 Available online 2 January 2012 Keywords: Energy efficiency Provider’s profit Resource management SLA Virtualized data center
abstract As long as virtualization has been introduced in data centers, it has been opening new chances for resource management. Nowadays, it is not just used as a tool for consolidating underused nodes and save power; it also allows new solutions to well-known challenges, such as heterogeneity management. Virtualization helps to encapsulate Web-based applications or HPC jobs in virtual machines (VMs) and see them as a single entity which can be managed in an easier and more efficient way. We propose a new scheduling policy that models and manages a virtualized data center. It focuses on the allocation of VMs in data center nodes according to multiple facets to optimize the provider’s profit. In particular, it considers energy efficiency, virtualization overheads, and SLA violation penalties, and supports the outsourcing to external providers. The proposed approach is compared to other common scheduling policies, demonstrating that a provider can improve its benefit by 30% and save power while handling other challenges, such as resource outsourcing, in a better and more intuitive way than other typical approaches do. © 2012 Elsevier B.V. All rights reserved.
1. Introduction In utility computing, users run their applications or services in remote data centers and pay only for what they use, as with other utilities such as water or electricity. The terms of the Quality of Service (QoS) to be provided and the economic conditions are established in a Service Level Agreement (SLA). This is the basis of the Infrastructure as a Service (IaaS) paradigm, which relies on virtualized data centers. Data centers have undergone a metamorphosis during the last years because of virtualization. This technology was initially used to consolidate heterogeneous tasks, such as HPC jobs and Web-based applications, in the same node to increase power efficiency [1,2]. As a result of this encapsulation in Virtual Machines (VMs), multiple tasks are seen as a single entity which is easier to handle. However, virtualization also brings another abstraction layer that prevents conventional energy management techniques from performing efficiently or correctly. Moreover, this technology brings new capabilities, such as migration, which open many paths in IT resource management but also require new management logic. Therefore, virtualized data centers cannot be managed like traditional ones as they are now confronted to a set of new challenges.
∗
Corresponding author. E-mail address:
[email protected] (Í. Goiri).
0167-739X/$ – see front matter © 2012 Elsevier B.V. All rights reserved. doi:10.1016/j.future.2011.12.002
First, they must be able to deal efficiently with the new virtualization capabilities [3]. Second, they are receiving economic and social pressure to reduce their energy consumption [4,5]. And third, they must offer high availability [6] and performance to their users, bound to terms agreed in the SLAs. Summarizing, all these challenges result in the fact that these providers require new management policies to make them economically profitable. 1.1. Contributions In this paper, we propose a new approach for managing virtualized data centers which considers multiple facets when placing VMs in data center nodes and maximizes the provider’s profit. This approach extends our previous work [7,8], where we proposed a basic scheduling policy aware of virtualization and we first introduced several facets to be considered synergistically to manage data centers. In our approach, the final profit for the provider is taken into account to take all the placement decisions. This final profit is derived from the revenue obtained by executing a HPC job or hosting a Web-based application and the (economic) costs related to the operation of the VM. We derive these costs by considering the following facets (note that some of them have been brought to a new dimension due to the appearance of both Cloud computing paradigm [9] and virtualization technology).
Í. Goiri et al. / Future Generation Computer Systems 28 (2012) 718–731
719
Power consumption. Data centers aim to reduce its power consumption. However, this is no longer limited to statically consolidate VMs at deployment time and power off unused nodes [10]. Additionally, thanks to live VM migration, we can dynamically move running VMs from underused nodes to others mostly full (and turn off the idle nodes) to reduce power consumption at operation time [4]. Service level agreements. Violating the QoS guarantees agreed by the customer and the provider in the SLA has an economic impact for the provider. According to this, we estimate the potential fulfillment of the SLA terms during VM execution and consider the violation penalty when performing an operation or allocating an specific amount of resources to a VM. Outsourcing capabilities. A data center in the Cloud is not limited to its local resources. When a peak load occurs and it cannot be attended with the in-house resources’ capacity, we consider the possibility to outsource resources (i.e., VMs) to third-party IaaS providers. Virtualization overhead management. Virtualization enables new approaches to well-known management problems, but it also incurs some overheads, such as VM creation and instantiation (which can take minutes), migration, or the extra overhead added by the virtualization hypervisor. We consider them when making decisions, not only as overheads for that specific VM but also as potential SLA penalties for the other VMs running in the same node. Heterogeneity management. Data centers can be composed by hosts with different capabilities and speeds. This influences applications SLA fulfillment and thus, we carefully consider resource heterogeneity when placing VMs. Economic modeling. We model and manage all the facets and overheads in a unified way by modeling them as costs or revenues, depending on their nature. Based on this model, our policy finds the best VM allocation focusing on the maximization of the provider’s benefit.
simulation in a reference system (Section 3.5), and a deadline for the job to complete. If the user wants to run a web server, he will negotiate a performance-based SLA (P), specifying a response time goal in a reference system, and how long the server will run (this value could be undefined). The provider performs an scheduling round periodically or when any event arises (a new VM enters the system, a possible SLA violation is detected, etc.). The provider schedules this VM and all the others already running in the system taking into account the revenues and all the facets related to the operation of the VMs (Section 4). To do so, the provider uses a costbenefit model (Section 5) which merges all the facets, specifies them as economic costs, and applies an scheduling policy. This policy implements an optimization process which chooses the VM placement that maximizes the final provider’s profit (Section 6). Once the placement of the VMs is decided, the provider performs the required actions, which can include creating and migrating VMs, outsourcing them to external providers, and turn off unused nodes to save energy (Section 7). When the task the user wanted to execute has finished, the provider accounts how much the user has to pay. In particular, it calculates the revenue based in the prefixed price per hour and accounts the penalties for violating the SLA based on the fulfillment percentage (Section 8.5). The remainder of the paper is organized as follows: Section 2 discusses some related work; Section 3 is centered on concepts and theoretical assumptions to build our model of a virtualized data center; Section 4 introduces the facets considered in the model; Section 5 describes how these facets are measured and/or calculated (cost-benefit model); Section 6 presents a scheduling policy which uses these facets to schedule VMs in a data center; Section 7 describes the required management procedures in such data center; Section 8 describes the experimental environment; Section 9 evaluates our proposal; and finally, Section 10 presents conclusions and future work.
Keeping in mind all these features and problems, in this work we propose a holistic VM scheduling policy toward nodes of a data center, including the possibility of outsourcing resources to external providers.
Energy efficiency. As shown in Bianchini and Rajaniony [11], power management in server systems has been widely studied in the past. There are several works proposing energy management for servers, which focus on applying energy optimization techniques in multiprocessor environments, such as Chen et al. [12]. In particular, Chen’s work states that new power saving policies, such as Dynamic Voltage/Frequency Scaling (DVFS) or turning off idle servers, can increase both hardware problems and the probability of violating SLAs in reduced environments. The latter is solved by adding smarter scheduling policies to dynamically turn off idle machines to reduce the overall consumption. This technique is also applied by Kamitsos et al. [13], which sets unused hosts in a low consumption state to save energy. This trade-off between performance and power has also been tackled in local hosts where Chun et al. [14] propose a hybrid architecture for data centers which combines the selective usage of low power systems and high performance ones. This approach can be used to apply local energy saving policies only when performance allows it. Following this idea, our approach is able to take profit of this type of environment. Lately, interest in energy management has experienced a hype [15] because of public Clouds. In other words, large data centers are now being offered to the public who asks for a ‘‘green’’ environment. For example, Da Costa et al. [16] propose a logging infrastructure to provide energy-related information to the users. Retaking this trend, multiple works propose techniques to reduce energy consumption [17] in these infrastructures while fulfilling QoS [18,19].
1.2. Use case Our proposal maximizes a provider’s profit by considering all the facets related to its operation. In particular, we consider an infrastructure provider that uses virtualization to manage its resources and offers VMs to their customers, similarly to IaaS paradigm. In addition, this provider can outsource VMs to thirdparty IaaS providers when needed. However, in contrast to current IaaS providers, we do not only offer raw VMs at a fixed price per hour with a fixed amount of resources and some availability. We offer customized VMs with pre-installed software (namely batch HPC jobs and Web-based services) that customers can execute on demand. In addition, we support more complex SLAs by providing high-level QoS guarantees to the execution of these applications. According to this, the virtualized infrastructure provider acts also as an application provider. When a user wants to rent a VM to run a given application, he specifies the desired QoS terms, the hardware and software requirements of the VM, and the duration of the application to be executed at a pricing specified by the provider (Section 3.4). This information is stored in the SLA between the user and the provider. For example, if a user wants to run a batch simulation, he will negotiate a deadline-based SLA (DL), specifying a runtime for the
2. Related work
720
Í. Goiri et al. / Future Generation Computer Systems 28 (2012) 718–731
Virtualization management. Maximizing providers’ benefit has become a hot research topic thanks to virtualization. During the last years, some works like Vogels [20] have studied the consolidation advantages using virtualization while other works, e.g., Nathuji et al. [1], have widely explored its advantages from the power efficiency point of view. Petrucci’s work [2] presents the use of virtualization for consolidation, proposing a dynamic configuration approach for power optimization in virtualized server clusters and outlines an algorithm to dynamically manage them. This approach also focuses on a power efficiency strategy taking into account the cost of turning on or off servers. Nevertheless, it can lead to a too slow decision process as it is focused to a very static environment and HPC jobs. In this sense, our proposal is suitable for an on-line scheduler and is able to manage both HPC jobs and Web-based services. Besides, Kumar et al. [21] propose a solution to loosely couple and facilitate coordination of power and virtualization management. The approach presented provides a better VM placement and runtime management to achieve power savings (10%), as well as a significantly improved fulfillment of SLAs (i.e., 71% less violations). To enhance VM placement, Liu et al. [4] aim to reduce virtualized data center power consumption by supporting VM migration and VM placement optimization while reducing the human intervention. Following the same idea, we propose the use of VMs to run heterogeneous applications and we consider virtualization overheads. However, in addition of consolidating, virtualization makes the overall system more complicated and requires well-designed policies which take VM management problem into account. Until today, virtualization management overheads have been only considered individually when managing virtual resources [22,23]. Economic approaches are also used for managing shared server resources. For example, Garg et al. [24] try to optimize the trade-off between cost and time when managing parallel applications on utility environments. With regard to energy efficiency, Chase et al. [25] present a greedy resource allocation algorithm that allows distributing a web workload among different servers assigned to each service. This technique reduces the server energy usage by 29% or more for a typical Web workload. Moreover, Chen et al. [26] propose an integrated management of applications performance, dynamic workload migration and consolidation, as well as power and cooling in data centers. They present a prototype and demonstrate their integrated solution can reduce energy consumption of servers by 35% and cooling by 15%. Resource outsourcing. Distributing load of a particular provider among different data centers is considered by Le et al. [27]. The authors propose using multiple data centers according to their geographical distribution and power consumption. Besides, Ranjan et al. [28] propose a mechanism which allows transparent use of resources from the federation of several distributed clusters when local resources are insufficient to meet users’ requirements. They demonstrate through simulation that overall users’ QoS demands across the federation are better met. In addition, in our previous work [29] we present an approach which characterizes a federation of Clouds to enhance the providers profit, focusing in the resources outsourcing technique. These works consider basically economic factors over power elements, looking for the improvement of the infrastructure owner’s economic profit and revenue. Summarizing, we note that previous works only take into account individual factors in terms of managing a data center, while our contribution in this work is an integrated and complete solution for managing virtualized data centers. In fact, we address all the emerging challenges in this kind of environments, such as virtualization overheads, the outsourcing of resources to thirdparty IaaS providers, and an accurate economic model which concerns of the operation and execution of a data center.
3. Modeling a virtualized data center We use a model to calculate all the costs and revenues for a given schedule. Thus, we can decide whether placing a VM in an execution platform will provide benefit or not. This platform is usually a local host of the data center which can run VMs, but it can also refer to assets of an external provider (i.e., hosts of other providers when outsourcing) or any other kind of resources. However, the model sees all the execution platforms as hosts with particular features depending on their nature (local, outsourced. . . ), which are translated into different costs. Next subsections discuss how our model handles some important particularities of a virtualized provider, such as: how to unify the units of all the costs and revenues, what time reference must be taken, what heterogeneity factors might affect the system, what to do with running and not running VMs, and how SLA terms compute revenues and penalties. 3.1. Unifying units Our model uses the associated cost to each factor including execution incomes, operational costs, and power consumption. However, each of them has different units, measures, or meanings. For instance, operational costs can be measured in time, while power consumption is measured in watts per hour. For this reason, there is a need to unify all those different parameters in a common way. This is achieved by defining everything as economic revenues or costs, depending on their nature. Following the previous example, operational costs and power consumption can be related to ‘‘price of CPU time unit’’ or ‘‘bill for watt/hour’’, respectively. Unifying units of the different factors allows merging them and getting a final score which makes optimization problem easier to be defined and solved. 3.2. Time references To model a virtualized data center for scheduling, we need to know the execution point of each VM. However, user running time estimations are not very accurate [30]. In our work, we only use them as a reference to estimate the execution progress and deal with queue times, virtualization overheads, low performance, and SLA penalties incurred by these overheads. For this purpose, we consider the execution time for a task in a dedicated reference host (Td (v m)). Notice that this value is only meaningful for HPC jobs. For Web-based services, which can have an undefined duration, Td (v m) is fixed to the scheduling horizon. We use these estimations to calculate: the elapsed time on the execution (t (v m)), the extra time added due to virtualization overheads (Textra (v m)), the estimation of the remaining time (Trem (v m)), and the estimation of the remaining time including the extra time due to virtualization overheads (Tr (v m)). All these values are used to estimate future costs for a VM. Td (v m) = v m execution time in a dedicated machine Textra (v m) = extra time added to v m t (v m) = time elapsed on v m execution Trem (v m) = v m remaining time = Td (v m) − t (v m) Tr (v m) = v m remaining time including virtualization overheads = Trem (v m) + Textra (v m). We use Td (v m) and t (v m) to calculate the final revenue (according to the SLA when the task finishes). Finally, the user will pay for the execution. The extra time used by the provider to accomplish the VM execution will be only considered if it has an impact on the SLA terms (i.e., causing penalties due to SLA terms violation).
Í. Goiri et al. / Future Generation Computer Systems 28 (2012) 718–731
(a) Deadline (DL).
721
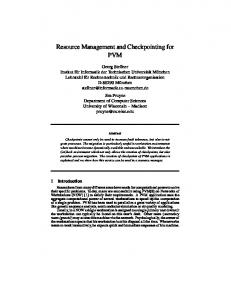
(b) Performance (P ). Fig. 1. SLA fulfillment types.
3.3. Dealing with non-running VMs Our approach has a queue holding those VMs which are not running in any host, including those that have not been yet executed or previous failed execution. For this purpose, we use a virtual host with special features. This host acts as a queue that holds the description of those VMs not allocated in any physical machine. As the provider wants to run as many VMs as possible in the shortest time, the queuing time of VMs in the virtual host has to be minimized. We do so by assigning the maximum cost possible to the allocation of a VM in the queue, which corresponds to no revenue and maximum SLA penalty. This makes any other allocation (into a physical machine) better than not running the VM. Hence, in a scheduling round, the operations with maximum benefit will be those involving VMs in this queue. However, this approach also considers that not executing or waiting to execute a VM can be a desirable solution in some situations. In this case, when the scheduling moves a VM from a running status to the queue again, it means that it is not profitable and thus, the VM will be destroyed. 3.4. SLA terms Each application has its own SLA, described in XML using both WS-Agreement and WSLA specifications. The SLA includes the following terms, which regulate the customer–provider interaction: Pricing. To calculate how much the customer has to pay to the provider, it uses a price per unit of time Prhour (v m) for successfully executing a task (see Section 8.5). Service level objectives (SLO). Terms to assess the QoS that the customer receives from the provider. Definition of QoS metrics. The agreed QoS between the customer and the provider is specified using a set of service-level metrics (e.g., deadline, response time, availability, etc.). Our approach considers heterogeneous workloads composed by two application types: HPC jobs and Web-based services and applications. The provider offers different QoS terms for each one. HPC jobs define an execution deadline and Web-based services use a minimum performance (i.e., response time). Fulfillment of QoS metrics. The fulfillment degree of these QoS terms is used to calculate the penalties the provider must pay due to SLA violations. On the one hand, the SLA fulfillment outcome of an HPC job depends on the deadline. If the job takes longer than Td (v m), it will start violating and if it takes longer than 2 · Td (v m), it will reach the maximum penalty (Fig. 1(a)). On the other hand, the response time of a Web-based service will depend on the amount of assigned resources and the number of requests it receives. A service with not enough resources to satisfy all the requests will start
increasing its response time and it will violate its SLA. In fact, the SLA specifies a threshold response time and it will be violated if the instantaneous response time goes beyond this threshold. In our experiments, this threshold is 8 s, which is the limit a user can wait for a web page as stated in [31]. The SLA fulfillment outcome depends on the percentage of time that the service has been fulfilling the SLA (Fig. 1(b)). For example, if a one-hour service provides a high response time during 15 min, its SLA fulfillment is 75%. Section 8.5 presents in detail how SLA penalties are derived from the SLA fulfillment percentage. Task information. Additional information that is needed to execute the task in the provider. This includes hardware and software requirements Req(v m) and its execution time in a dedicated reference host (Td (v m)). 3.5. Dealing with heterogeneity Usually providers own data centers with hosts with different capabilities and speeds. Thus, resource management policies must be aware of this fact and try to take profit of this resource heterogeneity. The performance and the speed of applications are highly variable depending on the speed of the nodes and this influences the SLA fulfillment. Our model currently focuses on CPU speed as the provider targets HPC applications, which directly depend on CPU, and Webbased applications, which bottleneck is also, in part, the CPU. However, it can be easily extended if the applications would be memory or I/O intensive. As commented before, the model uses some data (e.g., Td (v m)) that it is calculated in a dedicated reference host (Href ). We define the speed of this machine as Speed(Href ). Of course, a given VM can be executed in a host with different speed regarding the reference host. To consider this situation, we define a performance factor Per f (h, v m) for a VM running in a host h: Speed(Href (v m)) . Per f (h, v m) = Speed(h) This performance factor allows us to extrapolate the time estimation from the reference host to any other host. For example, given an HPC task with an execution time Td (v m) in the reference host, the model can estimate how long it would take in another host h as Td (v m, h) = Td (v m) · Per f (h, v m). 4. Facets considered in the model The placement of virtual machines in a data center involves a set of factors that must be considered to get a good schedule. Allocating a VM in a host unable to bring the required resources would imply the non-accomplishment of the VM execution (and so the non-payment of the service), or running a VM in a host whose CPU speed is not enough to assure the task deadline would imply a penalization cost for the extra spent time. In this section, we introduce the factors related to the operation and profitability of a virtualized provider, which we consider in our model.
722
Í. Goiri et al. / Future Generation Computer Systems 28 (2012) 718–731
4.1. Task requirements Each task has its own hardware and software requirements. The scheduler must check the capability of the different hosts for holding a given VM (according to these requirements) to decide about its potential placement. These requirements (Req(v m)) include the required system architecture, the type and number of CPUs, the libraries needed to execute an application, the hypervisor (e.g., Xen or KVM), etc. Although the user provides an initial estimation of the CPU requirements of the application (CPUreq (v m)), these requirements may change over time. For example, applications can have timevarying demand or virtualization operations can be added (e.g., VM creation and migration). As described in [32], we envision a local resource monitor in each host which figures out the resource requirements of the VMs running on that host at every moment. 4.2. Outsourced external resources Traditionally, enterprises that widely rely on IT systems had to make great investments at their first steps to build the needed IT infrastructure, which are considered as capital expenditures (CapEx). This initial investment was often a significant problem, especially for small and medium sized businesses. Nowadays, this fact has changed thanks to the well-established Cloud billing model (i.e., pay-as-you-go). Actually, investments on Cloud infrastructures are smoothed over time versus a large lump sum, thus converting the aforementioned capital expenditures into operating expenses (OpEx) [33]. Outsourcing can suppose an extra solution for an overloaded data center, as some resources can be externalized paying the cost of acquiring temporarily resources (i.e., VMs) from other providers (Crent (hp , v m)).
This model can be derived for different hosts and applications. Taking into account the profile of our target applications, we use CPU utilizations of VMs. In particular, we use HPC jobs from Grid5000 [34] and TPC-W [35] for the Web-based services. The details of our power consumption model, as well as its validation, can be found in our previous work [36]. 4.5. Virtualization management overhead As stated before, one of the strengths of our proposal is our ability to deal with virtualization management issues. One of these is the VM creation overhead (Tc (h, v m)), which is the time required to create and start a new VM before it is ready to run tasks. The other one is the VM migration overhead (Tm (h, v m)), which is the time required to move a running VM from the current node to another. When a new VM needs to be started in the system, we consider the time to create and boot up it in each host. In the same way, when migrating a VM to another host, we consider the time required to migrate it. Furthermore, virtualization can produce other operational problems in its runtime. For example, when migrating a VM, this cost must take into account the remaining execution of a VM, since it is not worth to move a VM which will finish shortly. Another situation to consider is performing multiple actions to VM at the same time which can lead to undesired situation. For example, we cannot migrate a VM which is not fully created or we cannot destroy a VM while is being migrated. Another issue to be considered is performing more than one action at the same time in the same host, which will be referred as concurrency. This situation can generate a race for the resources (e.g., disk or CPU) between the different VMs, which will add extra overhead. For this purpose, the model considers the actions that are already being performed in a given host.
4.3. Estimated SLA penalties 5. Cost-benefit modeling for the facets In general, the fulfillment of the SLA terms and the penalties incurred are evaluated when the task finishes. However, we must consider the potential fulfillment of these terms during task execution. Thus, we can consider the possibility of violating an SLA term when performing any operation or applying a specific allocation to a VM. For instance, the scheduler must evaluate how the overhead impact of operations, such as creating or migrating a VM or the performance impact of overloading a host, affects SLA fulfillment. When a host has an amount of resources lower than the sum of resources demanded by the VMs allocated in that host, the resources have to be shared and this may imply a reduction of the performance of its VMs. We use a health parameter to measure this impact. It refers to the capability of a host to attend the resource demands of the VMs it hosts. We define He(h) as an heuristic function that relates the amount of available and demanded resources with the performance. This function can be used to preview the availability of resources in a host and evaluate the effects that overloading would cause on the SLA fulfillment. We combine this with the performance factor (Per f (h, v m)) to adjust it to non-dedicated machines. 4.4. Power consumption One of the costs that vary with the utilization of the system is the power consumption. To predict the power consumption associated with the execution of each VM, we use a model that relates resource utilization and power consumption. We derive this power model by measuring the power consumption of a physical machine under multiple loads. Using this information, we generate a curve that provides the power consumption of a host at a given occupation (Pow er (h, o)).
In this section, we present the functions to calculate the costbenefit of each one of the facets considered in our model. All these factors are treated as costs of an allocation, and these costs are subtracted from the revenue, resulting into the final benefit for a VM. Note that some of them do not represent economic units and thus, they are transformed into penalties. 5.1. Cost of task requirements The scheduling must check the capability of a host for holding a given VM. In case the host cannot execute a VM, the cost of placing this VM into that host can be considered as the maximum penalty for that task as specified in the SLA and the allocations in that host will not be performed. If the maximum penalty is not available, the cost would be infinity. Hence, it will act as a conditional statement which will avoid the execution of that VM into that host. The unfeasible situations are discarded considering it as a Boolean function: if there are available resources, cost is zero and if the resources in the tentative hosts are nonexistent or unavailable, cost is maximum penalty. From this description, Creq (h, v m) is derived. Creq (h, v m) =
∞ 0.0
if h cannot fulfill Req(v m) otherwise.
5.2. Cost of outsourced external resources Our model supports the usage of rented resources from other providers (this outsourcing approach is detailed in Section 7.3). To model this, we introduce a renting which is expressed as
Í. Goiri et al. / Future Generation Computer Systems 28 (2012) 718–731
Crent (hp , v m), where hp is the external provider. This cost typically depends on the time that the VM will be executed and its features. For example, Amazon EC2 in the US sets a cost of 0.08 e/h for small instances, which corresponds to a VM with 1.7 GB of memory, 1 EC2 Compute Unit (1 virtual core with 1 EC2 Compute Unit), 160 GB of local instance storage, and 32-bit platform [37]. Crent (hp , v m) = Prhour (hp , Type(v m)) · (Td (v m) + Textra (v m)). Usually these external resources are only used when their cost is cheaper than the penalizations of holding a VM in the local data center. This cost is also expressed in economic units.
As explained in previous section, one of the most important costs comes with the penalties incurred by violating SLA terms. Overcrowding a host can degrade the performance of the VMs running on it, so we have defined a health heuristic to estimate how the impact of overloading can result. In particular, He(h) function, which depends on the total CPU capacity in a host h (CPUav ail (h)) and the CPU demand of each VM running on that host (CPUreq (v mi )), can be defined as follows:
v mi
This function follows a behavior already observed in previous works like [36], where the performance is directly related to the ratio of CPU offer/demand and its sharing consequences. This health function represents how much the host is able to handle its entire load. In case of overwhelming, it predicts how much Per f (h, v m) is degraded, so it can be used as heuristic for estimating the execution delays and thus, the SLA penalties. Regarding deadline-based SLAs, we consider the extra time added until then due to operations and host performance. The former considers that the estimated SLA penalty for a v m running at host h at a given time depends on the extra time added until then due to operations or virtualization overheads (Textra (v m)). This is accumulated during the execution to know how much the base execution time is exceeded. The latter considers the estimated extra time that will be added during the remaining execution of the VM in a host. It is derived from Trem (v m) and adjusted according to the host health (He(h)) and its performance factor (Per f (h, v m)). Notice that we are trying to figure out how much time this VM will be delayed beyond its deadline. The complete calculation for this penalty is as follows: PenDL (h, v m) = max 0,
+
Prhour (v m) 3600
PenPer f (h, v m) = max 0,
·
Prhour (v m)
Trem (v m) · Per f (h, v m) He(h)
3600
− Trem (v m) .
Both penalty estimation formulas are conceptually different, but we can generalize a single formula for both SLA types using Textra (v m) = 0 for Web applications. According to this, the cost associated to SLA penalties is:
Estimated SLA penalties are not only used to calculate the current penalties. We extend this idea to assess estimated penalties of potential situations. For instance, we estimate the SLA penalty of a VM (v m1 ) in a host (h) when adding a new VM ˆ (h, v m1 , v m2 ). This is used to calculate the cost of a (v m2 ): Pen new operation (see next subsection for details on how we use this estimation to calculate the cost of virtualization operations). This ˆ (h, v m2 ), which evaluates estimation uses the tentative health, He the status of the host when adding v m2 . The general penalty formula which takes into account a tentative allocation is:
5.4. Cost of power consumption Using the power consumption model of each application and the status of the host, we calculate the power consumption of a host Pow er (h, o). This can be easily converted to economic units using the electricity pricing and the estimated execution time. Using this information, the model estimates the cost caused by the power consumption of each VM, Cpwr (h, v m). Pow er (h, o) = power consumption of h at occupation o O(h, v m) = occupation of h where v m going to run CPUreq (v m) Cpwr (h, v m) = h
CPUreq (v mi )
· Pow er (h, O(h, v m)) · PrKWh · Tr (v m).
− Trem (v m)
Finally, notice that all those estimations are forcing all penalties to be positive, since there is no reward if the task finishes earlier or the Web service gets a better performance by running in a faster machine. Notice also that scaling these penalties by the price per VM per hour, the model is obtaining economic units for every risk of delay.
v mi
· Textra (v m)
Trem (v m) · Per f (h, v m) He(h)
Prhour (v m1 ) ˆ Pen(h, v m1 , v m2 ) = max 0, 3600 Trem (v m1 ) · Per f (h, v m1 ) − Trem (v m1 ) . · ˆ (h, v m2 ) He
CPUav ail (h) He(h) = min 1, . h CPUreq (v mi )
depends on the host health (He(h)) and its performance factor (Per f (h, v m)).
Cpen (h, v m) = PenDL (h, v m).
5.3. Cost of estimated SLA penalties
723
.
The power cost is expressed in economic units by calculating the cost of the energy consumed by the VM. 5.5. Cost of virtualization management overhead
On the other side, for the performance-based SLAs, managing violations of Web applications, which depend on response time and thus on the amount of CPU given at each time, is a matter of considering the extra CPU load each operation incurs. During those periods, the response time will be increased and depending on the amount of resources assigned, it might violate the SLA. According to this, we can estimate the penalty for a Web application trying to figure out the amount of time it will receive less CPU than required during its remaining execution time (Trem (v m)), which basically
Basic virtualization operations. In our approach, virtualization overheads such as VM creation and VM migration affect as an operation time, and these operations can have an estimated or defined time: Host (v m) = host where v m is allocated Tc (h, v m) = time of creating v m in h Tm (h, v m) = time of migrating v m from Host (v m) to h.
724
Í. Goiri et al. / Future Generation Computer Systems 28 (2012) 718–731
The cost to migrate a VM must consider the remaining execution since it is not worth to move a VM which will finish shortly. For this purpose, a migration penalty considering the remaining execution time is used:
2 · Tm (h, v m) Pm (h, v m) = Tm (h, v m)2 Tr (v m)
Tr (v m) < Tm (h, v m) Tr (v m) ≥ Tm (h, v m).
Concurrent virtualization operations on the same VM. When an action is being performed in a VM, starting another action on that VM can put the system under not desired situations like migrating VMs when they are not ready yet, or trying to destroy a VM which is being migrated. For this reason, while the VM is being operated (created, migrated. . . ) operating on this VM is not recommended. So a penalization is derived including the previous migration penalties and creation times:
0.0 ∞ Pv irt (h, v m) = Tc (h, v m) Pm (h, v m)
if Host (v m) = h if action performed in v m if Host (v m) = ∅ if Host (v m) ̸= h.
Concurrent virtualization operations on the same host. As explained before, concurrency (performing more than one action at the same time in the same host) must be considered when operating over VMs. For this purpose, the model firstly calculates the concurrency for a given host according to the VM operations it is already performing. This cost is applied to those VMs which can be created or moved to that node. Finally, aggregating all these penalties, the model can calculate an estimation of the time incurred (Top (h, v m)) by an operation to allocate v m in h. Tc (h, v m) Tm (h, v m) 0.0
Pstate (h, v m) =
if h is creating v m if h is migrating v m otherwise
0.0 h Pconc (h, v m) = Pstate (h, v m)
if Host (v m) = h if Host (v m) ̸= h
vm
Top (h, v m) = Pv irt (h, v m) + Pconc (h, v m). Converting operation time to cost. Notice that all the virtualization penalties described in this section are represented in time units. Now we describe how this extra time is converted into cost units. The overheads of operating with VMs cause extra time (Top ) to be added to the execution time of the VM. These need to be transformed to costs and expressed in economic currency (time is gold). A VM in operation time implies different costs. First, the power used by the host machine during this process. Second, the amortizing cost of the host while it is not running any VM. And third, it must consider the cost incurred by the possible violation of the SLAs running in that node. The estimation of SLA penalty, which was introduced in Section 5.3, is used to simplify this approach. In addition, the cost for creating, migrating, or performing any action in a VM includes the estimation of the penalties added by this operation to all the ˆ (h, v mi , v m)). VM in that host (Pen All these factors are used to convert time (Top (h, v m)) into economic units (Cop (h, v m)) using this conversion function: Cop (h, v m) =
PrKWh + Prhour (v m)
3600
+
h
· Top (h, v m)
ˆ (h, v mi , v m). Pen
v mi
6. Scheduling policy in virtualized data center The key to optimize the provider’s benefit is finding the best VM placement at each moment considering the revenues and costs.
We achieve this by assigning an economic score to each possible VM allocation in every host based on the model presented in Section 3. Thus, we define the system as a matrix #Hosts × #VMs where each cell represents the score to place each VM VMi in each host Hj . Using the model, the scheduling policy firstly calculates the expected revenue (R(v m) = Td (v m) · Prhour (v m)) and then, it subtracts the individual costs. Those that check the requirements (Creq (h, v m)); those associated with the VM execution, such as outsourcing (Crent (h, v m)), or power (Cpwr (h, v m)); those that stand for the virtualization overheads (Cv irt (h, v m)); and finally, the estimated SLA penalties (Cpen (h, v m)). Finally, the final score for each cell is ⟨host, VM⟩: B(h, v m) = R(v m) −
Ci (h, v m).
6.1. Considering SLA penalties on the scheduling When deciding the placement of a VM in the provider, we consider estimated SLA penalties in two ways. On one side, Cpen includes the extra time added to the evaluated VM including both past and future. Past includes previous operations and virtualization overheads (if the VM was already running in the provider). Future estimates the extra that will be added during the remaining execution because of the health of the host. On the other side, Cop takes into account the potential violations that a placement operation (creation or migration) will incur in other VMs already running in that host. We illustrate this with an example. Host HA has 2 CPUs at 3.00 GHz and takes 30 s to create a VM. HA runs two VMs with a requirement of 1 CPU: VM1 and VM2 . VM1 runs an HPC task whose deadline is due in one hour and it has already 60 s of extra time added by previous virtualization operations. VM2 runs a Web service that will finish in one hour. Note that these time references are based on the performance in a reference host. However, for simplicity, HA has the same capabilities as the reference host, and thus Per f (HA ) = 1. In such scenario, He(HA ) = 1 and thus, the current SLA penalties estimations for these two VMs are: Cpen (HA , VM1 )
Prhour (VM1 ) 3600 · 1 = max 0, · 60 + − 3600 3600
=
Prhour (VM1 ) 3600
1
· 60
Cpen (HA , VM2 )
Prhour (VM2 ) 3600 · 1 = max 0, · − 3600 = 0. 3600
1
Then, the provider has to schedule VM3 in the system. This VM will host an HPC job with a deadline of 2 h and 1 CPU requirement. To check the profitability of placing this new VM in HA , the model calculates the cost for this creation operation. The estimated SLA penalty for the new VM is (notice that the host health after adding ˆ this VM would be 32 = 0.6): Cpen (HA , VM3 )
= max 0,
Prhour (VM3 ) 3600
· 30 +
7200 · 1 0.6ˆ
− 7200
.
In addition to the virtualization cost for creating that VM (i.e., an extra time of 30 s), it has to estimate the SLA penalties incurred in the other VMs already running in that host after
Í. Goiri et al. / Future Generation Computer Systems 28 (2012) 718–731
M := Matrix [hosts][VMs]; - Fill M: - Add revenues for each VM; - Substract task requirements to each Host,VM; - Substract infrastructure cost to each Host;
adding VM3 : Cop (HA , VM3 ) =
Prhour (v m) + PrKWh
· 30
3600
+
HA
While M has positive values do: - Update M: - Substract power costs for each Host,VM; - Substract SLA penalties costs for each Host,VM; - Substract renting costs for each Host; - Substract operation costs for each Host,VM;
ˆ (HA , v mi , VM3 ) Pen
v mi HA
ˆ (HA , v mi , VM3 ) Pen
v mi
o
ˆ (HA , VM1 , VM3 ) + Pen ˆ (HA , VM2 , VM3 ) = Pen ˆ (HA , VM1 , VM3 ) Pen
= max 0, =
Prhour (VM1 ) 3600
· 0+
3600 0.6ˆ
Prhour (VM1 )
− 3600
If (iterations limit reached) then: break; End If End While
2
= max 0,
HA
:= highest position on M; := current host for v;
- Re-schedule VM v from Host o to Host h;
Algorithm 1: Algorithm for allocation matrix optimization
ˆ (HA , VM2 , VM3 ) Pen
=
725
Prhour (VM2 ) 3600
· 0+
Prhour (VM2 )
3600 0.6ˆ
− 3600
2
ˆ (HA , v mi , VM3 ) = Pen
Prhour (VM1 ) + Prhour (VM2 ) 2
v mi
Cop (HA , VM3 ) =
+
Prhour (v m) + PrKWh
· 30 3600 Prhour (VM1 ) + Prhour (VM2 ) 2
configurations. Each step brings to a more optimal configuration until there are no better configurations or an iteration limit is reached. The algorithm complexity has an upper boundary of O(#Hosts · #VMs) · C since it iterates over the ⟨host, VM⟩ matrix C times. In addition, some of the constraints help to reduce the search space, i.e., the resource requirement constraint discards a great amount of combinations at the beginning of the algorithm. 7. Management procedures in a virtualized data center
.
6.2. Solving scheduling Once the scoring matrix has been filled with the expected cost for each possible allocation, the algorithm tries to find those combinations that maximize the overall system benefit. However, before taking decisions, the algorithm must prepare this matrix to compare values in a suitable way. First of all, values for each VM must be centered to the value of the current VM situation. From each cell, ⟨Hj , VMi ⟩, the current benefit of keeping VMi in the current host is subtracted (i.e., this is the value of cell ⟨Hcur , VMi ⟩ if VMi is running in Hcur ). From now on, each cell represents the score of moving a VM from the current host to the host corresponding to this cell. Positive scores mean improvement and negative scores mean degradation. When the matrix has been already preprocessed, the optimization process can start. This process selects on each iteration the highest value of the matrix, which represents the best movement to be performed in the system. After moving the corresponding VM to the new host, the matrix is refreshed with new scores. The main idea is to iterate until the cost matrix has no positive values, or the algorithm considers it has performed enough iterations for the current round. However, there is always a chance of not converging and entering in a periodic movement cycle, so a limit number of movements per scheduling round is applied. When the matrix reaches a stable state where all changes are negative or zero (no more improvements can be done), or the number of movements has reached a given limit, we have found a (sub)optimal solution for the current system configuration. Algorithm 1 shows the matrix optimization algorithm. Note that this algorithm is based on Hill Climbing which is greedy. However, in this situation it finds a suboptimal solution much faster and cheaper than evaluating all possible
Once the placement of the VMs has been decided, we need to perform the actions the scheduler has selected. These include simple operations like creation of new VMs or migration of VMs between two nodes, but also more complex actuators that will be detailed in next subsections. 7.1. SLA evaluation The evaluation of SLAs in our approach is two-fold. On one side, there is a SLA fulfillment entity that evaluates the SLAs and checks whether the SLA terms agreed between the customer and the provider have been fulfilled or not. Then, it calculates the penalties the provider will have to pay to the users. Section 8.5 explains in detail how we calculate these penalties. On the other side, the virtualized data center has an internal SLA enforcement mechanism, whose main goal is to detect ongoing SLA violations. Then, it initiates resource management actions to solve such violations (for instance, allocating more resources to a VM). This SLA enforcement mechanism is transparent to the users. Notice that we do not consider a complete SLA enforcement system in this paper (we have presented one in our previous work [32]). We just enable the scheduler to initiate some enforcement actions when it infers that a SLA violation can happen. For example, it cannot reach the deadline or the agreed quality of service. The scheduler infers SLAs status indirectly from the host health and the estimated SLA penalties. As stated before, resource requirements of VMs (CPUreq (v m)) can vary along time and these fluctuations have an effect on the host health (He(h)). In particular, when a VM requires more resources (CPUreq (v m) = CPUreq (v m) + δ ), the health of the host where this VM runs becomes worse. This can result into a SLA violation as some VMs running on that host could receive fewer resources than required. According to this, the scheduler periodically assesses the host health. When it detects that a host health becomes worse (i.e., some VMs in that host could violate their SLAs), it initiates a
726
Í. Goiri et al. / Future Generation Computer Systems 28 (2012) 718–731
rescheduling round to maximize the profitability according to the new scenario. This is accomplished using the scheduling policy described before. 7.2. Power efficiency Power efficiency in our approach is based on the consolidation of VMs to reduce the number of running nodes. Idle nodes can be turned off to save its idle power consumption [38]. When they are needed to run VMs and try to fulfill the tasks SLAs, we turn them on again as done in our previous work [36]. The scheduling policy enables this consolidation by including the energy costs in the global cost-benefit analysis. For this purpose, one of the key decisions is determining the minimum number of operative nodes needed to execute the workload. In this work, when to turn on or off a node is decided using a simple approach where a given amount of idle machines is always maintained. For example, if the provider is using 10 nodes and the number of idle nodes has been fixed in 2 nodes, it would require 12 nodes to be up and running while only 10 are used. More complex approaches like workload prediction could be also applied to make a more accurate policy. Once the number of required nodes is known, the model is also used to select which nodes needs to be turned on or off. In this situation, our approach tries to schedule a fake VM to the system and calculates the costs this process would cost to the provider. Depending on the current target, i.e., turning on or off a node, the algorithm selects the one with highest or lowest benefit, respectively. 7.3. Outsourcing We also consider the option of outsourcing any VM to a thirdparty IaaS provider. If the local costs are too high compared with the profit (e.g., there is not enough local capacity to execute a VM in the local provider), the scheduler can decide to start a VM in an external provider. To support this scenario, we add a special host (hp ) which represents an external provider. We add as many special hosts as external providers for outsourcing are available. The model for this kind of a host is considerably simplified. First, there are no SLA penalties when running in external providers, as they perform a static resource allocation that fulfills the SLA. In addition, there are no power consumption costs (Cpwr (hp , v m) = 0) as the other provider already includes them in the renting cost Crent (hp , v m). Finally, there are special cases for virtualization penalties. Firstly, possible migrations of a v m from and to those special hosts are avoided (Tm (h, v m) = ∞; Tm (hp , v m) = ∞). Secondly, we do not consider concurrency penalty in an external provider (Cconc (hp , v m) = 0). Therefore, Cv irt (hp , v m) is equal to the cost of creating a VM in the external host, Tc (hp , v m). 8. Experimental environment To evaluate our proposal, we use a simulated data center which supports different scheduling policies and is able to run multiple workloads. Next subsections present our experimental environment. 8.1. Simulator A virtualized data center is a variable environment which makes difficult to test multiple policies. In addition, results are difficult to get and reproduce again because of the variability of the system. To solve this problem, we simulate its behavior based on actual
system monitoring, including power consumption measured from real machines using power meters. Among other factors, the simulation includes virtualization overheads (including creation, migration, checkpoint), the ability to turn nodes on and off, and the ability to simulate node crashes. The simulator, which is based on OMNet++, uses different scheduling policies and provides several metrics like power consumption, node usage, performance, and benefit. An early stage of this simulator is presented in [36] and it is validated and described in detail in [39]. It was also used to test initial versions of the current scheduling policy [7]. 8.2. Scheduling policies To evaluate our proposal, we implement the policy presented in this paper as ‘‘Cost-driven Scheduling Policy’’ (CDSP). It also supports multiple variations by adjusting some parameters. For example, we can take into account the virtualization overhead, add outsourcing capabilities, etc. As low boundaries in terms of SLA fulfillment and power consumption, we use Random and Round-Robin policies. The first one decides the placement without taking into account any factor. The other one always places the VMs in the host with the lowest usage and achieves the lowest consolidation. We also use a more plausible approach, which is consolidationaware like backfilling (BF). We use a variation of the classical EASYBackfilling policy for job scheduling [40]. This variation follows the same idea that regular backfilling but with VMs instead of jobs. Thus, it fills nodes having idle resources with small VMs to increase consolidation. In addition, we use an extension of this approach that supports migration (BF + M), which increases global system consolidation by migrating VMs from mostly unused machines to those close to be full. Notice that the CDSP policy follows the backfilling scheme, but it also takes into account the virtualization management overhead. In addition, it is driven by the proposed economic model and thus, it can deal with the trade-off between SLA penalties and energy consumption. We also compare with our previous policy based in Scores which does not consider economic factors [7]. As it does not support the economic model, it cannot automatically deal with the trade-off between performance and energy and depends on the administrator setup. Finally, we give an upper boundary in terms of SLA fulfilling with the Perfect policy. This policy gives the minimum energy consumption possible to execute the workload while fulfilling the 100% of the SLA. This is an analytical policy which implementation is NP complete and thus, it is not feasible for an online model. 8.3. Provider’s configuration The experiments consist of the simulation of a whole virtualized data center with a different amount of local nodes having different features like architecture, speed, and size. The simulated data center is also able to outsource to other providers. The provider behaves as a Cloud provider similar to Amazon EC2 where users can rent VMs to run their tasks. In particular, we use the EC2 pricing for medium instances with high CPU load, which have a cost of 0.17 e/h (EC2 pricing in Europe). However, the accounting is performed in a more accurate way and the user pays per each second and not each hour. We use the electricity pricing from Spain which is 0.09 e/ KWh [41]. Furthermore, to calculate the cost of the nodes, we also take into account the amortization of the servers (in 4 years) and the space (in 10 years) required to deploy them using a price of 2000 e /m2 . As external providers, two Amazon EC2 data centers
Í. Goiri et al. / Future Generation Computer Systems 28 (2012) 718–731
727
Table 1 Node features according to its type. Power (W)
A B C D
Arch
CPU (num@Hz)
Mem (GB)
Min
Max
Price (e)
m2 /node
Xeon Xeon Xeon Atom
4@3000 4@2660 2@2392 2@1600
16 16 2 4
230.0 228.6 228.1 37.2
317.9 316.1 315.3 39.8
1000.0 1000.0 1000.0 500.0
0.1 0.1 0.1 0.05
are considered: US and Europe. Both have an average creation time of 300 s and a cost of 0.19 and 0.17 e/h respectively. Regarding the in-house resources, the provider has local nodes with different speeds and features according to the experiment and its goal. These nodes can have two different architectures of Xeon or Atom. Table 1 presents the features of the different nodes including: architecture, CPU features, memory, power consumption (obtained using a power meter), a reference pricing, and the space taking into account they are racked. The first two Xeon-based configurations have good performance and high power consumption, while the C one corresponds to old machines with medium performance and high consumption. Atom-based configuration is cheaper and has poor performance but very low power consumption. 8.4. Data center workload Our approach is able to deal with heterogeneous workloads composed by batch HPC jobs and Web-based services having a similar amount VMs of both types running at the same time. For testing purposes, the HPC workload is a Grid workload obtained from Grid5000 [34] on the week that starts on Monday first of October of 2007. The Web workload was obtained from an anonymous European ISP and was collected during 2009. It results from the aggregation of several services and the used profile is of a whole week, thus representing different classical increases of load of each weekday and the decreases of load of weekends. The applications which compose the workload are modeled and introduced into the simulation framework. As shown in Table 2, which shows the details of the heterogeneous workload, there are a total of 1973 HPC tasks that are CPU intensive (with several CPU consumptions) and behave in a linear way depending on the speed of the node. In addition, the tasks have different durations: short (less than 600 s), medium, and long (more than 20,000 s); they are distributed among time with a mean of 35 and a maximum of 204 tasks are running concurrently. On the other hand, Web-based applications simulate customers who want to run their services on top of the provider. The behavior of these applications deployed corresponds with the SPECweb2009 e-Commerce application [42]. Their model has been obtained by stressing this application (deployed on a Tomcat v5.5) with different resource allocation under different input loads. In particular, this modeling has focused on response time. In this sense, we create a performance pattern that relates this metric with both incoming users’ load and CPU usage of the server (note that the application used is CPU-bounded in this environment). We divide the aforesaid pattern in three phases according to the server’s performance: an stationary response time where the incoming load causes a CPU utilization less than 60%; slightly increased where CPU utilization is between 60% and 80%; and polynomial where the server is overloaded (i.e., higher than 80%). Finally, the number of VMs concurrently running in the provider and the features of the local nodes are the key issue to dimension the provider. We use data centers with different features depending on the experiment.
Table 2 Workload details. Type
SLA type
HPC HPC HPC HPC HPC HPC HPC HPC HPC HPC Web Web Web Web Web Web Web Web
Deadline Deadline Deadline Deadline Deadline Deadline Deadline Deadline Deadline Deadline Performance Performance Performance Performance Performance Performance Performance Performance
Total HPC Total Web
#VMs
Description
Mean duration
12 18 27 29 49 82 88 89 725 854 6 6 6 6 6 5 5 20
1 CPU 1 CPU 2 CPU 3 CPU 2 CPU 2 CPU 4 CPU 1 CPU 2 CPU 1 CPU Monday Tuesday Wednesday Thursday Friday Saturday Sunday One week
66213’’ 57913’’ 296’’ 15380’’ 594’’ 18485’’ 19911’’ 8456’’ 101’’ 5346’’ 86400’’ 86400’’ 86400’’ 86400’’ 86400’’ 86400’’ 86400’’ 604800’’
1973 65
10979339’’ 15552000’’
8.5. SLA revenue and penalties A SLA fulfillment entity monitors and accounts the execution of the tasks in the provider and calculates the percentage of time in which each SLA has been violated (σ (Appi )). This violation ratio is used as the input for determining SLA penalty (Pen(Appi )). This is the final penalty the provider must pay to the customer for non-accomplishing the agreed SLA. Pen(Appi ) is calculated as a percentage of the revenue acquired when fulfilling the corresponding SLA (Rev(Appi )) by using a Gompertz function (Gom(σ (Appi ))). This is a kind of sigmoid function where growth is slowest at the start and end of a time period and thus, it reduces the penalties for low SLA violations, as shown in Fig. 2. Pen(Appi ) = Rev(Appi ) ·
Gom(σ (Appi )) 100
.
The revenue (Rev(Appi )) results from the amount that the customer must pay for executing a VM during an amount of time (T ) at an agreed pricing (Prhour (Appi )), in a similar way Amazon EC2 [37] does. The revenue for HPC jobs is calculated assuming that T = Td (Appi ). For web-based services, we assume that T = t (Appi ). Rev(Appi ) = T · Prhour (Appi ). The final income for the provider for executing a task is: Inc (Appi ) = Rev(Appi ) − Pen(Appi ). Note that we use a strict approach to calculate SLA penalties. This allows appreciating the impact of scheduling policies on SLA penalties in a easier way. However, real providers can use a more relaxed approach.
728
Í. Goiri et al. / Future Generation Computer Systems 28 (2012) 718–731 Table 3 Scheduling results of policies.
Perfect RD RR BF BF+M Score CDSP no SLA CDSP no mig CDSP
Work/ON
Energy (kWh)
DL (%)
P (%)
B (e)
22.5/22.5 22.0/23.9 28.1/30.1 25.1/27.1 24.2/26.2 24.7/26.7 24.0/26.0 13.9/16.0 13.3/15.3
1229.5 1328.9 1556.3 1495.7 1420.0 1464.6 1413.8 831.4 838.0
100.0 9.7 45.4 59.8 61.5 66.9 59.8 77.5 79.5
100.0 69.3 82.5 84.2 84.3 84.4 84.2 82.1 81.9
1391.021 654.4 1030.5 948.3 967.8 1053.2 965.8 1401.7 1412.3
Fig. 2. SLA penalty function.
Fig. 4. Power consumption comparative.
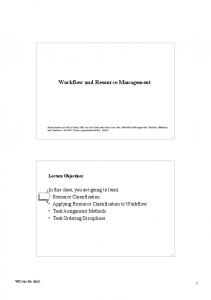
Fig. 3. Algorithm scalability according the number of hosts and VMs.
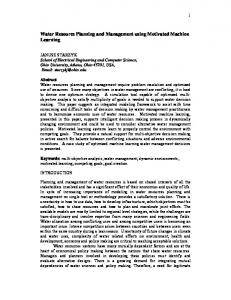
9. Evaluation 9.1. Scheduling algorithm scalability We first evaluate the scalability of our scheduling algorithm. For this purpose, a new VM is submitted every 100 s. Every VM fits in every host and no restrictions are applied. This is the worst case and provides an upper boundary of the algorithm efficiency. Fig. 3 shows the number of operations required depending on the number of VMs in a data center with a given number of nodes. The algorithm powers on new hosts as soon as it needs them (policy presented in Section 7.2). Until this point the algorithm fills those nodes and once all of them are full, the model decides there is no more room for VMs and starts keeping the new requests in the queue. These results show the algorithm has a linear cost, as theoretically announced in previous sections. In addition, it takes less than 2 s to schedule a VM in a data center of 1000 nodes which is already executing more than 4000 VMs. Moreover, the overhead to schedule our workload during one week is lower than 0.05%. The upper boundary of the scheduler’s complexity has demonstrated to be linear as it follows O(#Host · #VM) · C . In addition, this reasoning can be easily distributed defining a hierarchical architecture, where each scheduler controls a set of hosts. 9.2. Scheduling policy performance To evaluate our scheduling policy, we compare its behavior against other policies described in Section 8.2. In particular, we analyze metrics like power consumption and system performance, but keeping in mind the final goal: provider’s benefit. We submit the workload to a provider with different schedulers and compare their results. This data center is composed by 65 nodes (the maximum number of nodes needed in the workload peak). Table 3 shows the obtained results for the different policies. Perfect consumes 1229.6 kWh and obtains a 100% SLA fulfillment, which implies a benefit of 1391e. This is an ideal policy which fulfills all the SLAs and uses the minimum optimal number of resources to fulfill all the SLAs. This approach gives us a reference of what is the best value we can get with this testbed and this
workload. Notice that this policy is not realistic as it has a NP complexity, but it gives a theoretical upper boundary. As expected, Random (RD) performs very badly in terms of SLA, as seen in the fulfillment of Deadline (DL) and Performance (P). Round Robin (RR) gets a very bad consolidation level requiring a mean of 28 nodes working and 30 nodes on (Work/ON). These simple policies, which neither take care of consolidation issues nor performance, establish a lower boundary. Backfilling (BF), which is consolidation-aware, fills nodes with unassigned resources with small VMs to increase consolidation. BF and the dynamic extension of this policy (BF + M), which supports migration of VMs to improve consolidation, cannot consider the overheads of managing virtualization and thus, they get a medium SLA fulfillment level. Score, which is based in scores but does not consider economic factors, is able to improve SLA fulfillment. However, it must manually tuned to deal with the tradeoff between performance and consolidation, which makes increasing the benefit (B) harder. Our scheduling policy presents multiple variants. The first one, which does not consider SLA (CDSP no SLA), gets results similar to the score-based policy. Adding SLA costs (CDSP no mig), it increases provider’s consolidation and gets better SLA fulfillment. Finally, our policy including migration support (CDSP) gets better consolidation and higher benefit. These results demonstrate our model is able to handle virtualization overheads and thanks to this, improve the provider’s benefit. In particular, it gets a 30% more benefit than simple policies like backfilling and its variants. It is also better than Perfect as it sacrifices some SLAs to dramatically reduce the energy consumption. The low energy consumption shown in Fig. 4 is mainly because of a higher consolidation. In addition, our policy increases the SLA fulfillment regarding the BF+M policy, thus reducing the SLA penalties. Fig. 5 demonstrates our approach gets high SLA fulfillment for most of the tasks while Dynamic backfilling provides less than 0.5 fulfillment to more than 50% of the tasks. 9.3. Resource heterogeneity To evaluate the ability of our policy to take advantage of host heterogeneity, we run the scheduling policy on data centers with the same amount of resources (260 CPUs) but different architectures:
Í. Goiri et al. / Future Generation Computer Systems 28 (2012) 718–731
(a) Backfilling + Migration.
729
(b) CDSP. Fig. 5. Frequency histogram of SLA fulfillment.
Fig. 6. Power consumption using different data centers.
Xeon 65 Xeon hosts (Table 1. Used in the previous experiment). Atom 130 Atom-based hosts (130 × 2 CPUs). Heterogeneous 45 Xeon hosts and 40 Atom-based (45 × 4 + 40 × 2 CPUs). Atom hosts require less space and reduce the capital costs, as two of them fit in the same space of one Xeon-based host and cost the half. Xeon hosts are able to run 4 HPC tasks of 1 CPU in 1 h while Atom hosts can only run 2 in 5 h. Therefore, the execution of 4 tasks in Xeon will take 1 h and will consume 318 W while the other one would take 10 h and would consume 398 W. Hence, it is more energy-efficient to run the HPC tasks in a Xeon host and power it off. Table 4 shows the performance of the different scheduling policies and Fig. 6 shows the power consumption of our scheduling policy for the three data center setups. These results show higher saving for the heterogeneous approach. This is because it reduces the power consumption using the Atom power-efficiency and gets reasonable SLA fulfillment thanks to the Xeon nodes. On the one hand, our proposal runs most of the HPC tasks in the Xeon nodes because they get better performance. Moreover, these tasks have deadlines which cannot be achieved by Atom hosts. On the other hand, in the case of applications with lower performance requirements such as Web applications or tasks with more relaxed SLAs, it is better to make use of Atom nodes, which consume less energy. For example, the SLA fulfillment of Web applications (P) is very similar for Atom and Xeon-based data centers. However, the Atom-based data center violates all the deadlines (DL). This experiment demonstrates that our proposal automatically balances workload among nodes according to power consumption and performance. Thus, we can conclude that our model is able to handle resources heterogeneity and get a higher benefit for the provider. 9.4. Outsourcing Previous results have high fixed costs (more than e350) to maintain 65 nodes during a week, while not all of them are used
all the time. To tackle this high cost, our policy takes advantage of outsourcing technique to withstand periods of high load. This experiment reduces the number of nodes to 20 and adds the capability to outsource to two external providers. Table 5 shows that when there are enough resources for the peak (65 nodes), the difference between using outsourcing or not is not very high. In this case, it only outsources 50 VMs (outsourcing cost is e26.5), the energy savings are lower less than 1%, and SLA fulfillment does not improve much. When the provider has only 20 nodes to execute the workload, it reduces fixed costs and power consumption while SLA penalties are higher. However, it gets higher benefit thanks to outsourcing as it can rent resources from external providers during peak loads. In particular, having only 20 nodes implies a cost of e89.4 for renting 992 VMs. Thus, reducing the amount of local resources and renting makes the provider getting higher benefit. Note that outsourcing cost depends on VM duration and this is why 50 VMs cost e26.5 and 992 VMs only e89.4. Performance in an external provider is better since we assume the provider gives the required amount of resources. However, creation time is longer (e.g., 300 s in EC2), which implies a high overhead for shortdeadline tasks. Finally, it might seem that reducing the amount of local resources will always provide better economical performance. Nevertheless, the option of having a provider with no local resources gets a poor benefit. This is because outsourcing costs are higher than power savings. 10. Conclusions Toward making providers more profitable, energy consumption is a critical issue for large-scale data centers that host thousands of machines and cooling equipment. Virtualization is making providers more profitable every day as it provides consolidation and dynamism. Nevertheless, it requires new policies for managing the new virtualization capabilities. This paper creates a model to describe a virtualized data center and solves the management problem from an economic point of view. This model merges several factors, such as hardware and software requirements, SLA penalties, virtualization overhead, and power efficiency. Using this model, we perform a simple optimization process to maximize the provider’s profit. Finally, VM placement is decided based on the optimization result. We use a power-aware simulator which allows us to compare our proposal with other solutions. We evaluate our proposal with an heterogeneous workload using several metrics such as power consumption and SLA fulfillment. Experiments demonstrate our model is able to increase the provider’s benefit by a 30% and can deal with problems like resource heterogeneity. Ultimately, we also show that the most energy-efficient approach for this kind of
730
Í. Goiri et al. / Future Generation Computer Systems 28 (2012) 718–731
Table 4 Scheduling results of policies with heterogeneity.
BF BF BF CDSP CDSP CDSP
Nodes
Work/ON
Energy (kWh)
DL (%)
P (%)
B (e)
Xeon Atom Heterogeneous Xeon Atom Heterogeneous
25.1/27.1 52.7/54.7 38.1/40.1 13.3/15.3 57.5/59.7 13.3/15.3
1495.7 784.5 1037.7 838.0 805.7 647.2
59.8 0.0 52.2 79.5 0.0 72.2
84.2 83.6 83.7 81.9 88.9 82.2
948.3 745.4 819.6 1412.3 731.1 1486.8
Table 5 Scheduling results of policies introducing outsourcing. Nodes
Out/e
65 65 20 20 0
0 50 0 992 2038
0.0 26.5 0.0 89.4 1345.7
Work/ON
Power (kW)
DL (%)
P (%)
B (e)
13.3/15.3 13.1/15.0 14.2/15.5 13.2/14.9 0.0/0.0
838.0 817.3 850.9 800.3 0.0
79.5 82.9 30.1 59.8 49.1
81.9 83.9 83.7 86.3 99.7
1412.3 1391.2 1527.9 1566.1 506.6
environment is running jobs very fast and powering the system off afterward. Our future work will focus on extending current policies to support other applications with other SLAs. In addition, the presented approach can benefit from workload characterization to predict the number of required nodes and improve the turn on/off policy. This policy can be also integrated in the cost-benefit model, which would reduce the number of required nodes and thus, the energy consumption. Acknowledgments This work is supported by the Ministry of Science and Technology of Spain under contracts AP2008-0264, TIN2007-60625, and TIN2008-06582-C03-01, by the Generalitat de Catalunya under contracts 2009-SGR-980 and 2009-SGR-1428, and the COST (European Cooperation in Science and Technology) framework under Action IC0804. References [1] R. Nathuji, K. Schwan, A. Somani, Y. Joshi, VPM tokens: virtual machine-aware power budgeting in datacenters, Cluster Computing 12 (2) (2009) 189–203. [2] V. Petrucci, O. Loques, D. Mossé, A dynamic configuration model for powerefficient virtualized server clusters, in: Proceedings of the 11th Brazillian Workshop on Real-Time and Embedded Systems, WTR 2009, Recife, Brazil, May 25, 2009. [3] B. Sotomayor, K. Keahey, I. Foster, Combining batch execution and leasing using virtual machines, in: Proceedings of the 17th International Symposium on High Performance Distributed Computing, HPDC 2008, June 23–27, Boston, MA, USA, 2008, pp. 87–96. [4] L. Liu, H. Wang, X. Liu, X. Jin, W. He, Q. Wang, Y. Chen, GreenCloud: a new architecture for green data center, in: Proceedings of the 6th International Conference on Autonomic Computing and Communications, ICAC 2009, Industry Session, Barcelona, Spain, 2009, pp. 29–38. [5] J.-M. Pierson, Green task allocation: taking into account the ecological impact of task allocation in clusters and clouds, Journal of Green Engineering 1 (2) (2011) 129–144. [6] R. Badrinath, R. Krishnakumar, R. Rajan, Proceedings of the 13th International Conference on Parallel and Distributed Systems, ICPADS 2007, in: Virtualization aware job schedulers for checkpoint-restartHsinchu, vol. 2, Taiwan, 2007, 1–7. [7] Í. Goiri, F. Julià, R. Nou, J. Berral, J. Guitart, J. Torres, Energy-aware scheduling in virtualized datacenters, in: Proceedings of the 12th IEEE International Conference on Cluster Computing, Cluster 2010, Heraklion, Crete, Greece, September 20–24, 2010, pp. 58–67. [8] Í. Goiri, J.O. Fitó, F. Julià, R. Nou, J. Berral, J. Guitart, J. Torres, Multifaceted resource management for dealing with heterogeneous workloads in virtualized data centers, in: Proceedings of the 11th ACM/IEEE International Conference on Grid Computing, Grid 2010, Brussels, Belgium, October 25–29, 2010, pp. 25–32. [9] R. Buyya, C. Yeo, S. Venugopal, J. Broberg, I. Brandic, Cloud computing and emerging IT platforms: vision, hype, and reality for delivering computing as the 5th utility, Future Generation Computer Systems 25 (6) (2009) 599–616. [10] V. Hamscher, U. Schwiegelshohn, A. Streit, R. Yahyapour, Evaluation of jobscheduling strategies for grid computing, in: Proceedings of the 1st IEEE/ACM International Workshop on Grid Computing, Grid 2000, Springer, Bangalore, India, 2000, pp. 191–202.
[11] R. Bianchini, R. Rajaniony, Power and energy management for server systems, IEEE Computer, Special Issue on Internet Data Centers 37 (11) (2004) 68–76. [12] Y. Chen, A. Das, W. Qin, A. Sivasubramaniam, Q. Wang, N. Gautam, Managing server energy and operational costs in hosting centers, ACM SIGMETRICS Performance Evaluation Review 33 (1) (2005) 303–314. [13] I. Kamitsos, L. Andrew, H. Kim, M. Chiang, Optimal sleep patterns for serving delay-tolerant jobs, in: Proceedings of the 1st International Conference on Energy-Efficient Computing and Networking, eEnergy 2010, University of Passau, Germany, 2010, pp. 31–40. [14] B. Chun, G. Iannaccone, R. Katz, G. Lee, L. Niccolini, An energy case for hybrid datacenters, ACM SIGOPS Operating Systems Review 44 (1) (2010) 76–80. [15] A. Beloglazov, R. Buyya, Y.C. Lee, A.Y. Zomaya, A taxonomy and survey of energy-efficient data centers and cloud computing systems, Advances in Computers 82 (2011) 47–111. [16] G. Da Costa, M. de Assunção, J. Gelas, Y. Georgiou, L. Lefèvre, A. Orgerie, J. Pierson, O. Richard, A. Sayah, Multi-facet approach to reduce energy consumption in clouds and grids: the GREEN-NET framework, in: Proceedings of the 1st International Conference on Energy-Efficient Computing and Networking, eEnergy 2010, University of Passau, Germany, 2010, pp. 95–104. [17] E. Feller, L. Rilling, C. Morin, Energy-aware ant colony based workload placement in clouds, in: Proceedings of the 12th ACM/IEEE International Conference on Grid Computing, Grid 2011, Lyon, France, 2011. [18] A. Beloglazov, J. Abawajy, R. Buyya, Energy-aware resource allocation heuristics for efficient management of data centers for cloud computing, Future Generation Computer Systems 28 (5) (2012) 755–768. [19] S.K. Garg, C.S. Yeo, A. Anandasivam, R. Buyya, Environment-conscious scheduling of HPC applications on distributed cloud-oriented data centers, Journal on Parallel and Distributed Computing 71 (6) (2011) 732–749. [20] W. Vogels, Beyond server consolidation, Queue 6 (1) (2008) 20–26. [21] S. Kumar, V. Talwar, V. Kumar, P. Ranganathan, K. Schwan, vManage: loosely coupled platform and virtualization management in data centers, in: Proceedings of the 6th International Conference on Autonomic Computing, ACM, 2009, pp. 127–136. [22] B. Sotomayor, K. Keahey, I. Foster, Overhead matters: a model for virtual resource management, in: Proceedings of the 2nd International Workshop on Virtualization Technology in Distributed Computing, VTDC 2006, Tampa, Florida, USA, 2006, 5. [23] P. Anedda, S. Leo, S. Manca, M. Gaggero, G. Zanetti, Suspending, migrating and resuming HPC virtual clusters, Future Generation Computer Systems 26 (8) (2010) 1063–1072. [24] S. Garg, R. Buyya, H. Siegel, Time and cost trade-off management for scheduling parallel applications on Utility Grids, Future Generation Computer Systems 26 (8) (2010) 1344–1355. [25] J. Chase, D. Anderson, P. Thakar, A. Vahdat, R. Doyle, Managing energy and server resources in hosting centers, ACM SIGOPS Operating Systems Review 35 (5) (2001) 103–116. [26] Y. Chen, D. Gmach, C. Hyser, Z. Wang, C. Bash, C. Hoover, S. Singhal, Integrated management of application performance, power and cooling in data centers, in: Proceedings of the 12th IEEE/IFIP Network Operations and Management Symposium, NOMS 2010, April 19–23, Osaka, Japan, IEEE, 2010, pp. 615–622. [27] K. Le, R. Bianchini, M. Martonosi, T. Nguyen, Cost-and energy-aware load distribution across data centers, in: Proceedings of the Workshop on Power Aware Computing and Systems, HotPower 2009, Big Sky, MT, USA, 2009. [28] R. Ranjan, A. Harwood, R. Buyya, A case for cooperative and incentive-based federation of distributed clusters, Future Generation Computer Systems 24 (4) (2008) 280–295. [29] Í Goiri, J. Guitart, J. Torres, Characterizing cloud federation for enhancing providers’ profit, in: Proceedings of the 3rd International conference on Cloud Computing, CLOUD 2010, Miami, Florida, USA, 2010, pp. 123–130.
Í. Goiri et al. / Future Generation Computer Systems 28 (2012) 718–731 [30] C. Lee, Y. Schwartzman, J. Hardy, A. Snavely, Are user runtime estimates inherently inaccurate? Lecture Notes in Computer Science 3277 (2005) 253–263. [31] D. Menascé, V. Almeida, L. Dowdy, L. Dowdy, Performance by Design: Computer Capacity Planning by Example, Prentice Hall, 2004. [32] Í Goiri, F. Julià, J. Ejarque, M. De Palol, R.M. Badia, J. Guitart, J. Torres, Introducing virtual execution environments for application lifecycle management and sla-driven resource distribution within service providers, in: Proceedings of the 8th IEEE International Symposium on Network Computing and Applications, NCA 2009, Cambridge, Massachusetts, USA, 2009, pp. 211–218. [33] M. Armbrust, A. Fox, R. Griffith, A. Joseph, R. Katz, A. Konwinski, G. Lee, D. Patterson, A. Rabkin, I. Stoica, et al. Above the clouds: a berkeley view of cloud computing, EECS Department, University of California, Berkeley, Tech. Rep. UCB/EECS-2009-28. [34] The Grid Workloads Archive. http://gwa.ewi.tudelft.nl, 2009. [35] D. García, J. García, TPC-W e-commerce benchmark evaluation, Computer 36 (2) (2003) 42–48. [36] J. Berral, Í Goiri, R. Nou, F. Julià, J. Guitart, R. Gavaldà, J. Torres, Towards energyaware scheduling in data centers using machine learning, in: Proceedings of the 1st International Conference on Energy-Efficient Computing and Networking, eEnergy 2010, University of Passau, Germany, 2010, pp. 215–224. [37] Amazon Elastic Compute Cloud. http://aws.amazon.com/ec2. [38] E. Pinheiro, R. Bianchini, E. Carrera, T. Heath, Dynamic cluster reconfiguration for power and performance, compilers and operating systems for low power. [39] F. Julià, J. Roldàn, R. Nou, O. Fitó, Vaquè, Í Goiri, J. Berral, EEFSim: energy efficency simulator, Tech. Rep. UPC-DAC-RR-2010-19, Departament d’Arquictectura de Computadors, Universitat Politècnica de Catalunya, 2010. [40] D. Feitelson, A. Weil, Utilization and predictability in scheduling the IBM SP2 with backfilling, in: Proceedings of the 12th International Parallel Processing Symposium/9th Symposium on Parallel and Distributed Processing, IPPS/SPDP’98, Orlando, Florida, USA, 1998, pp. 542–546. [41] Europe’s energy portal. http://www.energy.eu. [42] SPECweb2009 E-commerce workload. http://www.spec.org/web2009/.
Íñigo Goiri obtained his Bachelor’s degree in computer science from the University of Lleida in 2006 and his Master’s degree in the Computer Architecture and Network Systems (CANS) Master program at the Technical University of Catalonia (UPC) where he has also started his Ph.D studies. He is currently working at Barcelona Supercomputing Center (BSC) as a researcher staff in the eDragon Research Group.
Josep Ll. Berral obtained his degree (2007) in Informatics [Ingeniería Superior en Informática], and the M.Sc degree in Computer Architecture, Networks and Systems (2008) from the Universitat Politècnica de Catalunya (UPC). He is currently working on his Ph.D, focused on Machine Learning techniques applied to Autonomic Computing, at the Computer Architecture Dept. and Department of Software. Also he is part of the LARCA Research Group (Laboratory for Relational Algorithms, Computation and Learning), cooperating with the High Performance Computing Group. J. Oriol Fitó is a Ph.D student in Computer Science at the Computer Architecture Department of the Technical University of Catalonia (UPC). He obtained his Bachelor’s degree in computer science and the Master’s degree in Computer Architectures, Networks and Systems (CANS) at the UPC in 2007 and 2009, respectively. Moreover, he is currently a research engineer at Barcelona Supercomputing Center (BSC).
731
Ferran Juliá has a Master’s degree in Physics at the University of Barcelona (UB) and a Bachelor’s degree in Computer Science at the Technical University of Catalonia (UPC), where he is currently finishing a Master’s degree in Computer Architecture and Network Systems (CANS). In addition, he works as a researcher at Barcelona Supercomputing Center (BSC). His research interests are simulation and power efficient computing in cloud systems.
Ramon Nou has been working at BSC (since 2006) on the Autonomic System and e-Business Platforms group of BSC until 2008 when he switched to the Storage-system group leaded by Dr. Toni Cortés. He has been working on SORMA EU project and in the XtreemOS EU Project. In 2008, he obtained his Ph.D. with Prof. Jordi Torres as advisor in the topic ‘‘Using online simulation to improve QoS on middleware’’. He has published 15 papers in international conferences and workshops, and has one journal paper. Ramon has a wide view on all computer levels, with expertise on optimization, performance measurements and simulation/modeling of complex systems. Now he is also collaborating with the Autonomic System and e-Business Platforms group in the simulation of large cloud systems focusing on energy efficiency.
Jordi Guitart received the MS and Ph.D degrees in Computer Science at the Technical University of Catalonia (UPC), in 1999 and 2005, respectively. Currently, he is a collaborator professor at the Computer Architecture Department of the UPC and an associate researcher at Barcelona Supercomputing Center (BSC). His research interests are oriented toward innovative resource management approaches for modern distributed computing systems. He is involved in a number of European projects.
Ricard Gavaldá is a professor at the Departament de Llenguatges i Sistemes Informàtics, Universitat Politècnica de Catalunya. His interests are Algorithmics of Data Mining and Machine Learning, Computational Learning Theory, and Computational Complexity. Recently, he has been also interested in applying mining and learning techniques to the computer system management, with emphasis on energetic efficiency.
Jordi Torres is a full professor at UPC and is a manager for the Autonomic Systems and eBusiness Platforms research line in Barcelona Supercomputing Center (BSC). His current principal interest as a researcher is making IT resources more efficient to obtain more sustainable IT. He has worked in a number of EU and industrial research projects. He has more than a hundred publications. He has been Vice-dean of Institutional Relations at the CS School, and currently he is a member of the UPC Board of Governors.