V. Dhivya et al. / International Journal of Engineering and Technology (IJET)
ENERGY EFFICIENT AND SAFE VALVE TESTING UNIT USING WIRELESS TECHNOLOGIES V. Dhivya1, R.Muthaiah2 1,2
School Of Computing, SASTRA University, Thanjavur, Tamil Nadu, India 1
[email protected] 2
[email protected]
Abstract: The valve testing unit is a high pressure test equipment to test the valve manufactured in industries. Valves are tested to ensure that they sustain high pressure in the range of 10000 to 15000 PSI for the required amount of time without any leakage. It has few drawbacks such as inefficient usage of power, fatal accidents due to the proximity of the users with the testing unit to note the valve pressure during operation. It is much dangerous for the industry personnel to note the valve pressure for every minute during operation. There are chances of bolts fitted in the valve thrown away due to the issues in the bolt fittings and the immense pressure inside the valve. Therefore in order to avoid fatal accidents and to improve the industrial safety an efficient valve testing unit is designed and developed using ZigBee wireless transmission technology. The proposed efficient pressure monitoring unit uses emerging technologies like ZigBee, RFID along with ARM 7 processor. The proposed system uses LabVIEW software to develop the monitoring unit in PC. ZigBee wireless transmission technology is used for remote monitoring of valve pressure for every minute. RFID module is used for uniquely identifying the valve and to track the test results. The proposed unit saves energy by sending a signal to turn off the air driven booster pump once the prescribed pressure level is reached. The proposed unit also indicates the oil level of the test unit which avoids the manual intervention to verify the oil level and also detects issues in the bolts fitted in the valve by using a distance sensor which is to avoid fatal accidents by stopping the valve testing unit. Keywords: Industrial Monitoring, ARM 7, RFID, Pressure Sensor, Distance Sensor, ZigBee. I. INTRODUCTION As more and more emphasis is growing in Industrial testing, it is evident that the industrial testing units have to be modernized to improve performance, industrial safety and energy savings. In order to improve industrial safety, wireless technology can be utilized in manufacturing industries for the operating personnel to perform remote monitoring have been detailed by Wen-Tsai Sung et.al. [1]. Traditional monitoring systems have heavily relied on the readings noted down by the operating personnel and these readings are error prone. To have an efficient methodology in place for errorless results, wireless monitoring system is proved to be the right choice as detailed by Mohd Fauzi Othman et.al. [2]. ZigBee based wireless monitoring system is increasingly accepted to monitor various parameters in industrial production as detailed by Luciano Boquete et.al. [5]. Energy efficient mechanisms are gaining ground in wireless monitoring using multiple sensors by turning off the systems in an intelligent way is discussed by Essa Jafer et.al. [6]. In any manufacturing industry, the component wears have to be verified for acceptable level which can avoid fatal accidents. The bolts fitted in the valve have to be verified for any wear issue which could be blown away while the valve testing unit is in operation due to the immense pressure maintained inside. Monitoring the wear of the components in machines is gaining importance and the unacceptable wear can be detected using sensor information as discussed by Hans-Christian Mohring et.al. [3].The issues in the bolts fitted in the valves can be identified by employing infrared based distance sensors. Infrared sensor based distance sensors are proved to be effective in terms of less response time, accurate measurement of distance as discussed by G. Benet et.al. [7]. Need of the hour in any industrial application is efficiency and control which can be accomplished by the use of RFID. RFID can be used to control the tracking of the objects and to improve the efficiency as discussed by Chun-Ta Tzeng et.al. [4]. In any industrial site, testing is a critical stage of a product life cycle which will ensure the quality of the end product before installing it in the production environment. The valves produced by the industries needs to be tested for withstanding immense pressure. Hydraulic medium is used to create pressure inside the valve and the valves will be tested manually for porous leakage and threaded leakage. During the course of testing, the operating personnel have to be in the proximity of the testing unit which has high risk of fatal accidents. The risk of fatal accidents increase when there are wear issues in the bolt fitted with the testing unit.
ISSN : 0975-4024
Vol 5 No 2 Apr-May 2013
719
V. Dhivya et al. / International Journal of Engineering and Technology (IJET)
The idea of the proposed system is to automate the pressure sensing mechanism, to detect the proper fittings of bolts in the valve and to sense and provide alert when the oil level is minimum. The test results of the valves are tracked electronically with the help of passive RFID tags instead of maintaining it in ledgers which are error prone in mapping the results with the valves. LabVIEW program is used to monitor the vital parameters of the proposed system. The proposed system employs ZigBee, a wireless technology to reduce the proximity of the personnel involved in testing and also uses distance sensor to find the properness of the bolts fitted in the valve. II.
SYSTEM ARCHITECTURE
A. Existing System The valve is mounted on the valve testing unit by clamping it and the pressure that the valve has to withstand is preset in the unit. The pressure is increased gradually through the air driven booster pump which keeps on pumping water and the pressure is manually read in the pressure gauges. The pump will be stopped once the pressure reaches the preset pressure manually. The pressure inside the valve is read by the pressure gauge and the readings are manually noted. The oil level is verified manually to refill oil if the oil level is below the system operational settings. B. Proposed System
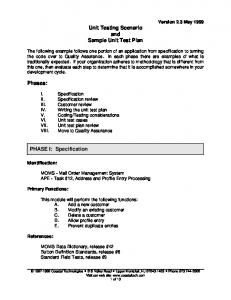
Fig 1 Master Unit Block Diagram
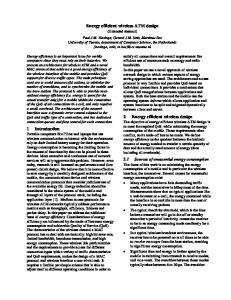
Fig 2 Sensing Unit Block Diagram
The proposed system is aimed at improving the efficiency of the existing system and reducing the proximity of the operating personnel with the testing unit. The system consists of sensing unit and the master unit. The sensing unit comprises of arm 7 microcontroller, ZigBee transceiver, RFID reader, pressure sensor, level sensor and distance sensor .The master unit has ZigBee transceiver and PC (LabVIEW).The pressure level alert, oil level alert and the bolt distance alert are transmitted to the master unit. The sensing unit which has the ARM 7 microcontroller controls the valve testing based on the pressure level, oil level and bolt fittings. The air
ISSN : 0975-4024
Vol 5 No 2 Apr-May 2013
720
V. Dhivya et al. / International Journal of Engineering and Technology (IJET)
driven booster pump will pump water in to the valve gradually and will be made to turn off by the proposed system to save power once the preset pressure level is reached. The proposed system uses IEEE 802.15.14 standard 2.4 GHZ based ZigBee transceiver to transmit the pressure sensed from the valve to the PC every minute. The pressure sensed from the valve will be used for pressure withstanding analysis of the valves tested. The valves are tagged with RFID tags to track the pressure withstood by the valves electronically. One of the preconditions of the valve testing unit to be operational is the oil level of the unit. The oil used in the valve testing unit will be sensed by the level sensor for signaling low oil level for the testing personnel to refill oil. There are high chances of the fatal accident due to the immense pressure applied in the valves and bolts fitted in the valves are prone to be thrown away. To avoid fatal accidents, the proposed system employs distance sensor to diagnose the bolt wear issues. III.
HARDWARE IMPLEMENTATION
A. Master Unit The function of master unit is to gather the sensed pressure data every minute, level of oil sensed and the bolt distance in the valve and serially transmit it to the PC using RS232 Standard. The master unit implemented in the proposed valve testing unit has Personal Computer, XBee Transceiver Module, MAX232 Driver/ Receiver, DB9 Connector. The XBee transceiver is connected to the Personal Computer through RS232 serial communication standards. The XBee is interfaced with MAX232 dual driver/receiver. The MAX232 driver converts the CMOS/TTL voltage level (0V to 5V) to 7.5V required for the RS232 serial communication. The MAX232 receiver converts the voltage signal received from RS232 which is of 25V to the CMOS/TTL voltage level. The DOUT pin of XBee is connected to the MAX232 to serially communicate to the PC to display the pressure level of the valve. The DIN pin of XBee will receive the input pressure level from the PC through MAX232 receiver using RS232 standard. The DIO6, DIO7 and DIO11 are used for communicating with the XBee module of the sensing unit wirelessly to send/receive pressure and oil level data. B. Sensing Unit The responsibility of the sensing unit is to sense the pressure that is being maintained in the valve, oil level and improper bolt fittings if any to transmit it to the master unit using xbee transceiver. The sensing unit consists of pressure sensor, level sensor, distance sensor, ARM7 based LPC2148, RFID module and Xbee transceiver. For experimental purpose, the proposed system is tested using PK 80083 pressure sensor, LDR based level sensor and SHARP GP2Y0A21YK distance sensor. PK 80083 pressure sensor is connected to ADC channel of ARM7 microcontroller. SHARP GP2Y0A21YK distance sensor is used to identify the issues in the bolt. The distance sensor measures the distance between the bolt head and the stationary sensor. When the bolt is screwed initially the distance between the bolt head and the valve is noted as threshold distance. This threshold value is stored programmatically. When the testing unit is under operation the threshold value is compared with the bolt distance that is fitted in the valve. When the sensed distance is larger than the threshold distance, it is because of the bolt that got unscrewed due to manufacturing or wear issues and the valve testing unit will be turned off to avoid fatal accident. The LDR, HD LED assembly based level sensor is used to find the oil level of the valve testing unit to alert when the oil level is low. The RFID module uses passive tags attached with each valve which will not have internal power supply. The incoming RF signal provides the required power for the CMOS IC in the tag to transmit response. This RFID module is interfaced with the UART1 of ARM. The DT125R is a proximity OEM reader has a built-in antenna operates in the industry standard frequency of 125 KHZ. ZigBee is based on IEEE802.15.4 specification and operates at 2.4 GHZ frequency band. The indoor range is up to 133 feet with the operating temperature of -40 to 85 degree Celsius. The valve testing unit has two XBee transceiver one at the sensing unit and the other at the master unit. The XBee in the sensing unit transmits the valve pressure every minute to the XBee receiver at the master unit. The XBee in the sensing unit is interfaced with the UART0 of the ARM microcontroller. IV. SOFTWARE IMPLEMENTATION Laboratory Virtual Instrument Engineering Workbench (LabVIEW) software is used to record the measured data. The vital parameters of the valve testing unit (pressure level, oil level and the bolt distance level) are monitored in the user- interface of the LabVIEW. IAR 4.4 development environment is used to program LPC2148 controller. LabVIEW Block diagram is shown in figure 3 and figure 4. VISA runtime is used to connect to the serial port of the PC.
ISSN : 0975-4024
Vol 5 No 2 Apr-May 2013
721
V. Dhivya et al. / International Journal of Engineering and Technology (IJET)
Fig 3 LabVIEW block diagram1
Fig 4 LabVIEW Block Diagram2
ISSN : 0975-4024
Vol 5 No 2 Apr-May 2013
722
V. Dhivya et al. / International Journal of Engineering and Technology (IJET)
V.
FLOW DIAGRAM
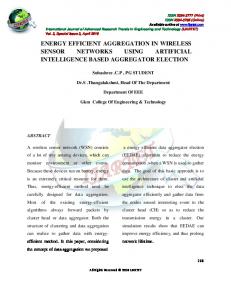
Fig 5 Flow diagram of the proposed system
STEP 1: RFID reader in the sensing unit reads the RFID tag to identify the valve. STEP 2: A check is done to see if the oil level measured by the LDR - HD LED assembly reached its minimum level, if so a signal will be sent to stop the pump. STEP 3: Pressure inside the test job will be sensed by the pressure sensor PK 80083 STEP 4: A threshold pressure will be set through the LabVIEW form in the PC attached to the Master Unit. STEP 5: A check is done to see if the pressure sensed by the pressure sensor in the sensing unit is equal to the threshold pressure, if so a signal will be sent to stop the pump. STEP 6: When the pressure inside the test job in increased using the pump, the distance sensor GP2Y0A21YK is used to identify the properness of the bolt fitted in the valve. If the distance reaches the threshold distance, a signal will be sent to stop the pump to avoid fatal accidents. If not, the pressure sensed is recorded in the LabVIEW form.
ISSN : 0975-4024
Vol 5 No 2 Apr-May 2013
723
V. Dhivya et al. / International Journal of Engineering and Technology (IJET)
VI. RESULTS AND DISCUSSION The Hardware setup of the master unit is shown in the fig 6.The Xbee transceiver is connected serially to the PC using MAX232 IC and RS232 cable. The Hardware setup of the sensing unit is shown in fig 7.
Fig.6.Hardware of Master Unit
Fig.7.Hardware of the Sensing Unit
ISSN : 0975-4024
Vol 5 No 2 Apr-May 2013
724
V. Dhivya et al. / International Journal of Engineering and Technology (IJET)
Fig.8. LabVIEW Front Panel
The recorded data were presented in the user-interface of the LabVIEW is shown in Figure 8.Valve ID is the RF Identification of valve to be tested. Input Pressure is the pressure set by the user. Oil Level is shown and a button is displayed to show alert if the oil level is out of the threshold range. Pressure meter is shown to display the pressure level of the testing unit as the pressure gets changed frequently. A button with the label ‘Pressure Alert’ is used to alert if the pressure is out the of the threshold range. The table Pressure Status is for capturing the pressure level of the unit on a periodic basis. The Pressure Status is exported as an Excel Sheet by using the in-built Excel export feature of LabVIEW. VII. CONCLUSION The proposed system proves to be effective in avoiding fatal accidents, reducing the proximity of the operational personnel with the valve testing unit and remotely monitoring the pressure withstood by the valves during the process of testing. The future scope of enhancements of the proposed system includes storing the results of the pressure withstood by the valves in a centralized database. REFERENCES [1] [2] [3] [4] [5] [6] [7] [8] [9] [10] [11] [12] [13] [14]
Wen-Tsai Sung,Yao-Chi Hsu, “Designing an industrial real-time measurement and monitoring system based on embedded system and ZigBee”, Expert Systems with Applications, Elsevier, Volume 38, Issue 4, April 2011. Mohd Fauzi Othman, Khairunnisa Shazali, “Wireless Sensor Network Applications: A Study in Environment Monitoring System” , Procedia Engineering , Volume 41, 2012 Hans-Christian Möhring, Oliver Bertram, “Integrated autonomous monitoring of ball screw drives”,CIRP Annals - Manufacturing Technology, volume 61, Issue 1, Elsevier 2012 Chun-Ta Tzeng, Yi-chang Chiang , Che-ming Chiang , Chi-ming Lai , “Combination of radio frequency identification (RFID) and field verification tests of interior decorating materials” ,Automation in Construction, Elsevier, Volume 18, Issue 1, December 2008. Luciano Boquete , Rafael Cambralla , J.M. Rodríguez-Ascariz ,J.M. Miguel-Jiménez , J.J. Cantos-Frontela , J. Dongil, “Portable system for temperature monitoring in all phases of wine production”, ISA Transactions, Elsevier, Volume 49, Issue 3, July 2010. Essa Jafer, Christian Serge Ibala, “Design and development of multi-node based wireless system for efficient measuring of resistive and capacitive sensors”, Sensors and Actuators A: Physical, Volume 189, January 2013. G. Benet, F. Blanes, J.E. Simó, P. Pérez, “Using infrared sensors for distance measurement in mobile robots”, Robotics and Autonomous Systems, Volume 40, Issue 4, September 2002. LPC2148 Datasheet available online at http://www.nxp.com/documents/data_sheet/ LPC2141_42_44_46_48.pdf. XBee Datasheet available at http://www.sparkfun.com/datasheets/Wireless/ZigBee/ XBee-Datasheet.pdf. LabVIEW User Manual available at http://www.ni.com/pdf/manuals/320999b.pdf. GP2Y0A21YK0F datasheet available online at http://sharp-world.com/products/device /lineup/data/pdf/datasheet/gp2y0a21yk_e.pdf. PK 80083 datasheet available at http://sensing.honeywell.com/index.php?ci_id=49847.
ISSN : 0975-4024
Vol 5 No 2 Apr-May 2013
725