[1] Akyildiz, Ian F., Pompili, D., and Melodia, T. âUnderwater acoustic sensor .... [36] Rodolfo W. L. Coutinho, Azzedine Boukerche, Luiz F. M. Vieira, and Antonio.
Energy efficient virtual chain based routing protocol for underwater wireless sensor networks
By: Hira Ahmad 731-FBAS/MSCS/F13 Supervised by: Dr. Nadeem Javaid, Associate Professor Department of Computer Science, COMSATS Institute of Information Technology, Islamabad Co-Supervised by: Prof. Dr. Mohammad Sher Department of Computer Science and Software Engineering, International Islamic University, Islamabad
Department of Computer Science and Software Engineering Faculty of Basic and Applied Sciences International Islamic University, Islamabad 2017
Department of Computer Science and Software Engineering International Islamic University Islamabad
Date: 11th August, 2017
Final Approval
This is to certify that we have read the thesis submitted by Hira Ahmad, 731FBAS/MSCS/F13. It is our judgment that this thesis is of sufficient standard to warrant its acceptance by International Islamic University, Islamabad for the degree of MS Computer Science. Committee: External Examiner: Dr. Hassan Mehmood, Associate Professor/Chairman Department of Electronics, Quaid-e-Azam University, Islamabad
_______________________
Internal Examiner: Dr. Ahsan Qureshi, Assistant Professor Department of Computer Science and Software Engineering, International Islamic University, Islamabad _______________________ Supervisor: Dr. Nadeem Javaid, Associate Professor Department of Computer Science, COMSATS Institute of Information Technology, Islamabad _______________________ Co-Supervisor: Prof. Dr. Mohammad Sher Department of Computer Science and Software Engineering, International Islamic University, Islamabad _______________________
ii
Dedication I dedicated this thesis to my parents. I am thankful to my parents and siblings, who have always been there for me whenever I needed them. Their unconditional love motivates me to set higher targets. May Allah bless them all. Ameen
iii
A dissertation Submitted To Department of Computer Science and Software Engineering, Faculty of Basic and Applied Sciences, International Islamic University, Islamabad. As a Partial Fulfillment of the Requirement for the Award of the Degree of MS Computer Science.
iv
Declaration I hereby declare that this thesis “Energy efficient virtual chain based routing
protocol for underwater wireless sensor networks” neither as a whole nor as a part has been copied out from any source. It is further declared that I have done this research with the accompanied report entirely on the basis of our personal efforts, under the proficient guidance of my teachers especially my supervisors; Dr. Nadeem Javaid and Prof. Dr. Mohammad Sher. If any part of the system is proved to be copied out from any source or found to be reproduction of any project from any of the training institute or educational institutions, I shall stand by the consequences.
___________________________ Hira Ahmad 731-FBAS/MSCS/F13
v
Acknowledgement All praise is to Almighty Allah who bestowed upon me a minute portion of His boundless knowledge by virtue of which I able to accomplish this challenging task. I am greatly indebted to my supervisor Dr. Nadeem Javaid, without his priceless supervision, advice and valuable guidance, completion of this thesis would have been doubtful. I am deeply thankful to my co-supervisor Prof. Dr. Muhammad Sher for his encouragement and help during this work. I also offer my profound regard and blessing to everyone who supported me in any respect, during and at the completion stage of this thesis work.
___________________________ Hira Ahmad 731-FBAS/MSCS/F13
vi
Abstract In this work, we present two routing protocols for circular underwater wireless sensor networks (UWSNs); circular sparsity-aware energy efficient clustering (CSEEC) and circular depth-based sparsity-aware energy efficient clustering (CDSEEC) with sink mobility. In CSEEC, we divide circular network area into 5 concentric circular regions. We deployed sensor nodes randomly and placed a static sink at the top of the circular underwater network region. We further sub-divided the 5 concentric circles into 10 regions. Then, we identified sparse and dense regions based on the number of nodes in each region. We used cluster based routing approach in dense network regions and introduced sink mobility in least node density region to achieve balanced energy consumption in the network. In CDSEEC, circular network area is divided into upper and lower semi-circles. Sensor nodes are random uniformly deployed in upper and lower semi-circles and a static sink is placed at the surface of the network region. In upper semi-circle, each sensor node send its sensed data to surface sink using depth information of sensor nodes to achieve energy efficiency by selecting forwarder node with minimum depth. In lower semi-circle, we implement cluster based routing approach in high node density regions and used sink mobility in least density network regions to achieve balanced energy consumption. In UWSNs, uneven distribution of sensor nodes and dynamic network topology creates void holes and high collision probability due to channel interference in dense networks. For avoiding void holes and reducing collision probability, we proposed a virtual chain based routing (VCBR) protocol for UWSNs. In VCBR, we build virtual chains between sensor nodes and sinks to avoid void holes. VCBR also minimizes collision probability which is due to channel interference in the network. The proposed VCBR protocol, introduces a mechanism to forward data packet through best suitable virtual chain to manage the energy resources of sensor nodes efficiently during data communication. The shortest virtual chain between source node and destination is calculated based on the location information of sensor nodes. Furthermore, we also exploit cooperative diversity by presenting two routing protocols (i.e., fixed adaptive cooperative virtual chain based routing (FACVCBR) and incremental adaptive cooperative virtual chain based routing (IACVCBR) to achieve data reliability vii
and prolong network lifetime. In FACVCBR, source node broadcasts data to destination and two relays to achieve diversity which results in data reliability. In IACVCBR, retransmission of data packet is done incrementally to improve data reliability and successful delivery of data packets. In proposed FACVCBR and IACVCBR protocols, we introduce adaptive power control mechanism to utilize energy of sensor nodes in an efficient manner. We validate our propositions via simulations. The results verify that our proposed routing protocols outperform baseline protocols in terms of selected performance parameters.
viii
List of Publications Journal Publications 1. Arshad Sher, Nadeem Javaid, Irfan Azam, Hira Ahmad, Wadood Abdul, Sanaa Ghouzali, Iftikhar Azim Niaz, and Fakhri Alam Khan. “Monitoring square and circular fields with sensors using energyefficient cluster-based routing for underwater wireless sensor networks.” International Journal of Distributed Sensor Networks 13, no. 7 (2017): 1550147717717189. (Impact Factor= 1.239)
Conference Proceedings 1. Hira Ahmad, Nadeem Javaid, Mariam Akbar, and Zahoor Ali Khan. “Virtual chain based routing protocol for underwater wireless sensor networks.” 31st IEEE International Conference on Advanced Information Networking and Applications Workshops (WAINA), Taipei, Taiwan, 2017.
ix
Contents Contents 1 Introduction 1.1 Problem statement . . . . 1.1.1 Research objectives 1.2 Contributions . . . . . . . 1.3 Organization of thesis . . .
ix . . . .
. . . .
. . . .
. . . .
. . . .
. . . .
. . . .
. . . .
. . . .
. . . .
. . . .
. . . .
. . . .
. . . .
. . . .
2 Literature review 2.1 Sink mobility and cluster based routing schemes . . . 2.2 Void hole and energy hole avoiding schemes . . . . . 2.3 Cooperative diversity schemes . . . . . . . . . . . . . 2.4 Cooperative automatic repeat request (ARQ) schemes
. . . . . . . .
. . . . . . . .
. . . . . . . .
. . . . . . . .
. . . . . . . .
. . . . . . . .
. . . . . . . .
. . . .
1 4 6 7 9
. . . .
10 11 17 28 34
3 Proposed schemes: CSEEC, CDSEEC, VCBR, FACVCBR and IACVCBR 3.1 Proposed schemes: CSEEC and CDSEEC . . . . . . . . . . . . . . 3.1.1 Proposed scheme 1: CSEEC . . . . . . . . . . . . . . . . . . 3.1.1.1 Network architecture . . . . . . . . . . . . . . . . . 3.1.1.2 Overview of the proposed scheme . . . . . . . . . . 3.1.2 Proposed scheme 2: CDSEEC . . . . . . . . . . . . . . . . . 3.1.2.1 Network architecture . . . . . . . . . . . . . . . . . 3.1.2.2 Overview of the proposed protocol . . . . . . . . . 3.2 Proposed scheme 3: VCBR . . . . . . . . . . . . . . . . . . . . . . . 3.2.1 Network architecture and assumptions . . . . . . . . . . . . 3.2.2 Overview of the proposed scheme . . . . . . . . . . . . . . . 3.2.2.1 Network setup phase . . . . . . . . . . . . . . . . . 3.2.2.2 Data forwarding phase . . . . . . . . . . . . . . . . 3.3 Proposed schemes: FACVCBR and IACVCBR . . . . . . . . . . . . 3.4 Preliminaries . . . . . . . . . . . . . . . . . . . . . . . . . . . . . . 3.4.1 Network architecture . . . . . . . . . . . . . . . . . . . . . . 3.4.1.1 Enhanced beaconing . . . . . . . . . . . . . . . . . 3.4.1.2 Knowledge sharing phase . . . . . . . . . . . . . . 3.4.1.3 Cooperative virtual chain formation . . . . . . . . ix
39 40 40 40 40 43 43 44 48 48 48 49 52 54 54 55 55 58 61
3.5
3.6
3.4.2 Cooperation model . . . . Proposed scheme 4: FACVCBR . 3.5.1 Path establishment phase 3.5.2 Data Forwarding Phase . . 3.5.3 Adaptive power allocation Proposed Scheme 5: IACVCBR . 3.6.1 Data forwarding phase . .
. . . . . . .
. . . . . . .
. . . . . . .
. . . . . . .
. . . . . . .
. . . . . . .
. . . . . . .
. . . . . . .
. . . . . . .
. . . . . . .
. . . . . . .
. . . . . . .
. . . . . . .
. . . . . . .
. . . . . . .
. . . . . . .
. . . . . . .
. . . . . . .
. . . . . . .
4 Simulation results and discussions: CSEEC, CDSEEC, VCBR, FACVCBR and IACVCBR 4.1 Simulation results and discussions: CSEEC and CDSEEC . . . . . 4.1.1 Simulation parameters . . . . . . . . . . . . . . . . . . . . . 4.1.2 Definition of performance parameters . . . . . . . . . . . . . 4.1.2.1 Network stability period . . . . . . . . . . . . . . . 4.1.2.2 Instability period . . . . . . . . . . . . . . . . . . . 4.1.2.3 Network lifetime . . . . . . . . . . . . . . . . . . . 4.1.2.4 Received packets (at sink) . . . . . . . . . . . . . . 4.1.2.5 PDR . . . . . . . . . . . . . . . . . . . . . . . . . . 4.1.3 Simulations results and analysis . . . . . . . . . . . . . . . . 4.1.3.1 Stability and instability period . . . . . . . . . . . 4.1.3.2 Network lifetime . . . . . . . . . . . . . . . . . . . 4.1.3.3 Network residual energy . . . . . . . . . . . . . . . 4.1.3.4 PDR . . . . . . . . . . . . . . . . . . . . . . . . . . 4.1.4 Performance tradeoffs . . . . . . . . . . . . . . . . . . . . . . 4.2 Simulation results and discussions: VCBR . . . . . . . . . . . . . . 4.2.1 Performance metrics: Definitions . . . . . . . . . . . . . . . 4.2.1.1 PDR . . . . . . . . . . . . . . . . . . . . . . . . . . 4.2.1.2 Energy tax . . . . . . . . . . . . . . . . . . . . . . 4.2.1.3 End-to-end delay . . . . . . . . . . . . . . . . . . . 4.2.1.4 Accumulative propagation distance (APD) . . . . . 4.2.2 Performance metrics: Discussions . . . . . . . . . . . . . . . 4.2.2.1 End-to-end delay . . . . . . . . . . . . . . . . . . . 4.2.2.2 Energy . . . . . . . . . . . . . . . . . . . . . . . . 4.2.2.3 PDR . . . . . . . . . . . . . . . . . . . . . . . . . . 4.2.2.4 APD . . . . . . . . . . . . . . . . . . . . . . . . . . 4.2.3 Performance tradeoffs . . . . . . . . . . . . . . . . . . . . . . 4.3 Simulation results and discussions: FACVCBR and IACVCBR . . . 4.3.1 Performance parameters definition . . . . . . . . . . . . . . . 4.3.1.1 PDR . . . . . . . . . . . . . . . . . . . . . . . . . . 4.3.1.2 Energy tax . . . . . . . . . . . . . . . . . . . . . . 4.3.1.3 End-to-end delay . . . . . . . . . . . . . . . . . . . 4.3.1.4 Packet drop . . . . . . . . . . . . . . . . . . . . . . 4.3.2 Discussions of performance parameters . . . . . . . . . . . . x
62 64 64 65 67 69 70 73 74 74 74 75 75 75 75 75 75 75 76 77 77 78 79 79 80 80 80 81 81 81 82 84 85 87 88 89 90 90 90 91 91
4.3.3
4.3.2.1 PDR . . . . . . . 4.3.2.2 Energy tax . . . 4.3.2.3 Network lifetime 4.3.2.4 End-to-end delay 4.3.2.5 Packet drop . . . Performance tradeoffs . . .
. . . . . .
. . . . . .
. . . . . .
. . . . . .
. . . . . .
. . . . . .
. . . . . .
. . . . . .
. . . . . .
. . . . . .
. . . . . .
. . . . . .
. . . . . .
. . . . . .
. . . . . .
. . . . . .
. . . . . .
. . . . . .
. 91 . 93 . 94 . 95 . 97 . 101
5 Conclusion
103
6 REFERENCES
106
Bibliography
107
xi
List of Figures 1.1
UWSN architecture . . . . . . . . . . . . . . . . . . . . . . . . . . .
3
1.2
Internal architecture of underwater sensor node . . . . . . . . . . .
4
3.1
Network architecture of CSEEC . . . . . . . . . . . . . . . . . . . .
41
3.2
Network architecture of CDSEEC . . . . . . . . . . . . . . . . . . .
44
3.3
Network operation of upper semi-circle . . . . . . . . . . . . . . . .
46
3.4
Network operation of lower semi-circle . . . . . . . . . . . . . . . .
47
3.5
Network architecture of VCBR
. . . . . . . . . . . . . . . . . . . .
49
3.6
Hello packet format . . . . . . . . . . . . . . . . . . . . . . . . . . .
51
3.7
Neighbor table format . . . . . . . . . . . . . . . . . . . . . . . . .
51
3.8
Virtual chain formation . . . . . . . . . . . . . . . . . . . . . . . . .
52
3.9
Flow chart for VCBR protocol . . . . . . . . . . . . . . . . . . . . .
54
3.10 Network architecture of AMTS and FACVCBR . . . . . . . . . . .
56
3.11 Network architecture of IHDAF and IACVCBR . . . . . . . . . . .
57
3.12 Hello packet format . . . . . . . . . . . . . . . . . . . . . . . . . . .
61
3.13 Neighbor table format . . . . . . . . . . . . . . . . . . . . . . . . .
61
3.14 Cooperative virtual chain formation . . . . . . . . . . . . . . . . . .
62
3.15 Cooperation model for FACVCBR . . . . . . . . . . . . . . . . . . .
63
xii
3.16 Retransmission mechanism of IACVCBR . . . . . . . . . . . . . . .
71
4.1
Stability and instability period . . . . . . . . . . . . . . . . . . . . .
76
4.2
Network lifetime
. . . . . . . . . . . . . . . . . . . . . . . . . . . .
77
4.3
Network residual energy . . . . . . . . . . . . . . . . . . . . . . . .
78
4.4
PDR . . . . . . . . . . . . . . . . . . . . . . . . . . . . . . . . . . .
79
4.5
End-to-end delay . . . . . . . . . . . . . . . . . . . . . . . . . . . .
82
4.6
Energy tax . . . . . . . . . . . . . . . . . . . . . . . . . . . . . . . .
83
4.7
PDR . . . . . . . . . . . . . . . . . . . . . . . . . . . . . . . . . . .
84
4.8
APD . . . . . . . . . . . . . . . . . . . . . . . . . . . . . . . . . . .
85
4.9
PDR . . . . . . . . . . . . . . . . . . . . . . . . . . . . . . . . . . .
91
4.10 Energy tax . . . . . . . . . . . . . . . . . . . . . . . . . . . . . . . .
92
4.11 Alive nodes vs network lifetime . . . . . . . . . . . . . . . . . . . .
94
4.12 End-to-end delay . . . . . . . . . . . . . . . . . . . . . . . . . . . .
95
4.13 Packet drop . . . . . . . . . . . . . . . . . . . . . . . . . . . . . . .
97
xiii
List of Tables 2.1
Comparison of clustering and mobile sink based routing schemes . .
15
2.2
Comparison of avoiding void hole and energy hole routing protocols
24
2.3
Comparison of cooperative diversity based routing protocols . . . .
31
2.4
Comparison of cooperative ARQ based routing protocols . . . . . .
36
4.1
Simulation parameters . . . . . . . . . . . . . . . . . . . . . . . . .
74
4.2
Performance tradeoffs . . . . . . . . . . . . . . . . . . . . . . . . . .
79
4.3
Simulation parameters . . . . . . . . . . . . . . . . . . . . . . . . .
80
4.4
Performance tradeoffs of scheme 1: VCBR . . . . . . . . . . . . . .
87
4.5
Simulation parameters . . . . . . . . . . . . . . . . . . . . . . . . .
90
4.6
Performance tradeoffs of schemes 2 and 3: FACVCBR and IACVCBR 98
xiv
Chapter 1 Introduction
1
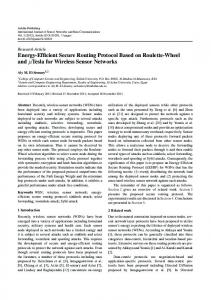
Researchers paying more attention in the field of UWSNs due to its demanding oceanic applications like aquatic environmental monitoring, military surveillance, natural disaster prevention, resource investigations and mineral extraction, etc [1]. Fig. 1.1 depicts that UWSNs consists of small sized sensor nodes equipped with acoustic modem and sinks deployed with both radio and acoustic modems in the area of interest [2]. The internal architecture of underwater sensor node is shown in Fig. 1.2. Underwater nodes are equipped with acoustic modem as results of communications through radio and optical signals in underwater are not adequate due to absorption loss and rapid attenuation, so acoustic signals are used for underwater communication [3]. These acoustic sensor nodes follow a specific routing mechanism to forward the sensed data to sinks while facing a major limitation of power source as sensor nodes are equipped with small size batteries [4]. Once underwater sensor nodes are deployed, the recharging or replacing of their batteries due to harsh underwater environment is very difficult task. However, acoustic waves themselves have some limitations like signal to noise ratio [5], low bandwidth, high bit error rate (BER) [6], multi-path fading and long propagation delay [4]. Therefore, these challenges motivated many researchers to develop many energy efficient routing protocols for UWSNs [7]. Basic architecture of UWSNs consist of sensor nodes randomly deployed underwater and static sinks placed at surface of underwater network field as shown in Fig. 1.1. The sensor nodes send their sensed data to static sinks either by multi-hop communication or direct communication. In multi-hop communication, sensor nodes forward the sensed data to there one hop neighbors until the data 2
Figure 1.1: UWSN architecture reached to sink (surface). Due to noise and link impairments, there is excessive chance of data corruption during multi-hop communication [3]. Moreover, hot-spot problem is created in multi-hop communication because sensor nodes near sinks deplete their energy very quickly [4] and die at the start of the network operation because of which area of interest remains unobserved. To cope with hot-spot problem, mobile sinks are used in many routing protocols [8], [9] for data collection from sensor nodes in there vicinity. Furthermore, in many existing protocols [36], [40]sensor nodes near to sink are frequently selected for data forwarding, due to which unbalanced load of transmission on these nodes creates energy holes in the network [37]. These energy holes in the network causes early death of sensor nodes due to which some areas in the network remain un-sensed which causes coverage hole problem. Whereas in direct communication, nodes at distant positions in the 3
Figure 1.2: Internal architecture of underwater sensor node network also send their sensed data directly to surface sinks which causes quick energy consumption of those sensor nodes. The sensor nodes at distant position dies earlier and causes coverage hole problem. The mobile sinks are better to collect information from sensor nodes at minimum distance in order to avoid coverage hole problem [11].
1.1
Problem statement
In the past, many energy efficient routing protocols like sparsity-aware energy efficient clustering (SEEC) [9], energy efficient depth based routing (EEDBR) [10], energy efficient and balanced energy consumption cluster based routing (EBECRP) [12] and balanced energy efficient circular (BEEC) [13] routing protocols have been proposed. In SEEC, network field is logically divided into 10 regions of same size. The regions are then categorized into dense and sparse regions. In order to avoid coverage hole problem, two mobile sinks are introduced in low node density regions in the network. In existing routing scheme, clusters are formed with different node 4
density due to random deployment of sensor nodes. This type of clustering results in unbalanced transmission load of sensor nodes on cluster heads (CHs) in the network. As sensor nodes in each cluster, send data packets to CHs instead of sending it directly to the sink, and CHs then communicates to the base station (BS) through multi-hoping. This type of communication process rapidly depletes CHs energy, due to which network lifetime decreases. Thus, we proposed CSEEC and CDSEEC routing protocols to overcome the deficiencies of SEEC and achieve better network lifetime. In depth based routing [14] high packet drop is due to void hole problem in low node density regions. Moreover, high collision probability which is due to channel interference is not considered in dense network areas. Avoiding void hole problem in sparse network and reducing collision probability due to channel interference in dense network are very challenging tasks. Many routing protocols like interference-aware routing (Intar) and a reliable and interference-aware routing (Re-Intar) protocols [15] are proposed to tackle void hole problem with their main concern to improve network performance. In Intar, long propagation paths are selected to avoid void holes and reduce collision probability due to channel interference. To improve the performance of Intar, Re-Intar employs one-hop backward transmission in order to avoid void holes and achieve improved packet delivery ratio (PDR). However, using backward transmissions for avoiding void hole consumes more energy and maximizes end-to-end communication time in the network as data packet is moving one hop away from its intermediate destination. Therefore, we proposed VCBR to avoid void hole in node density region and reduce the 5
probability of collision in high node density region. To achieve reliable data communication over poor channel conditions, such routing protocols like adaptive transmission mode selection (AMTS) [47] and incremental hybrid decode-and-forward and amplify-and-forward (IHDAF) [55] are proposed to achieve data forwarding with minimum error and data loss. In ATMS, cooperative diversity is incorporated to achieve data reliability by forwarding data based on depth information of sensor nodes. However, using depth information of sensor nodes as a forwarding metric, still there is probability of void zones to occur. In IHDAF, incremental cooperative diversity is implemented to retransmit data through cooperative nodes incrementally when data received from source has error rate greater than pre-defined threshold. It also calculates outage probability on the basis of BER in the network. Furthermore, constant transmit power level for both source and relays is used in [55]. However, forwarding data using cooperative nodes incrementally and different transmit power level for data forwarding does not avoid void hole problem in the network.
1.1.1
Research objectives
Being motivated from the aforementioned problems in existing routing protocols, our main research objectives are: To achieve energy efficiency in the network. To avoid void holes and routing holes in the network. To balance the energy consumption of sensor nodes in the network.
6
To improve data reliability.
1.2
Contributions
In this work, our first contribution is CSEEC protocol. In CSEEC, underwater sensor nodes are deployed randomly in a circular network field which is then logically divided into 5 concentric circles. Each concentric circle is further sub-divided into 2 semi-coronas. After division of circular network field into 10 different size semicoronas, we apply sparsity search algorithm (SSA) and density search algorithm (DSA) as given in [9] to find regions contain less number of nodes and regions with high node density. We introduce sink mobility in low density regions to achieve energy efficiency by collecting data from sensor nodes at minimum distance while clustering technique is implemented in dense regions to overcome the unbalanced transmission load on sensor nodes in the network. Our second contribution is a hybrid protocol called CDSEEC in which the circular network field is logically divided into upper and lower semi-circles. We have random uniform distribution of sensor nodes in the network due to which both semi-circle contains equal number of nodes in it. The lower semi-circle is further sub-divided into 12 regions. We used depth based routing mechanism in the upper semi-circle for data forwarding while in the lower semi-circle, we find regions for implementing clustering technique and mobile sinks movement. In order to achieve energy balancing in the network, we implement clustering in high density regions and introduce sink mobility in low node density regions. Our third contribution is VCBR protocol. In VCBR, we build virtual chains 7
between sensor nodes and sinks to avoid void hole problem. VCBR also minimizes collision probability due to channel interference in the network. Our proposed routing protocol introduces a mechanism to manage the energy resources of sensor nodes efficiently during data communication by selecting best suitable chain for data forwarding. The best suitable virtual chain between source node and destination is selected based on the local knowledge of member nodes. Our fourth and fifth contributions are energy efficient cooperative virtual chain based routing protocols (FACVCBR and IACVCBR) for UWSNs. In sparse network conditions, our proposed routing protocols avoid void holes by establishing cooperative virtual chains between source node and sinks. We also minimize the collision probability due to channel interference in dense network region. We also use a mechanism to select master node and relay node based on maximum residual energy which consumes balanced energy of sensor nodes. Moreover, we adaptively adjust transmission power level of source and relay based on transmission distance with destination node as a result sensor nodes energy is efficiently consumed. In FACVCBR, we employ fixed cooperative relaying technique in order to achieve data reliability and network efficiency in terms of PDR by sending multiple copies of same data to destination. In IACVCBR protocol, on demand based retransmission mechanism is introduced to enhance network reliability. It is an incremental relaying protocol based on adaptive cooperative retransmission mechanism in which relay nodes retransmit data packet on need basis which improves data communication reliability and achieve efficient energy expenditure in the network.
8
1.3
Organization of thesis
This section provides the organization of thesis as follows: Chapter 2 presents a detailed overview of some related work. In chapter 3, our proposed routing protocols are discussed in detail. Chapter 4 validates the performance of our proposed routing protocols through simulations. Chapter 5 concludes our work. Finally, bibliography is provided at the end of this document.
9
Chapter 2 Literature review
10
In this chapter, some existing related protocols are discussed in detail. We categorize existing related work as sink mobility and cluster based routing schemes, energy and void hole avoidance schemes, cooperative diversity based routing schemes and cooperative automatic repeat request (ARQ) based routing protocols.
2.1
Sink mobility and cluster based routing schemes
This section provides detail of some existing routing protocols based on clustering and sink mobility. Table 2.1 shows the achievements and limitations of different routing protocols in detail. An AUV based routing protocol in [8] has been proposed for UWSNs. The authors assumed random deployment of identical sensor nodes in the network. The sensor nodes then perform clustering technique and mutually elect a CH node in each cluster. Each CH node further sub-divided the clusters into sub-clusters and select a primary data gathering node called path node (PN). In order to achieve energy conservation, AUV is introduced to gather data from PN. Thus data collection from PN is done instead of CH as in conventional schemes. Therefore, by using AUV for data collection from PN achieves efficient transmission power consumption of sensor nodes. In [9], authors propose SEEC protocol for UWSNs to increase network lifetime and achieve high network stability. sparsity awareness approach is used to reduce energy consumption by using sink mobility in sparse regions. The authors divide the whole network into 12 rectangular regions and then perform categorization of these regions into sparse and dense regions. Clustering technique is implemented 11
in dense regions to achieve balanced energy consumption. Two mobile sinks are deployed in low density regions to improve network lifetime by incorporating direct transmission for data collection from sensor nodes at minimum distance. Yoon et al., proposed AUV-aided underwater routing protocol (AURP) [11] for UWSNs to maximize packet delivery ratio with minimum energy consumption. In AURP, AUVs and gateway nodes are used to collect maximum data from the network with less energy consumption of the network. AUVs are used as relay nodes for distant data transmission. The gateway nodes collect data from normal nodes and then send it directly to AUVs in its vicinity. In AURP, end-to-end delay is compromised. A three dimensional sink mobility (3D-SM) [17] scheme has been proposed for UWSNs to improve network lifetime. The division of 3D network field into four rectangular cubiod (RC) has done in which MS and currier nodes (CNs) are used to collect data from sensor nodes in each cubiod. The MS is deployed in single cuboid for collection of data while CNs are deployed to gather data from the remaining three cuboid in the network. The data collection process of CNs is similar to that of MS. Therefore, by using CNs and deploying MS to reduce distant transmissions achieve energy conservation in the network at the price of end-to-end communication delay. In [18], authors proposed an AUV based routing protocol for UWSNs to maximizes data reliability in the network. In AEDG, sensor nodes are associated with special nodes (called gateway nodes) using shortest path selection algorithm (SPA) to improve network lifetime. All other nodes are associated with special nodes to 12
forward their sensed data. The special nodes then forward its gathered data to AUV which consume energy efficiently and ensures reliability. Furthermore, least number of normal nodes are associated with special nodes to reduce overloading on it. A mobile geocast routing protocol (3D-ZOR) [19] has been proposed for UWSNs which reduce energy hole problem and consume network energy efficiently. AUV is introduced to collect data from sensor nodes in its vicinity and the geographic zone where AUV resides is called 3-D ZOR. The AUV moves at pre-defined trajectory and gather data from different 3-D ZORs. Sensor nodes use sleep awake mode for data forwarding. The operation of routing protocol relies on two phases. First, the collection of data from sensor nodes within 3-D ZOR and in the second phase waking up those nodes to forward data to AUV in the next 3-D ZOR. Only nodes in the 3-D ZOR forward data to AUV to save nodes power consumption. Umar, A, et al., proposed a depth and energy aware dominating set based algorithm (DEADs) [20] with sink mobility for UWSNs to improve network reliability and efficiency. Two types of mobility patterns are discussed for mobile sink movement: rectilinear and ellipsoidal mobility pattern. The rectilinear mobility pattern of mobile sink achieves better network efficiency than ellipsoidal mobility pattern. The operation of proposed scheme consists of three phases. First, each node finds its one hop neighbors, and attain their depth and residual energy information. Second, source nodes utilizes the neighbors information and select DS and CC nodes for cooperative routing.Finally, source nodes forward their sensed data to mobile sink through their respective cooperative relay nodes. 13
In [21], chain-based routing scheme for cylindrical UWSNs has been proposed to find global optimal path for efficient data forwarding. First, sensor nodes are divided into 4 groups to form interconnected chains for data routing. All the sensor nodes select a chain head in their respective chain for forwarding data to sink. In order to find a local optimal path, sensor nodes are also divided into two groups and form two interconnected chains for data forwarding. Also a single chain is created by interconnecting sensor nodes for routing data in a cylindrical network. The performance of all the chains are then compared to find out the best optimal chain formation process. The simulation results proves that, 4-chain based routing scheme outperform the other two as it selects optimal number of nodes for data transmission and balance the transmission load on sensor nodes. Clustering techniques are implemented in [22] and [23] for routing in UWSNs to improves network lifetime. Cluster based routing protocols comprises of CH selection process and data communication process. First, CH node is elected based on residual energy and position information of sensor nodes. In data communication process, all the cluster members forward data to their respective CH in its range. The CH node then perform the compression of aggregated data and send a composite compressed data packet to sink trough multi-hop communication. Moreover, the collision occurs in data packet transmission is avoided by using time division multiple access (TDMA) technique.
14
Table 2.1: Comparison of clustering and mobile sink based routing schemes Technique
Features
Limitations
Achievements
High Cluster based routDDG [8]
ing, AUVs are used for collection of data from path nodes
Localization
Minimized all
over-
transmission
power of sensor nodes, increased network lifetime
control
packet overhead, adjustment
in
transmission power,
end-to-
end latency
free
protocol, clustering
SEEC [9]
are formed in high
Improved
node density region
work
and sink mobility is
reduced
introduced in sparse
consumption
regions
for
netlifetime, energy
Not efficient for data
sensitive
environment, low throughput
data
collection AUVs are used for relaying data, gateAURP [11]
way nodes used are also used for data collection MS
3D-SM [17]
and
courier
High packet delivery ratio, re-
High end-to-end
duced energy con-
delay
sumption Minimum energy
nodes are used to
consumption
transmit data
sensor nodes
of
High end-to-end latency
Continued on next page
15
Table 2.1 – Continued from previous page Technique
Features
Achievements
Limitations
AUVs are travels in
Mobicast [19]
different 3-D ZORs
Improved
using
throughput,
pre-defined
High
consumption,
trajectory, wake-up
less
sensor
communication
data
nodes
for
collection
in
energy
end-to-end
increased control overhead
time
next 3-D ZOR Cooperative DEADs [20]
nodes
are used for data forwarding to mobile sink
Maximum
High energy con-
throughput,
sumption,
data reliability
stability period
Increased work Calculate Chain based [21]
Less
netlifetime,
local
increased packet
and global optimal
sending rate, de-
Increased routing
chains
creased path loss,
overhead
for
data
collection
transmission loss and
end-to-end
latency Clustering
based
routing, CH selection is based Cluster based [22][23]
on
residual energy and location
informa-
Improved stabil-
High
energy
ity period
consumption
tion, TDMA is used to avoid collision Continued on next page
16
Table 2.1 – Continued from previous page Technique
iAMCTD [24]
Features
Achievements
Currier nodes and
Consume
mobile
energy,
sinks
are
less mini-
used, Optimal num-
mum end-to-end
ber
communication
of
forwarders
are selected
Limitations Decreased throughput
time
An improved adaptive mobility of currier nodes in threshold-optimized DBR (iAMCTD) [24] has been proposed for UWSNs to improve network performance in terms of energy and delay. It calculates forwarding function (FF ) based on signal quality, energy and depth for the selection of data forwarder. The node with maximum FF has high priority to be selected as a next forwarder. In iAMCTD, currier nodes and mobile sink used optimal mobility pattern to minimize distant transmissions and reduce end-to-end delay in delay sensitive application. Moreover, variations in depth-threshold are also used as optimal forwarder selection mechanism. In iAMCTD, network throughput is decreased as data transmissions are reduced by restricting data forwarder nodes in the network.
2.2
Void hole and energy hole avoiding schemes
In this section, we discuss few routing protocols based on avoiding void holes and energy holes in UWSNs as shown in table 2.2. Noh, Y, et al., proposed a hydraulic pressure based anycast (HydroCast) routing scheme [25] for UWSNs. In HydroCast, next forwarder node for data packet is 17
selected based on sensor nodes depth level. In HydroCast, an opportunistic routing paradigm is used to prioritize the next-hop node which maximizes the progress of packets towards the surface sonobuoys. The nodes that receive the packet from current forwarder node set the timer such that the node with shorter timer has a high priority to be selected as a next forwarder node. In HydroCast, a set of next-hop forwarders are identified in order to reduce redundant transmissions in the network. It avoids void region by using a dead end recovery method in which a node search for node to perform backward transmission and maintain a route between source node and sink. HydroCast achieves high PDR and pay the cost of energy and long time propagation because of backward transmission. A voidaware pressure routing (VAPR) protocol [26] has been proposed for UWSNs to forward data to surface sink based on location information of sensor nodes.VAPR uses an opportunistic directional forwarding mechanism to route the packets towards sonobuoy at the water surface. In VAPR, periodic beaconing is used to disseminate sink location information to identify void nodes in the network. Based on these information a directional trail between source node and sink is established. In VAPR, the forwarding direction of current node and next-hop node is used for forwarding of data packet. From multiple directional trails, the shortest available trail is selected on the basis of hop count value. VAPR uses Numbered Distance Condition (NDC) to guarantees loop freedom in case of loop formation. VAPR compromises energy and end-to-end delay to achieve high PDR as data is forwarded through more hops for avoiding void nodes. A channel aware routing protocol (CARP) for UWSNs has been proposed in 18
[27], to avoid void holes by considering link quality and hop count as a forwarding metrics. A node is selected as a forwarder node, if it has high residual energy and a history of successful delivery of packet to its neighbors. CARP also exploits a simple mechanism to avoid loops such that using hop count of a node to be selected as a next forwarder. In CARP, PING PONG control messages are used for data forwarding. CARP increases the transmission power of a node in order to select farther relays which reduce end-to-end delay. It also achieves high PDR by considering link-quality of relay nodes. In CARP, due to control packets overhead network communication cost increases which results in increased energy utilization in the network. Chen, Y. D, et al., proposed a channel-aware depth-adaptive routing protocol (CDRP) [29] for UWSNs to avoid voids and achieve increased PDR. It considers the speed of sound and noise for successful data transmission. The source node construct a virtual ideal path for forwarding of data packets to sink and maintain an ideal path table. Each sensor node then select relays based on one-hop neighbor information for forwarding of data to destination. It sends neighbor information along with data packet to reduce overhead of control messages. CDRP uses backward transmissions for successful data delivery to sink in order to avoid void holes which results increased network energy dissipation. In CDRP, backward transmissions are used to avoid void holes which increases end-to-end propagation time. Relative distance-based forwarding (RDBF) [31] routing protocol has been proposed for UWSNs to minimize energy expenditure and delay in the network. A 19
fitness factor based forwarding metric is used for data forwarding which is calculated based on the transmission distance between sensor nodes and sink. RDBF only selects the nodes whose fitness factor are below a threshold value as a relay for forwarding of data. Thus, less number of nodes participate in data forwarding which control energy resources in the network. Moreover, limited number of nodes at shorter distance from sink are used to forward the data which also reduce data packet communication time in the network. However, the possibility of multiple forwarder node selection is occurs which causes redundant data transmission in the network. Ghoreyshi, S. M, et al., proposed an inherently void-avoidance routing (IVAR) [33] protocol for UWSNs to address void hole problem without relying on any positioning system. In IVAR, depth and hop count is considered as a forwarding metrics for data packet forwarding. IVAR inherently eliminates paths that leads to void regions and have no need to use a recovery mode procedure. It employs a fitness factor and select a node with higher fitness value as forwarding node. In IVAR, nodes propagates periodic beacons to share their local information to their neighbors for optimal forwarding node selection. Every node sets timer to propagate beacon message in the network. When the assigned beacon time expires, each node then propagates a beacon message with new timer containing its local information. IVAR achieves high PDR at the cost of high computational overhead and delay. An adoptive hop-by-hop vector-based forwarding (AHH-VBF) [34] routing protocol have been proposed for sparse UWSNs. In AHH-VBF, the forwarding region 20
of each sensor node is dynamically adjusted hop-by-hop according to the pipeline radius. It employed a cross-layer approach to adoptively adjust the transmission power and pipeline radius of forwarding nodes in order to prolong network lifetime by optimizing energy efficiency in the network. In AHH-VBF, packets holding time is used to minimize collision probability at receiver due to redundant packets transmission. AHH-VBF achieves high data delivery ratio at the expense of energy utilization and delay due to computational cost and holding time calculation. Jiang. J, et al., proposed two geographic multi-path routing protocols named as greedy geographic forwarding based on geospatial division (GGFGD) and geographic forwarding based on geographic division (GFGD) [35] for UWSNs. The 3D underwater network is first divided logically into small cubes and then the data packets from unit small cubes (SCs) are collaboratively transmitted towards sink. For data forwarding first a next target cube is selected and then a next hop mode in that target cube is selected for forwarding of packet. Furthermore, a duty-cycled model is used in which all the sensor nodes collaboratively switch to sleep mode in order to conserve energy in the network. The next hop node selection criteria is based on residual energy, transmission time and path loss factor. In GGFGD, the source node finds next hop node whose SC’s Euclidean distance with sink node is minimum as compared to its own SC. On the other hand in GFGD, the forwarding node selection criteria is based on transmission distance between source node and destination. In case of increased number of SCs, GGFGD consumes more energy as compared to GFGD. Both GGFGD and GFGD achieves data reliability and minimized energy expenditure at the expense of delay due to the selection of long 21
propagation path for data packets. A geographic and opportunistic routing with depth adjustment-based routing (GEDAR) [36] protocol has been proposed for UWSNs which avoids void holes in the network. In GEDAR, next forwarder node is selected based on position information of neighbor nodes. Moreover, a recovery mode procedure is used to avoid void hole in which depth of void nodes are adjusted to maintain routes between source ode and destination. If a node has no neighbors in its transmission range it announces itself as a void node and identifies its new depth based on neighbor node position information. GEDAR achieves maximum network throughput using depth adjustment mechanism at the cost of increased delay in the network. Latif et al., proposed an energy hole and coverage hole avoidance [37] routing protocol for UWSNs to maximize network lifetime and throughput. In this protocol, depth and residual energy based forwarding metric is used for data packet forwarding. A node having smaller holding time as compared to neighbor nodes is selected to suppress redundant transmissions. Moreover, a hole repair technique is used in which the connectivity between nodes is maintained which maximize network lifetime. AAn adaptive transmit power level is introduced to improve energy efficiency in the network. Thus, it pay the cost of long delay and increased computational overhead for repairing coverage and energy holes in the network. Authors design a routing protocol to avoid energy hole in [39] for UWSNs to achieve energy balancing and increase lifespan of the network. In this protocol, transmission load between sensor nodes are evenly distributed by considering load weight of each next hop node. Moreover, the transmission range of each sensor 22
nodes are dynamically adjusted that leads to fair energy dissipation in the network. In this scheme, by reducing energy hole problem improved network lifespan with balanced energy utilization of sensor nodes is achieved in the network. A weighting sum of two hop depth difference based routing protocol called weighting depth and forwarder area division DBR (WDFAD-DBR) [40] protocol have been proposed for UWSNs to reduce void holes in the network. The depth of current hop and next expected hop is considered as a forwarding metric for data forwarding to effectively reduce void holes. A mechanism to reduce duplicate packets transmission is incorporated by dividing forwarding area which in tern decreases energy consumption in the network. Moreover, surplus energy consumption due to periodic neighbor requests is reduced by introducing neighbor prediction mechanism in the network to improve the network lifetime. Chien-Fu Cheng, et al., proposed a routing protocol for data gathering problem with data importance consideration [41] for UWSNs. Nodes near to sink depletes their energy very quickly due to high load of data forwarding from deep underwater nodes due to which energy hole problem occurs. The imbalance energy expenditure of underwater nodes due to multi-hop transmission in deep water is also effectively mitigated by introducing AUVs for collection of data from deep underwater nodes. It identifies the importance level of data and then gather data in a distributed manners and a mechanism to swap layers is introduced to effectively solve long time delay and imbalance energy consumption problems. By introducing AUVs for data collection improved network performance is achieved by increasing network lifespan and PDR with reduced delay in the network. 23
Table 2.2: Comparison of avoiding void hole and energy hole routing protocols Technique
Features
Achievments
Limitations High
energy
expenditure Hydrocast [25]
Considers depth as a forwarding metric
Increased PDR
and
end-to-end
communication delay
Considers sequence number, hop count, VAPR [26]
and depth information as forwarding
Increased energy Attain loop freedom, high PDR
utilization
and
propagation delay
metrics Distributed layered
crossrouting
protocol, it consider CARP [27]
hop count, quality of link and history of successful deliv-
Increased Increased
PDR,
work
decreased end-to-
cation
end delay
well
net-
communicost as
as
energy
consumption
ery of packet as a forwarding metrics High
energy
dissipation, long CDRP [29]
Construct a virtual
Achieve increased
ideal path for for-
PDR, reduces de-
warding of data
lay
end-to-end propagation
delay
due to backward transmissions Continued on next page
24
Table 2.2 – Continued from previous page Technique
Features Fitness factor of sen-
RDBF [31]
sor nodes is used as a forwarding metric
Achievements
Limitations
Improved
Increased redun-
throughput,
dant
minimized
end-
transmis-
sions, high energy consumption
to-end delay
Consider hop count and depth of sensor nodes as a forwarding metrics, uses fitIVAR [33]
ness factor to eliminate routes leading to void regions
Increased Achieve increased PDR by avoiding void holes
end-
to-end delay and high
computa-
tional cost
and has no need to switch to recovery mode Cross-layer
ap-
proach is used to adjust the forwarding region of each sensor node by adAHH-VBF [34]
justing transmission power and pipeline radius, holding time is
calculated
reduce
the
Increased Achieve increase
to-end
data delivery ra-
nication
tio
high
endcommutime, energy
expenditure
to colli-
sion probability at receiver Continued on next page
25
Table 2.2 – Continued from previous page Technique
Features
Achievements
Logically
Limitations
divide
network area into small cube spaces in order to collaboratively
forward
data packets, DutyGGFGD, GFGD [35]
cycled
model
is
used for data forwarding,
GGFGD
Long end-to-end Increased reliabil-
propagation delay
ity and minimum
due to selection of
energy consump-
long propagation
tion
routes for data forwarding
uses distance while GFGD uses relative position information for data forwarding A
greedy
oppor-
tunistic
based
approach GEDAR [36]
depth recovery
is
used,
adjustment procedure
High end-to-end Maximum
net-
work throughput
communication delay
is used to routes data packet to sink Depth Energy and coverage hole avoidance scheme [37]
ual
and
resid-
energy
based
Maximum
net-
High
rout-
forwarding is used,
work lifetime, im-
ing
coverage and energy
proved
increased end-to-
hole repair technique
put
through-
overhead,
end delay
is incorporated Continued on next page
26
Table 2.2 – Continued from previous page Technique
Features
Achievements
Limitations
Transmission load is evenly Energy hole avoidance scheme [39]
distributed
between nodes based
Balanced energy
on load weights of
consumption, im-
High end-to-end
each next hop node,
proved
delay
adaptive adjustment
lifespan
of
network
transmission
range occurs Localization
free
depth based rout-
Unbalanced
ing, weighting sum
WDFAD-DBR [40]
energy consump-
depth difference of
Improved
current
throughput,
hop
and
tion,
depth nodes die
next expected hop
minimum end-to-
is used to forward
end delay
data,
earlier, not efficient
duplicate
packet
medium
for
dense
network
suppression
mechanism is used AUVs
are
intro-
duced for collection of data from different Energy hole avoidance algorithm [41]
layer
in
Consume
distributive manner,
anced
AUVs swap in dif-
minimum
ferent layer depends
high PDR
on of
the
amount
information
at
different layer
27
balenergy, delay,
Increased trol
con-
messages
overhead
2.3
Cooperative diversity schemes
In this section, a few cooperative diversity schemes that mitigate fading in harsh underwater environment are discussed in detail as given in table 2.3. In [42], a best relay selection protocol is proposed for UWSNs to maximize network throughput. The best relay selection process is based on the channel gain and transmission time. Furthermore, a mechanism for BER minimization is also presented in this work. Optimal power is allocated to source and relay for reducing error rate in the network. A cooperative best relay assessment (COBRA)scheme [43] has been proposed for UWSNs to reduce data packet transmission time. The selection of best relay in this algorithm is based on the information of the channel condition. Moreover, end-to-end path between source and destination is reduced which results in reduced data packet transmission time and achieve maximum PDR. A. Umar, et al., proposed a cooperative routing protocol with the selection of partner node [44] for UWSNs. It uses depth of source and destination and SNR of the link as a selection metrics for selection of partner nodes. The implementation of this scheme significantly improves the network stability period and packet acceptance ratio with reduced delay. A cooperative depth based routing (CoDBR) proposed [45] have been proposed for UWSNs to increase network efficiency and throughput. In CoDBR, the realy node selection criteria is based on the depth information of nodes. In this scheme, two phase transmit mechanism is used for data forwarding. Relay nodes 28
use AF technique for amplification of overheard data before sending it to destination. CoDBR compromises high delay and energy expenditure in the network to achieve increased throughput and network efficiency. Diana Pamela Moya Osorio, et al., proposed an adaptive transmission scheme for amplify-and-forward relaying network called (ATMS) [47] to improve network lifespan and achieve energy conservation in the network. In ATMS, transmission modes for cooperative communication are selected based on the instantaneous channel conditions. Moreover, energy normalization per transmitted block is achieved by sharing system total transmit power between source and relay. Considering relay position and transmit power allocation ATMS consume minimum energy and achieve high throughput in the network. The authors proposed a cooperative partner node selection mechanism based on propagation delay for UWSNs [48] to achieve energy efficiency in the network. Optimal number of relays are selected based on SNR of link to achieve better network performance and improve partner node selection algorithm. A self adaptive cooperative routing protocol (SACRP) [49] has been proposed for UWSNs. This scheme performs cooperative transmissions to enhance the link quality which in turn improve the network throughput. Furthermore, adaptive transmission range adjustment is used to reduce end-to-end communication time. SACRP shows significant improvement in terms of delay and PDR. Sheeraz Ahmed, et al., proposed a stochastic performance analysis with reliability and cooperation (SPARCO) [50] for UWSNs. It introduces cooperation and uses SNR based cooperative nodes selection to increase network lifetime and 29
improve PDR with reduced overall network energy consumption in sparse network conditions. In SPARCO, channel quality and distance among neighbor nodes are considered as a relay selection criteria in order to ensure data reliability. Moreover, reduced path loss due single-hop communication and improved network stability period by balancing transmission load in multi-hop communication is achieved in the network. A routing protocol called on energy efficiency in UWSNs with cooperative routing [51] has been proposed to achieve energy conservation in the network. In this scheme, AF technique is used at the relay node for amplification of signals and fixed ratio combining (FRC) is incorporated at receiver node as a cooperative combining technique to combine the received signals. It uses link quality information and transmission distance for the selection of relay nodes. Moreover, the transmission power of source and relay nodes are adjusted depends on the transmission distance with destination node. In this scheme, the utilization of single-hop and multi-hop communication minimized path-loss and improve network lifetime.
30
Table 2.3: Comparison of cooperative diversity based routing protocols Technique
Features
Achievments
Limitations
Channel gain and transmission time is used to select best Best relay node selection algorithm [42]
cooperative
nodes,
Optimal power allocation is used for source and relays to
Improved
net-
work throughput
High
energy
and reduce error
consumption
rate
reduce error rate in the network Cooperative relay COBRA [43]
best
assessment
scheme for UWSNs, CSI is used to select best
relay
among
neighbor nodes Depth of sensor node Cooperative node selection scheme [44]
and SNR of link is used as a partner node selection metrics
Minimize
one
way packet transmission
time,
maximizes
net-
High
energy
consumption and
decreased
network lifetime.
work throughput Increased work
netstability
period, improved
Increased energy
packet
expenditure
accep-
tance ratio and reduced delay Continued on next page
31
Table 2.3 – Continued from previous page Technique
Features
Achievements
Minimum
Limitations
depth
information is considered CoDBR [45]
to
select
High
next hop forwarder
High network effi-
and relay nodes, AF
ciency in terms of
technique is used for
throughput
energy
dissipation
of
nodesand
in-
creased delay
amplification of data at relay and MRC is used at destination For adaptive transmission mode selection channel conditions between source ATMS [47]
and destination is considered.
Total
transmit power is
Minimum energy consumption, in-
High end-to-end
creased
delay.
network
throughput
shared among source and relay. Partner node selection scheme [48]
SNR based relay se-
Less energy uti-
lection algorithm for
lization and re-
optimal number of
duced end-to-end
relay selection
transmission time
Less PDR
Continued on next page
32
Table 2.3 – Continued from previous page Technique
Features
Achievements
Limitations
Transmission range of sensor nodes are adaptively adjusted SACRP [49]
to reduce transmission time, cooperative nodes selection
Minimum end-toend
delay,
im-
Maximum energy consumption
proved PDR
criteria is based on link quality SPARCO introduces SNR
based
coop-
eration to improve
SPARCO [50]
network
perfor-
mance,
channel
quality and distance among
neighbor
nodes are considered as a selection crite-
Minimum loss,
path-
balanced
transmission load
High end-to-end
and
delay
improved
network stability period
ria for relay node selection AF is used at relay and FRC is used at destination, channel quality and transEnergy efficient scheme [51]
mission distance of
Minimum
nodes are used in re-
loss,
lay selection criteria,
network lifetime
transmit power is adaptively adjusted based on transmission distance 33
path-
improved
High end-to-end delay
2.4
Cooperative automatic repeat request (ARQ) schemes
To enhance network reliability and efficiency, cooperative ARQ schemes are proposed by authors in UWSNs. Table 2.4 shows some of the cooperative ARQ schemes that are discussed in the following section. A cooperative automatic repeat request (C-ARQ) [52] routing protocol has been proposed for UWSNs in which cooperative partner nodes are used to provide alternative paths for data transmission in the network. The relay node provide retransmission of erroneous data packet to improve network throughput. Arindam Ghosh et al., proposed a retransmission protocol called cooperative hybrid automatic repeat request (C-HARQ) [53] for UWSNs. In this scheme, error control codes are implemented to improve the network reliability and energy efficiency. Moreover, authors perform Monte Carlo simulations for the validation of performance analysis. In this protocol, high network throughput is achieved at the price of reduced network lifetime. In [54], an adaptive cooperative routing protocol (ACE) is proposed to increase network efficiency in terms of throughput. On demand retransmission mechanism is used to improve reliable data transmission in the network. In this scheme, the relay node performs retransmission of data packet in case of receiving erroneous copy at destination. Thus, load balancing is achieved in the network by allowing relay nodes to retransmit data packet instead of source node. The protocol shows 34
increased network throughput and data reliability at the expense of high energy expenditure. Bai, Zhiquan et al., proposed an incremental hybrid decode-amplify-forward (IHDAF) [55] relaying protocol for UWSNs to reduce error rate in the network. In IHDAF, the relay either transmit data in DF or AF technique or it remain silent depends on the channel quality of source, relay and destination. Moreover, the power allocation strategy for relay node is incorporated to reduce error rate in the network and improve network efficiency. Furthermore, accurate outage probability and BER of IHDAF is derived by considering best relay position and transmit power allocation strategy. In IHDAF, the system performance is improved in terms of BER by selecting appropriate threshold value of SNR at relay and destination. An improved adaptive cooperative routing protocol [56] has been proposed for UWSNs. In this protocol, depth and residual energy information of sensor nodes are used to select both master node and cooperative partner nodes in the network which improves the performance of network in terms of reduced energy and increased throughput. Moreover, retransmission of data at relay nodes occur if the BER of the received data at master node is higher than the pre-defined threshold value.
35
Table 2.4: Comparison of cooperative ARQ based routing protocols Technique
Achievements
Limitations
ing cooperation at
Improved
net-
It does not con-
MAC layer, coop-
work lifetime and
sider link quality
erative relay nodes
throughput
for relay selection
Features Cooperative
re-
transmission routing protocol for addressC-ARQ [52]
provide
alternative
routes
for
data
transmission C-HARQ both tures and C-HARQ [53]
the of
exploits feaC-ARQ
incremental
High throughput,
redundancy-hybrid
increased energy
ARQ scheme, it uses
consevation
Decreased
net-
work lifetime.
an error correction codes to maximize network throughput Continued on next page
36
Table 2.4 – Continued from previous page Technique
Features
Achievements
Limitations
retransmission with
High throughput
Increased energy
relay nodes, retrans-
and
consumption,
mission is performed
network reliabil-
least depth nodes
only
ity
die earlier
It aim to reduce high error rate and enhance throughput
ACE [54]
when
network using
desti-
improved
nation receives an erroneous copy of data
from
direct
transmission Relay node either remains silent depends on the channel quality of source and destination or it transIHDAF [55]
mit data using AF or DF technique, transmit power
alloca-
Data
reliability,
reduce BER in
High
energy
consumption
the network
tion strategy is introduced to reduce error rate in the network Continued on next page
37
Table 2.4 – Continued from previous page Technique
Features Master relay
node
and
nodes
are
Limitations
on
Balanced energy
Depth and residual
consumption, in-
High end-to-end
energy information,
creased
delay
on demand retrans-
throughput
selected Adaptive cooperative scheme [56]
Achievements
based
mission of data is performed
38
network
Chapter 3 Proposed schemes: CSEEC, CDSEEC, VCBR, FACVCBR and IACVCBR
39
3.1
Proposed schemes: CSEEC and CDSEEC
We proposed two protocols, CSEEC and CDSEEC. In CSEEC, we simply deploy SEEC protocol in a circular network regions of different size. While CDSEEC is a hybrid protocol, in which two routing protocols are working simultaneously to get longer network lifetime and stability period.
3.1.1
Proposed scheme 1: CSEEC
In this section, we discuss the proposed protocol CSEEC in detail. 3.1.1.1
Network architecture
In CSEEC, sensor nodes are deployed randomly in a circular network field and then we logically divide the circular network field into 5 concentric circles. Each concentric circle is further sub-divided logically into two regions as shown in Fig. 3.1. We deployed single static sink at water surface and introduce two mobile sinks, mobile sink1 (MS1) and mobile sink2 (MS2) to gather data from sensor nodes that are sparsely deployed in the network field. Both MS1 and MS2 periodically change its position from one region to another to collect data at minimum distance from all the sparsely deployed sensor nodes. 3.1.1.2
Overview of the proposed scheme
The network operation is performed in several rounds. Before start of the network operation, random deployment of sensor nodes in a circular region is done. Initially, all the sensor nodes are provided with same energy resources and are equipped with depth finding module to acquire their depth from water surface. Moreover, MS1 40
Figure 3.1: Network architecture of CSEEC moves periodically from least sparse to sparse regions in the network per round. MS2 collect data from single sparest region, until all the sensor nodes in that region drain their energy. We categorize the network regions into two groups: the region where nodes are sparsely deployed and region where node density is high. The sparsity and density of a region is identified by using SSA and DSA algorithms as used in. [9]. After identifying the sparsity and density of regions, we implement clustering technique in high node density regions for balanced energy consumption in the network. Sensor nodes in each region then elect a node as a CH based on the following three conditions as given in. [9], CHd < Rd
(3.1.1)
Ech > Eave
(3.1.2)
41
rand ≤ T hi
(3.1.3)
In condition1, a node having minimum depth among all other nodes in dense region Rd will be eligible for CH election as shown in eq. 3.1.1. If condition1 is satisfied, then condition2 is checked otherwise the node will consider as normal node. In condition2, the residual energy of node is considered for the election of CH. If a node has greater residual energy as compared to individual sensor node in that region as given in eq. 3.1.2 then the node will be eligible to be elected as a CH. Finally, in condition3 a random number (rand) is generated by each node which then compares it with the pre-defined threshold (Th) value.The Th value is calculated in the same way as the authors did in [9]. It is obvious from eq. 3.1.3 that the rand value must be smaller than or equal to Th. If the rand value is smaller than the Th value then we select a node as a CH for the current round only if it has not been selected as a CH for previous 1/p rounds. All the sensor nodes then forward its data to their respective CH. The CH then forward the aggregated data to any of sink in its vicinity. In our proposed protocol, we also deployed two mobile sinks MS1 and MS2 in low density regions for the collection of data at minimum distance. Both MS1 and MS2 moves in a pre-defined way. MS1 changes its position periodically between two sparse regions in every round except MS2 region. On the hand, MS2 resides single low density region till the last node in that region depletes its energy. After the death of all the nodes occur in that region, MS2 then moves to other low node density region in the network field. Mobile sinks always take center position of each 42
region, because the center position of a region is always lies in maximum sensor nodes vicinity. With sink mobility approach in sparse regions, maximum data collection is achieved with minimum energy consumption. Also, by implementing clustering technique nodes perform minimum distance transmissions to CH instead of forwarding data to static sink through multi-hoping. The CH then sends a composite packet to any sink in its range to achieve energy efficiency and maximum network lifetime. We exploit direct transmission mode in low node density regions by introducing mobile sinks to receive data directly from nodes in that region. Each mobile sink periodically switches its position per round to collect data from sensor nodes belongs to low node density regions. While in low node density regions, the data communication is based on two steps. First all the members of dense region send data directly to respective CH. Then the CH send a single composite packet to surface sink in multi-hop fashion or to any of mobile sink in its transmission range.
3.1.2
Proposed scheme 2: CDSEEC
This section provides the detailed working of our proposed hybrid scheme CDSEEC. 3.1.2.1
Network architecture
Initially, we divide logically the network field into 2 semi-circles. We used random uniform distribution to deploy 100 nodes in the whole network field. The lower semi-circle consists of 3 coronas. The inner corona in the lower semi-circle is large in size as compared to the outer 2 coronas as shown in Fig. 3.2. We have 50 43
sensor nodes in the upper semi-circle and 50 in the lower semi-circle. In the lower semi-circle, the three coronas are further sub-divided into 12 regions. We deploy a static sink at the water surface in the network field.
Figure 3.2: Network architecture of CDSEEC
Initially, nodes are provided with 5 joules of energy. Each sensor node is equipped with depth finding module. We send two mobile sinks to lower semicircle for the aggregation of data from nodes in direct transmission range. 3.1.2.2
Overview of the proposed protocol
We used depth based routing mechanism [14] in the upper semi-circle of the network field as shown in Fig. 3.3. We have N/2 nodes in the upper region, where N be the number of sensor nodes in each semi-circle. Depth based routing is based 44
on greedy algorithm in which source node forward data using depth information of neighboring nodes. First, all the sensor nodes obtains the depth information with the help of depth finding module installed in it. The sensor nodes collect data and also help in relaying data of other sensor nodes to the BS. The sensor nodes send their depth information along with the data to other node. The decision of packet forwarding is based on source depth dc and previous hop depth dp. Upon receiving a data packet, the node compares its own depth dc with dp. If dc is smaller than dp, then the current node will be the next forwarding node for data packet. Otherwise, the packet will be dropped by the current node. There is a possibility that multiple neighboring nodes having same depth dc forwards data packet simultaneously which causes high collision and energy consumption in the network. In this case, a global parameter depth threshold dth is used to restrict the number of forwarding nodes. The packet will be forwarded only if the depth difference between dp and dc is larger than dth. The value of dth may be positive or negative based on network operation. In CDSEEC, we used a large positive threshold value to achieves energy efficiency by restricting nodes near to the sink from data forwarding. With large threshold value, less number of nodes participates in data packet forwarding which control increased energy consumption in the network. In lower semi-circle, we used clustering technique with sink mobility as shown from Fig. 3.4. The lower semi-circle of the network field contains N-N/2 sensor nodes, where N=100 is the total number of sensor nodes in the network. We categorized the lower twelve regions as the region with least number of nodes and 45
Figure 3.3: Network operation of upper semi-circle region with high node density. We then find the region of each node based on sensor node coordinates. For searching of dense and sparse regions we used SSA and DSA algorithms as used in [9]. In CDSEEC, we used clustering technique in four high density regions, and send MS1 and MS2 to eight low density regions for data collection in each region. The number of dense region is smaller than the sparse regions, due to which less energy is consumed in cluster formation and CH selection. Also we used uniform clusters in dense regions due to which unbalanced load on sensor nodes is reduced. The member nodes in each dense region performs the election process to elect a CH node for data aggregation in that region. The CH election process is same as we discussed earlier in our proposed CSEEC routing protocol. Each member node then forward data directly to their respective CH. The CH aggregates data from all its member nodes and send a composite compressed packet directly to any of the mobile sink in its range or send it through multi-hoping to static sink at water surface. 46
Figure 3.4: Network operation of lower semi-circle We introduce MS1 and MS2 for direct data collection from sensor nodes in low density regions in the network. MS1 moves in two least sparse regions and periodically switch its position per round for aggregating data from sensor nodes in that regions. MS1 moves in all the sparse regions other than MS2 region. We deploy MS2 at the center point of a sparest region for the collection of data from all the members of that region. While MS2 remain in a single low density region for data aggregation until the sensor nodes of that region depletes all their energy. Mobile sinks always stop at the center point of the sparse region for data collection to cover the maximum number of sensor nodes. In CDSEEC, sensor nodes located at low density regions directly send their data to mobile sinks at minimum distance because they always take the midpoint position of sparse regions which lies in the transmission range of maximum number of nodes. The introduction of mobile sinks in sparse regions reduces energy consumption in the network. In dense regions, the collection of data from sensor nodes is done by CH node in each region. The CH then send the aggregated data either to surface sink or to any of the mobile sink in its range. 47
In CDCEEC, the two protocols are working simultaneously in the total network field to achieve high network efficiency in terms of improved network lifetime.
3.2
Proposed scheme 3: VCBR
In this section, we discuss the detail of our proposed routing scheme VCBR.
3.2.1
Network architecture and assumptions
In VCBR, we used a multi-sink network architecture [57] which contains number of sensor nodes and sinks as shown in Fig. 3.5. The sinks are static and are placed at water surface. The static sinks equipped with both acoustic and radio modems. The sinks communicates with sensor nodes using acoustic links and radio links are used for connection to other sinks and offshore data center. The data packet received at one sink is assumed to be received at data center. In VCBR, some of the deployed sensor nodes are ficed at water surface called anchored nodes and other are placed at different depth levels in the network field called relay nodes. Anchored nodes sense the network field and send the sensed data to sink through relay nodes. Relay nodes can do both forwarding of data received from anchored nodes and also generates its own data packet. The sink node upon receiving a data packet, forward it to offshore data center.
3.2.2
Overview of the proposed scheme
Our proposed routing protocol VCBR operates in two phases: network setup phase and data forwarding phase.
48
Figure 3.5: Network architecture of VCBR 3.2.2.1
Network setup phase
The network setup phase is further sub-divided into two phases: finding neighbors and chain formation. 1.1) Finding neighbors: Each sensor node identifies its neighbor (nodes with low depth in its range) then calculate its hop number, distance from sink and find its link to sink (direct connection of node with sink) and its neighbor link to sink (neighbor node connection with sink). The sensor nodes that are at minimum distance to any of the sinks (nodes in sink range) has assigned a flag value link-to-sink and these nodes have a direct connection to sinks. When the sensor 49
nodes have neighbors with link-to-sink in its transmission range has assigned a flag value neighbor-link-to-sink. The sensor nodes then share these information with its neighbors using hello packet. Fig. 3.6 depicts the hello packet format which consists of seven fields i.e. node ID, number of neighbors, distance to sink, hops from the sink, depth, and two flags, link-to-sink and neigh-link-sink. The value of both flags will be 0 or 1. Flag 0 represents that the node has neither direct nor indirect connection with the sinks whereas flag 1 shows that sensor node has a connection with sinks. In these two flags, any one of the flags value must be 1 for forwarding of data to sink. When sensor node receives hello packet it stores these information in its neighbor table. The format of neighbor table of each sensor node is shown from Fig. 3.7 which consists of eight fields i.e., NeighID, NumNeighbor, HopSink, DistNeighbor, LinkSink, NeighLinkSink, Depth and Timestamp. Where, NeighID indicates the unique id of each sensor node, NumNeighbor shows the number of each sensor node neighbors, HopSink represents hop number of sensor node from sink, DistNeighbor indicates the Euclidean distance with that neighbor, LinkSink represents direct connection from that neighbor node to sinks, NeighLinkSink represents the connection between the neighbors of that node to sinks, Depth represents the depth difference with that neighbor and Timestamp shows the time to update neighbor entry in neighbor table. Furthermore, sensor nodes send data packets along with hello packet information to reduce neighbor request overhead. The sensor nodes include hello packet information in the header of the data packet. Upon receiving a data packet, each sensor node updates its neighbor table entries. 1.2) Virtual chain formation: Each sensor nodes generate a control 50
Figure 3.6: Hello packet format
Figure 3.7: Neighbor table format packet and send it towards the sinks. The control packet includes the unique id of each sensor node. If any of the sinks receive the control packet within a specific time interval, it sends an acknowledgment back towards that node and forms a virtual chain from that sensor node to sink as shown in Fig. 3.8. If a node does not receive any acknowledgment from sink within a specific time interval, it will send the control packet again towards the sinks. At this time, either the node will receive an acknowledgment from sinks and create a virtual chain or that node will be declared as a void region node. Only those node will be selected as a member of virtual chain if any one of its flags (link-to-sink or neigh-link-sink) value is true. The node with any one of its flags value equal to 1 will be selected as a member of the virtual chain from source node to sink. As shown in Fig. 3.8, there is a possibility of multiple chains formation. The best suitable chain will be selected with the maximum CF value of its member nodes as calculated in eq. (3.1.1).
51
Figure 3.8: Virtual chain formation 3.2.2.2
Data forwarding phase
The source node select a node from its neighbors if it has any one of its link-to-sink or neigh-link-sink flag value equal to 1. The nodes that has either link-to-sink flag or neigh-link-sink flag value equal to 1 are called as Link-PFNs. The sender node then select next forwarder node from its Link-PFNs and creates a virtual chain from source node to sinks. When the network is dense, there is a possibility of multiple chain formation from source node to sinks as shown in Fig. 3.8. The selection of chain for data forwarding is based on CF value of link-PFNs, which is calculated as in [15],
CF (j) =
D(i, j) × dthdif f (i, j) Hop(j) × Neighbor(j)
(3.2.1)
where, Hop(j) shows the number of jth Link-PFN hops from sink, Neighbor(j) 52
represents the neighbors of jth Link-PFN, D(i, j) is the distance between ith source node and jth Link-PFN and dthdif f (i, j) represents the depth difference between ith source node and jth Link-PFN. According to eq. 3.2.1, chain with Link-PFNs having minimum number of neighbors, less number of hops from sink, long distance from the source node and large value of depth difference between source node and Link-PFNs have maximum CF value. As Re-Intar uses backward transmission and select next forwarding node by considering CF value of PFNs to eliminate void hole as shown in Fig. 3.5. However, considering CF value of PFNs for data forwarding does not eliminate void hole problem. Moreover, with backward transmissions an infinite loop is generated which consumes more energy and enlarge end-toend propagation time. We eliminates void holes and reduce collision probability by selecting a chain with Link-PFNs having maximum CF value as a forwarding chain as shown in the Fig. 3.5. Each source node select forwarder chain having maximum CF value based on eq. 3.2.1 for its sensed data packet to forward. Fig. 3.9 depicts that source node first select a Link-PFN having maximum CF value for data forwarding and include its unique id in its data packet. The source node then broadcasts the data packet to nodes in its transmission range. Upon receiving the data packet, each neighbor node in its vicinity compares its id with the unique id received in the data packet. If any of neighbor node id matches the received id only that neighbor node will accept the data packet for forwarding. The same process is repeated at each hop till the packet reaches to any of surface sink.
53
Figure 3.9: Flow chart for VCBR protocol
3.3
Proposed schemes: FACVCBR and IACVCBR
In this section, we discuss the detail of FACVCBR and IACVCBR protocols.
3.4
Preliminaries
This section provides network architecture of our proposed schemes, enhanced beaconing algorithm for beacon message dissemination in the network, knowledge sharing phase, cooperative virtual chain formation process and cooperative model for our proposed routing schemes in detail.
54
3.4.1
Network architecture
We used a cooperative multi-sink network architecture [40] which consists of Nn set of sensor nodes represented as Nn = n1 , n2 , ..., ni ∀i ≤ Nn are randomly deployed underwater and Ns set of sink nodes denoted as Ns = s1 , s2 , ..., si ∀i ≤ Ns are placed at surface of network field as shown in Figs. 3.10, 3.11. Each node is equipped with a acoustic modem for communication its sense data to sinks. We assumed that set of Ns nodes are equipped with acoustic as well as radio modem to communicate with underwater nodes Nn and offshore data center and are also position aware using GPS installed in it. Assuming that sensor nodes know its location information relative to sink nodes. Data packet received at any sink is assumed to be successfully reached data center. In our network, there are three types of nodes: source node S, next hop destination D and relay R. All type of nodes cooperatively transmit data towards the desired destination. Each node establishes its path with closed sink placed at the surface of ocean. The path is established between Nn nodes and Ns via broadcasting beacon message to disseminates the location information of its neighbor nodes and reachable sinks. 3.4.1.1
Enhanced beaconing
Algorithm 1 explains the detail of enhanced beaconing process used in our proposed routing schemes. In beacon message, each sink embeds its unique ID and its location information. In order to identify most recent beacon message, a unique sequence number for each beacon message is used. The depth information of sink is omitted from beacon message as sinks are placed static at water surface and its 55
(a)
(b)
Figure 3.10: Network architecture of AMTS and FACVCBR
56
(a)
(b)
Figure 3.11: Network architecture of IHDAF and IACVCBR
57
movement with water current is negligible. Similarly, each sensor node includes its ID and location information with respect to sink. Moreover, each sensor node also include the location information of its known set of sinks Ns in beacon message. The main goal is to disseminate the location information of all its known sinks to neighbor nodes. Upon receiving a new beacon message from sink, each sensor node updates the corresponding entries of known set of sinks Ns locations. On the contrary, it updates the corresponding entries of Ns if the information received through beacon message from low depth sensor nodes is recent as compared to the stored information in its Ns set. After updating the Ns nodes location information, the flag value of sensor nodes is set to zero which indicates that this information has to be forwarded to neighbor nodes in its vicinity. Furthermore, after broadcasting of beacon message a new timeout is set by sensor node for its next beacon message. 3.4.1.2
Knowledge sharing phase
Every sensor node identifies its neighbors (nodes at low depth in its vicinity) then calculates its number of hops, distance from sink and find its link to sink (direct connection of node with sink) and its neighbors link to sink (connection of neighbor node with sink). The sensor nodes that are within direct transmission range of any sink have assigned a flag value link-to-sink. When sensor nodes having neighbors with link-to-sink in there vicinity, assigned a flag value neigh-link-sink. All sensor nodes then share these information with their neighbors using hello packet as shown in Fig. 3.12. The hello packet consists of eight fields i.e. node ID, number 58
Algorithm 1: Periodic beaconing algorithm 1 Procedure:Broadcast periodic beacon(n) 2 b : new beacon message 3 if timeout of beacon message expired then 4 b.location ← coordinates(n) 5 if n ǫ Nn then 6 for s ǫ (Ns (n)) do 7 if f lagφ → 0 then 8 b.addSink(sqn nums , IDs , Xs , Ys ) 9 f lagφ ← 1 10 end 11 end 12 end 13 Broadcast b 14 Set new timeout 15 end 16 endProcedure 17 Procedure:Received periodic beacon(n, b) 18 if b is from Sink then 19 update(Ns (n), b) 20 else 21 update neigh(b.seq num, b.ID, b.location) 22 end 23 endProcedure
59
of neighbors, distance to sink, hops from sinks, depth, residual energy (ER ) and two flags, link-to-sink and neigh-link-sink. The value of both flags can be 0 or 1. If the value of link-to-sink flag is 0, it means that the node is not directly connected to sink while flag value 1 represents that the node has direct connection to sink. Similarly, value 0 of neigh-link-sink flag represents that the sensor node neighbors have no sink node in its transmission range, whereas if the value of neigh-link-sink flag is 1, it shows that neighbor of sensor node has a connection (i.e. sink in direct transmission range of node) with the sink. If the value of both flags is 0, it represents that the node has neither direct nor indirect connection with the sinks. In these two flags, any of the flag value must be 1 for forwarding of data packet to destination. Sensor nodes that have any one of its flag value equal to 1 is called as potential forwarder nodes (PFNs) with link to sink called (Link P F Ns). When sensor node receives hello packet, it updates this information in its neighbor table. The neighbor table format of each sensor node is shown from Fig. 3.13 which consists of nine fields i.e., NeighID, NumNeigh, HopSink, DistNeigh, LinkSink, NeighLinkSink, Depth, ER and T imestamp. Where NeighID represents the unique ID of each node, NumNeigh represents each sensor node neighbors in its transmission range, HopSink represents number of hops from sink, DistNeigh represents the Euclidean distance with the neighbor, LinkSink represents direct connection of a node to sinks, NeighLinkSink represents the connection of neighbors to sinks, Depth represents the depth difference with neighbors, ER represents the residual energy of node and T imestamp shows the time to update neighbor entry in neighbor table. However, frequent updation of neighbors information shows 60
a significant control packet overhead. Thus, to reduce control packet overhead we use piggy backing approach due to which routing information is dynamically updated. Each sensor node includes hello packet information its data packet.
Figure 3.12: Hello packet format
Figure 3.13: Neighbor table format
Each time a node receives data packet, it first extract hello packet information and update its neighbor entry in its neighbor table. 3.4.1.3
Cooperative virtual chain formation
Sensor nodes with flag (link-to-sink or neigh-link-sink) value equal to 1 will be selected as a member of the cooperative virtual chain which is forming between source node to sink. In cooperative virtual chain, each member node act as a source, as a next-hop or intermediate destination and also as a relay node to cooperatively forward data of other member nodes. As shown in Fig. 3.14, there is a possibility of multiple chain formation in dense network region from source node to sinks. The best suitable chain will be selected having maximum forwarding function (FF ) value of its member nodes among all other chains as mentioned in eq. 3.5.1. 61
Figure 3.14: Cooperative virtual chain formation
3.4.2
Cooperation model
Fig. 3.15 depicts cooperation model consists of three type of nodes: source S, destination D and set of relays (R1 and R2 ). Let Li be set of links suffer rayleigh fading and additive white gaussian noise (AWGN) [44]. The binary phase shift keying (BPSK) modulation scheme is used [44] for modulating and demodulating received data signals at relay and destination. We consider a two-phase transmit mechanism to avoid an overlapping data transmission from source and relays. In phase-I, S broadcasts data to master node D and cooperative nodes R1 and R2 simultaneously. While in phase-II, both R1 and R2 amplify the overheard signals using AF technique and forward it to D. As signals become weak due to path loss, fading and noises in underwater, we use AF technique at relays for the amplification of the received signals. At D, a diversity combining technique called maximal ratio combining (MRC) is used to combine the three independent faded copies of received 62
data [54]. The received signal at relays and destination in phase-I can be written as equations 3.4.1, 3.4.2 and 3.4.3 [45],
Figure 3.15: Cooperation model for FACVCBR
YSD = XS × hSD + nSD
(3.4.1)
YSR1 = XS × hSR1 + nSR1
(3.4.2)
YSR2 = XS × hSR2 + nSR2
(3.4.3)
where, XS represents the original transmitted signal, hSD , hSR1 and hSR2 are the channel coefficients from S → D, S → R1 and S → R2 links [46]. YSD , YSR1 and YSR2 are the received signal at D, R1 and R2 respectively. While nSD , nSR1 and nSR2 are the noise component presents in S → D, S → R1 and S → R2 links [46], respectively. After processing the data received from source node, the relays transmit amplified data to its known destination D in phase-II which can be expressed as equations 3.4.4 and 3.4.5 [45], 63
YR1 D = β × YSR1 × hR1 D + nR1 D
(3.4.4)
YR2 D = β × YSR2 × hR2 D + nR2 D
(3.4.5)
where, β is the amplification factor which is added to the received signals YSR1 and YSR2 at R1 and R2 .
3.5
Proposed scheme 4: FACVCBR
FACVCBR works in two phases; path establishment phase and data forwarding phase.
3.5.1
Path establishment phase
It is shown from Fig. 3.10(b) that an end-to-end path is established between source node and sinks for data packet forwarding. For simplicity, we consider a three node cooperative relaying system consists of source S, destination D and cooperative nodes R1 and R2 as shown in Fig. 3.15. The detail of path establishment phase is given in algorithm 2. The source node S first checks whether it is in the transmission range Rmax of any sink Ns (i.e., LinkSink flag equal to 1) and select that sink as its next hop. S further selects R1 and R2 based on maximum FF value among nodes lies in the common region between S and D as shown in eq. 3.5.1 to cooperatively forward data to sink.
FF (j) =
Ddif f (S, j) × ER (j) Hop(j) × Neighbor(j)
64
(3.5.1)
In the above equation, FF (j) represents the forwarding function of jth Link P F N, Ddif f (S, j) denotes the depth difference between source node S and jth Link P F N (i.e D or R1 or R2 ), ER (j) represents the residual energy of jth Link P F N, Hop(j) shows hop number from sink of jth Link P F Ns and Neighbor(j) represents number of neighbors of jth Link|P F Ns. Where, Hop(j) and Neighbor(j) can not be zero. According to eq. 3.5.1 , a cooperative virtual chain with Link P F Ns having maximum value of depth difference from source node S, maximum residual energy, minimum hop number and less number of neighbors will have maximum FF value. If S is not in the vicinity of any sink, then next hop destination is selected from Link P F Ns in its transmission range Rmax with maximum FF value. In sparse network region, where nodes are randomly deployed, S looks for relays in its transmission range Rmax . In case of more than two Link P F Ns, one destination node D and one relay R1 is selected based on eq. 3.5.1. While in dense network, each node select two relays for cooperative data forwarding as maximum number of Link P F Ns are available in S vicinity.
3.5.2
Data Forwarding Phase
Let us consider Fig. 3.10(b), source node S forward data to sink node Ns through path established in the path establishment phase. The detailed description of data forwarding phase is explained in algorithm 3. Source node S broadcasts original data XS to n1 , r1 and r2 as shown in equations 3.4.1, 3.4.2 and 3.4.3. The relay nodes r1 and r2 then forward the amplified data to next hop destination n1 by adding an amplification factor β to the received data as shown in equations ?? 65
Algorithm 2: Path establishment algorithm 1 2 3 4 5 6 7 8 9 10 11 12 13 14 15 16 17 18 19 20 21 22 23 24 25 26 27 28 29 30 31 32 33 34 35 36 37 38 39 40 41 42 43 44 45 46 47 48 49 50 51 52
S ← T otalnodes for i ← 1 : S do SIN KREACHED ← F alse while not SINKREACHED do if Link Sink of i ← 1 then N exthop ← Sink if N um of Link P F N s not f ound ← T rue then process terminated else L P F N ← T otal Link P F N for k ← 1 : L P F N do Find FF for k end Sort L P F N in descending order with max FF value if L P F N >= 2 then Make 1st L P F N as R1 Make 2nd L P F N as R2 SIN KREACHED ← T rue else if L P F N == 1 then Make 1st L P F N as R1 SIN KREACHED ← T rue else break end end else if N eighLinkSink ← 1 then if N um of Link P F N not f ound ← T rue then Process terminated else L P F N ← T otal Link P F N for k ← 1 : L P F N do Find FF for k end Sort L P F N in descending order with max FF value if L P F N >=3 then Make 1st L P F N as Nexthop Make 2nd L P F N as R1 Make 3rd L P F N as R2 SIN KREACHED ← T rue else if L P F N >=2 then Make 1st L P F N as Nexthop Make 2nd L P F N as R1 SIN KREACHED ← T rue else if L P F N ==1 then Make 1st L P F N as Nexthop SIN KREACHED ← T rue else break end end else break end end end
66
and 3.4.5. They only amplify the data received from S, while their own data is transmitted in their own turn. At next hop destination node n1 , three independent data copies (i.e YSD , YR1 D and YR2 D ) are received from S, r1 and r2 as shown in equations 3.4.1, 3.4.4 and 3.4.5. These independent faded data copies are then combined at n1 using MRC. After combining the received signals, BER of received data packet is calculated at n1 as in [45] and compared with the threshold BERT h . We consider the BERT h value equal to 0.5 which is a maximum acceptable error rate in received data packet. If BER of the received data is minimum as compared to BERT h then n1 will accept the packet, otherwise dropped it. As FACVCBR is a multi-hop network, so at each hop this process is repeated until the data reached to final destination (sinks).
3.5.3
Adaptive power allocation
We adjust transmit power level of source S and set of relays Ri depends on the maximum transmission distance with destination node D from maximum transmit power level Pmax to manage the energy resources of sensor nodes. Source node S and relays R1 and R2 first calculate its distance with D in order to achieve adaptive power control. Moreover, the network lifetime is also prolonged which in turn increases network throughput. Source node S calculates its transmission power level Ps based on transmission distance with D as given in eq. 3.5.2,
Ps =
Dist(S,D) × Pmax Rmax
(3.5.2)
As R1 and R2 are the second and third maximum FF nodes selected by source 67
Algorithm 3: Algorithm for fixed relaying 1 2 3 4 5 6 7 8 9 10 11 12 13 14 15 16 17 18 19 20 21 22 23 24 25 26 27 28
S ← Source D ← Destination Ri ← ∀i = [1 : Rmax ], Rmax = 2 if S.ER > Emin then Broadcast Xsd end if D.ER > Emin then Receive Xsd end if R1 .ER > Emin then Receive Yr1 = Xsd end if R2 .ER > Emin then Receive Yr2 = Xsd end if R1 .ER > Emin then T ransmit Yr1 d end if R2 .ER > Ethr then T ransmit Yr2 d end M RC at destination YD = Xsd + Yr1 d + Yr2 d if YD .BER ≤ BERT h then P acket accepted else T ransmission loss end
68
node as relay nodes to cooperatively forward data to next hop destination D. Thus, they use adaptive transmission power level with respect to source transmit power level Ps to achieve adaptive power control. The adaptive transmission power level for set of relays Ri is calculated as shown in eq. 3.5.3,
PRi =
Dist(Ri ,D) × Ps Dist(S,D)
(3.5.3)
Where, PRi represents the transmit power level of ith relay with respect to source transmit power level Ps .
3.6
Proposed Scheme 5: IACVCBR
We propose IACVCBR to improve the PDR of FACVCBR via retransmissions through cooperative relay nodes. In IACVCBR, adaptive retransmission mechanism is used in cooperative manner to increase the reliability and throughput of existing schemes and FACVCBR. Similar to FACVCBR, the network operation consists of two phases: path establishment phase and data forwarding phase. IACVCBR differ from FACVCBR only in data forwarding phase, which is discussed in the following section in detail. The adaptive power allocation mechanism for IACVCBR is similar to that of FACVCBR protocol. The path establishment phase of IACVCBR is similar to that of FACVCBR as explained in algorithm 2. In this section, the data forwarding phase of IACVCBR is discussed in detail.
69
3.6.1
Data forwarding phase
Fig. 3.16 depicts the data forwarding process of proposed scheme IACVCBR in detail. The source node S forwards data to set of sinks Ns through a multi-hop pre-established path as explained in FACVCBR. Algorithm 4 explains the detail of data forwarding process of IACVCBR protocol. Lets consider Fig. 3.16(a), source node S broadcast its data to next-hop destination D and cooperative nodes R1 and R2 in its transmission range S-1. The data received at D is suffered from multi-path fading and underwater noise. Due to which high BER occurs in the received data. In IACVCBR, we calculate BER of the received data at D and then compare it with the pre-defined threshold BERT h value.If the BER is less as compared to BERT h then D will accept the data packet. Upon acceptance of data packet, D send an ACK to both R1 and R2 as shown in Fig. 3.16(a). Furthermore, R1 and R2 discard the data packet received from S. On the other hand, if the BER is larger than the BERT h , a negative acknowledgment is sent by D to R1 for first retransmission re1 as shown in fig. 3.16(b). R1 then amplify the overheard signal from S and forward it to D. The amplified signal deteriorates its quality due to fading and noises present in underwater. Thus, data received from R1 at D is combined with data received from S using MRC to reduce the effect of fading. The BER of the combined signals are then calculated and compared with the BERT h . If the BER of combined data is smaller than BERT h , then D accept the data packet and send an ACK message to R2 for discarding it overheard data packet. Otherwise, NACK-2 is sent to R2 by D, 70
(a)
(b)
(c)
Figure 3.16: Retransmission mechanism of IACVCBR which then amplify the data and forward it to D as shown in fig. 3.16(c). At D, the BER of combined data is compared with the BERT h . If the BER is minimum as compared to BERT h , then the data packet is accepted and forwarded towards sink. Otherwise, the data packet is dropped and the process will continue with another node. As IACVCBR is a multi-hop routing protocol, so the same process is repeated until data reached to set of sinks Ns as shown in Fig. 3.11(b). The selection of retransmission nodes incrementally increases energy efficiency and prolong network lifetime. Furthermore, due to frequent selection of same retransmission nodes sensor nodes die earlier which creates energy hole problem in existing protocol. Thus, IACVCBR uses ER information of sensor nodes, as result energy is consumed efficiently and reduces energy hole problem.
71
Algorithm 4: Algorithm for incremental relaying 1 2 3 4 5 6 7 8 9 10 11 12 13 14 15 16 17 18 19 20 21 22 23 24 25 26 27 28 29 30 31 32 33 34 35 36 37 38 39 40 41 42 43 44 45 46 47 48 49 50
S ← Source D ← Destination Ri ← ∀i = [1 : Rmax ], Rmax = 2 if S.ER > Emin then Broadcast Xsd end if D.ER > Emin then Receive Y D = Xsd end if R1 .ER > Emin then Receive Y r1 = Xsd end if R2 .ER > Emin then Receive Yr2 = Xsd end if YD .BER ≤ BERT h then P acket accepted Send ACK to R1 else Send NACK-1 for first retransmission to R1 re1 = re1 + 1 if R1 .ER > Emin then T ransmit Yr1 d end if D.RE > Emin then Receive Yr1 d Apply M RC at destination YD = Ysd + Yr1 d end if YD .BER ≤ BERT h then P acket accepted Sent ACK to R2 else Send NACK-2 for second retransmission to R2 re2 = re2 + 1 if R2 .ER > Emin then T ransmit Yr2 d end if D.ER > Emin then Receive Yr2 d Apply M RC at destination YD = Ysd + Yr1 d + Yr2 d end if YD .BER ≤ BERT h then P acket accepted else T ransmission loss end end end
72
Chapter 4 Simulation results and discussions: CSEEC, CDSEEC, VCBR, FACVCBR and IACVCBR
73
In this chapter, we validate the performance of our proposed routing protocols using simulations. We have done our simulations in Matlab simulation tool. For fair comparisons we have used same control parameters to evaluate the efficiency of our proposed routing schemes as compared to existing schemes.
4.1
Simulation results and discussions: CSEEC and CDSEEC
This section shows the performance evaluation of our proposed schemes CSEEC and CDSEEC by comparing it with SEEC, the pre-existing protocol for UWSNs.
4.1.1
Simulation parameters
Simulation parameters are shown in the table 4.1. Table 4.1: Simulation parameters Parameter Value Network Area Number of Nodes Initial Energy Packet Size Transmission Range Number of Rounds
4.1.2
100x100 πr 2 100 5 joules 50 bytes 50 m 3500
Definition of performance parameters
In order to evaluate the performance of our proposed schemes, we consider following parameters.
74
4.1.2.1
Network stability period
The duration of time from beginning till the death of first node in the network is known as stability period. 4.1.2.2
Instability period
The instability period of the network is defined as the time between the death of first node and last node. 4.1.2.3
Network lifetime
The time duration till all nodes die in the network is known as network lifetime. 4.1.2.4
Received packets (at sink)
Number of successful data packets reached to sink per unit time. 4.1.2.5
PDR
PDR is the ratio of received packets to the total number of packets sent.
4.1.3
Simulations results and analysis
Performance of our proposed schemes is evaluated in this section. 4.1.3.1
Stability and instability period
Fig. 4.1 shows stability and instability period of CDSEEC, CSEEC and SEEC respectively. CDSEEC performs better than CSEEC and SEEC in terms of stability and instability period. Because in CDSEEC, we introduce depth based routing with large depth threshold value to reduce energy consumption by reducing the number of forwarder nodes. Furthermore, clusters are used with minimum number 75
100 90 80
Dead Nodes
70 60 50 40 30 20
CDSEEC CSEEC SEEC
10 0
0
500
1000
1500 2000 Rounds
2500
3000
3500
Figure 4.1: Stability and instability period of node density that reduced energy depletion of CH’s in data transmission. The mobile sinks in eight sparse regions also reduced energy consumption of nodes because of direct transmission between sensor nodes and mobile sinks at minimum distance. While, CSEEC performs better than SEEC due to division or network field into different length regions. 4.1.3.2
Network lifetime
Fig. 4.2 depicts that CDSEEC outperform SEEC and CSEEC in terms of network lifetime. A uniform size clusters in CDSEEC are formed as compared to SEEC and CSEEC due to which the energy consumption in CDSEEC is comparatively lower. Moreover, due to large depth threshold value, less number of nodes are involved in data forwarding which also reduce energy consumption in CDSEEC as compare to SEEC and CSEEC.
76
100 90 80
Alive Nodes
70 60 50 40 30 20
CDSEEC CSEEC SEEC
10 0
0
500
1000
1500 2000 Rounds
2500
3000
3500
Figure 4.2: Network lifetime 4.1.3.3
Network residual energy
In Fig. 4.3, better network residual energy is achieved by CDSEEC as compared to SEEC and CSEEC. In CDSEEC, nodes become restricted for forwarding packets to the static sink by using depth based routing scheme. With uniform clusters in CDSEEC, energy is consumed in a balanced manner as compared to SEEC and CSEEC protocols. Also the size of regions are small as compared to SEEC and CSEEC, sensor nodes in sparse region consumes less energy in sending data to mobile sinks in each region. 4.1.3.4
PDR
From Fig. 4.4 it is shown that the successful delivery of data packet in each round for CDSEEC is less than our proposed CSEEC and existing SEEC routing protocols, as sensor nodes are restricted to forward data by using large depth
77
500 450
Residual energy(joules)
400 350
CDSEEC CSEEC SEEC
300 250 200 150 100 50 0
0
500
1000
1500 2000 Rounds
2500
3000
3500
Figure 4.3: Network residual energy threshold. As the size of regions in CDSEEC is small as compared to SEEC and CSEEC, as a result less number of packets are generated and then sent to mobile sinks by minimum number of nodes in that regions. However, with the passage of time our proposed routing protocol CDSEEC achieve high PDR because of high network lifetime as shown in Fig. 4.4.
4.1.4
Performance tradeoffs
In this section, performance tradeoffs of our proposed schemes CSEEC, CDSEEC and existing scheme SEEC are given in table 4.2. The performance of our proposed protocol CSEEC in terms of network lifetime, network stability period and throughput is better. While the proposed hybrid protocol CDSEEC, achieves better network lifetime and stability period but the cost paid for it is throughput. Whereas, SEEC achieves throughput at the cost of network lifetime and stability period. 78
25
Packets Delivery Ratio(PDR)
20 CDSEEC CSEEC SEEC
15
10
5
0
0
500
1000
1500 2000 Rounds
2500
3000
3500
Figure 4.4: PDR Table 4.2: Performance tradeoffs Parameters achieved Compromised parameters Protocol
High throughput Fig. 4.4 SEEC
High network lifetime Fig. 4.2 CSEEC CDSEEC
4.2
Stability period, network lifetime Fig. 4.1, Fig. 4.2
Stability period, network lifetime Fig.4.1, Fig.4.2. Stability period, throughput Fig. 4.2, Fig. 4.4. Throughput Fig. 4.4.
Simulation results and discussions: VCBR
This section shows the comparison of our proposed scheme with Intar, Re-Intar and WDFAD-DBR protocols. The table 4.3 shows the simulation parameters.
4.2.1
Performance metrics: Definitions
For the evaluation of performance of our proposed scheme, we use the following metrics.
79
Table 4.3: Simulation parameters Parameter Value Idle state power 158mW Network Area 1000 × 1000 × 1000m3 Sinks 9 Sensor nodes 100 − 500 Maximum transmission range 250m Initial Energy 70J Maximum transmission power 50W Center frequency 12kHz Data rate 32kbps Bandwidth 4kHz Acoustic propagation speed 1.5km/s Mobility model Random walk 2D mobility model Size of header 11 bytes Payload 72 bytes Acknowledgment or neighbor request 50 bits 4.2.1.1
PDR
Ratio of received packets to the total number of packets sent. 4.2.1.2
Energy tax
It is the average amount of energy consumed by a nodes when packet travels from source to sink. It is measured in joules. 4.2.1.3
End-to-end delay
End-to-end delay is the average time taken by a packet in order to reach from source node to the sink. End-to-end delay includes propagation delay, receiving delay, processing delay, queuing delay and transmission delay. It is measured in seconds.
80
4.2.1.4
Accumulative propagation distance (APD)
The average accumulative propagation distance per received packet at sink.
4.2.2
Performance metrics: Discussions
In this section, we discuss the performance parameters results in detail. 4.2.2.1
End-to-end delay
The end-to-end delay comparison of our proposed scheme with WDFAD-DBR, Intar and Re-Intar is shown in Fig. 4.5. VCBR outperforms WDFAD-DBR, Intar and Re-Intar in terms of end-to-end delay. As concept of holding time is used in WDFAD-DBR which contributes towards high end-to-end delay. In Intar, long propagation paths are selected in order to avoid channel interference which results in high end-to-end delay. While in Re-Intar for avoiding void hole problem, backward transmissions are done, as a results high end-to-end delay is observed though it is less than Intar and WDFAD-DBR. As backward transmissions increases the number of transmissions in negative direction which results in high end-to-end delay and high energy consumption. When node density increases, end-to-end delay tends to decrease. In VCBR, end-to-end delay tends to decrease with increase in node density because there are large number of link-PFNs i.e. (PFNs that are taking part in chain formation process). By increasing node density, large number of nodes (link-PFNs) take part in logical chain formation process. The source node then selects the best link-PFN from the available link-PFNs using CF that are taking part in chain formation process. Thus, the shortest path is selected between source node and sink, which decreases the number of hops involved in data routing 81
process. This shortest path selection results in less end-to-end delay. Hence, in terms of end-to-end delay VCBR outperforms Re-Intar, Intar and WDFAD-DBR.
Figure 4.5: End-to-end delay
4.2.2.2
Energy
Comparison of energy tax is shown in Fig. 4.6. Usually, energy tax tends to decrease with increase in node density. The probability of occurring void holes in the network decreases and the probability of multiple chain formation increases with the increase in node density. In sparse network, performance of Re-Intar and Intar is better than WDFAD-DBR as shown in Fig. 4.6. In WDFAD-DBR, energy consumption is high due to the presence of void holes in sparse network. In the case of Re-Intar and WDFAD-DBR, the performance remains the same when the node density increases. In Intar protocol, due to the selection of long propagation path for data forwarding to avoid channel interference results in high energy consumption. In Re-Intar, propagation distance is reduced by using depth 82
Figure 4.6: Energy tax of PFN in CF for forwarding of packet, which means next forwarder node will be a PFN having maximum CF value. By decreasing the propagation distance, energy consumption is decreased. Thus, in terms of energy consumption, ReIntar performs slightly better than Intar and WDFAD-DBR. Whereas, in both sparse and dense network conditions, VCBR outperforms Re-Intar because ReIntar uses backward transmissions to avoid void hole problem which increases the number of transmissions and results in high energy consumption. In VCBR, virtual chains are formed between the source node and sinks. Then the packet is forwarded to sink through shortest available path. Thus, the virtual chain formation avoids the void hole problem and decreases the propagation distance. Decrease in propagation distance reduces the energy consumption. Therefore, in terms of energy consumption VCBR outperforms Re-Intar, Intar and WDFADDBR. 83
Figure 4.7: PDR 4.2.2.3
PDR
Fig. 4.7 shows the comparison of our proposed protocol VCBR with Re-Intar, Intar and WDFAD-DBR in terms of PDR. In sparse network, due to high probability of void holes less number of packets are received at the destination. While in dense network, the probability of multiple chain formation increases from source node to sinks due to which maximum reception of packets can be observed at destination. VCBR protocol outperforms Intar and WDFAD-DBR in terms of PDR as WDFAD-DBR protocol considers two-hop forwarding metric i.e. current hop’s depth and next expected forwarding hop’s depth to forward data from source node to sinks. However, considering two-hop forwarding metric does not eliminates void hole problem completely. In Fig. 4.7, Intar protocol shows high PDR than WDFAD-DBR, as highest CF value node is selected for end to end path establishment process. VCBR protocol shows better results than Intar and 84
Figure 4.8: APD WDFAD-DBR in terms of PDR due to virtual chain formation from source node to sinks to avoid void holes. In Fig. 4.7, Re-Intar shows better results than VCBR in sparse network, as it uses backward transmissions to improve the PDR of Intar protocol. While in VCBR, fewer nodes participate in chain formation process in sparse network. However, as the node density increases VCBR protocol shows almost same results as Re-Intar, because participation of nodes in chain formation process increases which increases the probability of forming multiple chains in the network. 4.2.2.4
APD
In Fig. 4.8, we compare APD of our proposed scheme with counterpart schemes WDFAD-DBR, Intar and Re-Intar. As shown in the figure, APD first increases as the number of nodes increase and then tends to decrease. As the number of node increases, high depth nodes participate in logical chain formation process 85
which increases APD per delivered packet. When the number of nodes exceeds from 150, the probability of multiple chain formation increases. The source node then forwards the data through shortest available path to the sink which results in low APD. WDFAD-DBR outperforms Intar and Re-Intar because it selecst a PFN with least depth as next forwarder. As Intar select long propagation path for avoiding channel interference results in increased APD per delivered packet. While in Re-Intar, APD increases due to backward transmissions to avoid void holes in the network. However, Re-Intar performs better than Intar because it uses depth of PFNs in CF in order to select best PFN for forwarding of packet which reduces the propagation distance. VCBR protocol performs better than WDFAD-DBR, as it uses depth of link-PFNs involved in virtual chain formation process for forwarding of packet which reduces propagation distance . In WDFAD-DBR, APD increases because of high packet drops due to the void holes. While in dense network, VCBR performs better than WDFAD-DBR, Intar and Re-Intar as maximum number of nodes involved in virtual chain formation process between source node and sink. The shortest path is then selected on the basis of CF value which decreases the number of hop count involved in data transmission which results in decreased APD. Thus, VCBR outperforms WDFAD-DBR, Intar and Re-Intar protocols in terms of APD in both sparse and dense networks.
86
Table 4.4: Performance tradeoffs of scheme 1: VCBR
Protocols
WDFAD-DBR
Intar
Parameters Achieved Energy
con-
sumption
References
Fig. 4.6
PDR, end-to-
Fig. 4.7, Fig.
end delay
4.5
Price to pay
References
End-to-end
Fig. 4.5, Fig.
delay, PDR
4.7
Energy
sumption,
PDR
Fig. 4.6, Fig. 4.8
APD Energy
Re-Intar
con-
Fig. 4.7
con-
sumption,
Fig. 4.6, Fig.
end-to-end
4.5
delay Energy VCBR
con-
sumption,
Fig. 4.6, Fig.
end-to-end
4.5
sparse
in net-
Fig. 4.7
work
delay
4.2.3
PDR
Performance tradeoffs
The performance tradeoffs of WDFAD-DBR, Intar, Re-Intar and VCBR is shown in table 4.4. WDFAD-DBR considered current hop’s depth and next expected hop’s depth as forwarding metric for avoiding void holes and balance the energy consumption of the network as shown in Fig. 4.6. However, considering two hop forwarding metric does not eliminates void hole problem due to which high packet drops in the network results in reduced PDR as shown in Fig. 4.7. Moreover,
87
WDFAD-DBR calculates holding time for data forwarding which increases end-toend delay as shown in Fig. 4.5. As Intar does not consider holding time of packets and an end-to-end path is established in order to avoid void holes which results high PDR (Fig. 4.7) and low end-to-end delay (Fig. 4.5). However, long propagation path is selected for avoiding void holes which increased energy consumption (Fig. 4.6) and APD (Fig. 4.8) in the network. Besides an end-to-end path, Re-Intar used one-hop backward transmission to avoid void holes which results increased PDR as shown in Fig. 4.7. However, considering backward transmissions in Re-Intar increases transmissions in negative direction which increases energy consumption and end-to-end delay as shown in Fig. 4.6 and Fig. 4.5 respectively. VCBR creates virtual chains between source node and sink for data forwarding and avoids void holes in the network. Energy consumption and end-to-end delay is decreased as nodes with low depth are selected to participate in virtual chain formation process at the cost of low PDR in sparse network region as shown in Fig. 4.7. However, in dense network VCBR shows increased PDR in Fig. 4.7 as many nodes participate in virtual chain formation process.
4.3
Simulation results and discussions: FACVCBR and IACVCBR
In this section we evaluate the performance of FACVCBR and IACVCBR by comparing it with ATMS and IHDAS routing protocols that have same network topology and protocol operations to that of FACVCBR and IACVCBR protocols. In our simulations, sensor nodes are randomly deployed and node density varies 88
from 100 to 500 in 1000m × 1000m × 1000m network volume. We deploy nine sinks at water surface with even space between them. We assumed that sinks remain stationary after deployment at sea surface and have no energy constraints. In order to communicate with sensor nodes, sink uses its acoustic modem and radio modem is used for communication with onshore data center as sinks are equipped with both radio and acoustic modems. Sensor nodes are deployed at different depths with anchors and floating mechanism. Sensor nodes move slightly in horizontal direction due to water current and follow a 2D random walk mobility model. The movement of sensor nodes in vertical direction is negligible as it is too little. Initially, all sensor nodes have same energy source as they all are homogeneous. For communication, underwater sensor nodes use acoustic modem as they all are equipped with acoustic modem. Different acoustic modems have different characteristics depends on the nature of application. However, acoustic modems possesses transmission power, transmission range and lifetime of batteries. Therefore, we use acoustic modem which consumes 20Watt power in sending, 158mWatt in receiving and 10mWatt in idle mode. The transmission rate we use is 16kbps and maximum transmission range is 250m. Maximum allowable BER is 0.5. For fair comparison, we use same simulation parameters in all routing schemes and are listed in table 4.5.
4.3.1
Performance parameters definition
For the evaluation of our proposed work, we performed simulations using following metrics.
89
Parameters
Table 4.5: Simulation parameters Values
Receiving power Idle mode power Network Area Nodes Sinks Transmission range, rmax Initial Energy Maximum transmission power Center frequency Data rate Bandwidth Acoustic propagation speed Header size Payload ACK and control packets Allowable BER 4.3.1.1
158mW 10mW 1000m × 1000m × 1000m 100 − 500 9 250m 70J 20W 12kHz 16kbps 4kHz 1.5km/s 11 bytes 72 bytes 50 bits 0.5
PDR
Ratio of packets received to total packets sent. 4.3.1.2
Energy tax
The average energy consumption of all nodes (including transmission, reception, and idle mode energy) in the network when packet travels from source to destination (sink). 4.3.1.3
End-to-end delay
The time taken by a packet to reach from source to destination (any of the sinks) (including propagation delay, receiving delay, processing delay and transmission delay).
90
4.3.1.4
Packet drop
The total number packet sent to sink but not successfully received at sink.
4.3.2
Discussions of performance parameters
This section presents simulation results in detail. We run our simulations 15 times and the average result of each scenario is plotted. 1
0.9
0.8
0.7
PDR
0.6
0.5
0.4 IACVCBR IHDAF FACVCBR ATMS
0.3
0.2
0.1
0 100
150
200
250
300 350 Number of nodes
400
450
500
Figure 4.9: PDR
4.3.2.1
PDR
Fig. 4.9 shows that PDR of FACVCBR and IACVCBR increases with the increase in node density. It is evident from the figure that PDR of FACVCBR is 29% more than ATMS and IACVCBR is 20% higher than IHDAF routing schemes. However, in low node density ATMS and IHDAF perform better than FACVCBR and IACVCBR respectively. In sparse region, ATMS shows 24% better performance than FACVCBR while the PDR of IHDAF is 15% more than IACVCBR. The 91
reasons are: in sparse region, less number of nodes participate in chain formation process due to high probability of void hole occurrence which in tern decreases successful delivery of data packets. While in high node density, high collision probability due to interference is avoided by selecting nodes having least number of neighbors for data forwarding results in improved PDR. However, due to high load on low depth nodes in ATMS and IHDAF routing schemes increases packets drop due to which their PDR is less as compared to FACVCBR and IACVCBR. Moreover, IACVCBR performs better than FACVCBR in terms of PDR as it select cooperative nodes incrementally each time for data forwarding to avoid high load of unnecessary transmissions in sparse network. Thus, IACVCBR shows 21% better results than FACVCBR in sparse network while in high node density the PDR of IACVCBR and FACVCBR is almost same. 0.1
0.09
0.08 IACVCBR IHDAF FACVCBR ATMS
Energy tax (J)
0.07
0.06
0.05
0.04
0.03
0.02
0.01
0 100
150
200
250
300 350 Number of nodes
400
Figure 4.10: Energy tax
92
450
500
4.3.2.2
Energy tax
Energy consumption of all considered schemes decreases continuously as the node density increases in the network. Fig. 4.10 shows that energy tax of both FACVCBR and IACVCBR is minimum as compared to ATMS and IHDAF respectively. Main reasons behind this are: we use piggy backing technique in both FACVCBR and IACVCBR in order to dynamically update neighbor table information. In both ATMS and IHDAF, forwarder node is selected on the basis of depth, due to which high load on low depth nodes occurs which maximizes energy tax in the network. Furthermore, FACVCBR and IACVCBR protocols conserves energy by using adaptive transmit power levels at both source and cooperative nodes for data forwarding. In addition to above mentioned reasons, on the basis of residual energy members of cooperative chains are selected due to which energy is consumed in a balanced manner which in turn reduces energy tax. Fig. 4.10 shows that FACVCBR performs 47% better than ATMS in sparse network and 53% in dense network respectively. The performance of IACVCBR is 14% better than IHDAF in sparse network while in dense network the energy tax of both IACVCBR and IHDAF is same. Moreover, energy tax of IACVCBR is 28% less than FACVCBR as in IACVCBR cooperative nodes participates in data forwarding only if the BER of data received from direct link is higher than the decided threshold value (i.e 0.5). Otherwise, the source node in IACVCBR start its operation with another data packet. While, in FACVCBR both source and cooperative nodes equally participates in data forwarding which increases energy tax at each hop from source 93
node to sink. 500
450
400
IACVCBR IHDAF FACVCBR ATMS
350
Alive Nodes
300
250
200
150
100
50
0
100
150
200
250 300 350 Number of nodes
400
450
500
Figure 4.11: Alive nodes vs network lifetime
4.3.2.3
Network lifetime
From Fig. 4.11, it is observable that network lifetime of FACVCBR is 22% more than ATMS in sparse network and 23% in dense network respectively. Similarly, IACVCBR shows 8% more network lifetime than IHDAF in sparse network while achieve 3% maximum network lifetime than IHDAF in dense network region. The main reasons behind high network lifetime are: FACVCBR and IACVCBR use piggy backing technique which reduce neighbor request overhead as a result energy consumption in the network is reduced. Energy conservation is achieved by using adaptive transmission power level in both FACVBCR and IACVCBR. Furthermore, we select potential forwarders and cooperative nodes having maximum residual energy due to which energy is consumed in a balanced way. In addition
94
to aforementioned reasons, low depth nodes in ATMS and IHDAF usually participates in data forwarding that leads to high energy consumption in the network. In ATMS and IHDAF, as sensor nodes are not energy aware due to which mostly nodes die at the beginning of network operation. It is shown from Fig. 4.11 that network lifetime of IACVCBR is 4% more than FACVCBR as cooperative nodes in IACVCBR is selected incrementally based on BER of the received data packet from direct link. 18
16
14
End−to−end delay (s)
12
IACVCBR IHDAF FACVCBR ATMS
10
8
6
4
2
0 100
150
200
250
300 350 Number of nodes
400
450
500
Figure 4.12: End-to-end delay
4.3.2.4
End-to-end delay
In FACVCBR and IACVCBR, end-to-end delay is higher than the competitor techniques ATMS and IHDAF consequently as shown in Fig. 4.12. As the node density increases, end-to-end delay also increases in FACVCBR and IACVCBR. The main reasons for higher end-to-end delay are: void hole probability decreases with increase in node density and large number of sensor nodes with high depth 95
participates in virtual chain formation process. In our proposed schemes, collision probability is avoid by selecting node having least number of neighbors which in succession may increases the number of hops for data forwarding. The endto-end delay of FACVCBR as shown in Fig. 4.12 is 38% less than AMTS in sparse network due to selection of distant node for data forwarding in its range. When node density exceeds from 200, FACVCBR’s end-to-end delay increases i.e achieve 45% maximum end-to-end delay than ATMS. From Fig. 4.12 it can be seen that the end-to-end delay of IACVCBR is higher than IHDAF in both sparse and dense regions. In IACVCBR, those nodes are incrementally selected as next hop forwarder and relay that have minimum number of neighbors which results in high end-to-end delay. Moreover, the end-to-end delay of IACVCBR is 43% higher than IHDAF in sparse network while in dense network IACVCBR has 56% higher than IHDAF. Moreover, IACVCBR performs better than FACVCBR as data is forwarded through cooperative nodes incrementally only if the BER of data received at direct hop is not correctly received. While in FACVCBR, both source and cooperative nodes participate in data forwarding based on two-phase transmit mechanism which results in increased network end-to-end. From Fig. 4.12, it is evident that in IACVCBR end-to-end delay is 62% less than FACVCBR in sparse network and 69% in dense network repectively. On the cost of end-toend delay high PDR, less energy consumption and maximum network lifetime is achieved.
96
1200
1000
Packets Drop
800
600
IACVCBR IHDAF FCVCBR ATMS
400
200
0 100
150
200
250
300 350 Number of nodes
400
450
500
Figure 4.13: Packet drop 4.3.2.5
Packet drop
Fig. 4.13 shows that packet drop of FACVCBR and IACVCBR is less than ATMS and IHDAF respectively. The packet drop of ATMS and IHDAF increases with increase in node density in the network because of high collision probability in dense network region. It is shown in Fig. 4.13 that packet drop of FACVCBR is 85% less than AMTS while packet drop of IACVCBR is 75% less than IHDAF respectively. The basic reasons behind higher packet drop are high collision probability in dense network region and data forwarding load on low depth nodes in ATMS and IHDAF which leads to quick energy depletion in the network. Moreover, the packet drop of IACVCBR is 32% less than FACVCBR due to the selection criteria of cooperative nodes in IACVCBR. Hence, remarkable improvements in packet drop ratio can be seen.
97
Table 4.6: Performance tradeoffs of schemes 2 and 3: FACVCBR and IACVCBR
Protocols
Parameters Achieved
References
References
Price to pay More forwarding nodes participates in virtual
Improvement FACVCBR
in
PDR
is
chain formation mecha-
Fig. 4.9
nism and hence delay
observed
Fig. 4.12.
is introduced in routing mechanism Transmission
of
data
packet from source to sink occurs through multiple hops which increase
Network lifetime
is
Fig. 4.11
the overall propagation distance
increased
increases
which
thus
Fig.
4.12,
Fig. 4.10.
propagation
delay and high energy consumption. Calculation of transmit Low
energy
consumption
power level at each hop Fig. 4.10
for relay and source is done which results in increased processing delay Continued on next page
98
Fig. 4.12.
Table 4.6 – Continued from previous page Protocols
Parameters Achieved
References
Price to pay The
References
improvement
in
packet drop is achieved by avoiding void holes and collision probability
Minimum transmission
Fig. 4.13
loss
in the network due to
Fig.
4.10,
selection of best cooper-
Fig 4.12.
ative chain which results in relatively
increased
energy consumption and long propagation delay. Transmission load of low
Improvement ATMS
in
delay
is
Fig. 4.12
noticed
PDR
4.9,
packet drop, results in
Fig. 4.13
Quick energy depletion
is
of sensor nodes around
Fig. 4.9
observed in
Fig.
low PDR.
Upgradation in
depth nodes maximizes
sinks due to unbalanced
sparse
Fig. 4.11
transmission load.
network
At the cost of delay, high PDR is achieved as
Improved IACVCBR
PDR
is
more nodes are involved
Fig. 4.9
in data forwarding pro-
observed
Fig. 4.12
cess due to virtual chain selection criteria.
Increase in
network
lifetime
is
The extension in netFig. 4.11
work lifetime occurs at the cost of delay.
observed
Continued on next page 99
Fig. 4.10
Table 4.6 – Continued from previous page Protocols
Parameters Achieved
References
Price to pay
References
The improvement of network energy efficiency occurs at the price of
Improvement in
energy
Fig. 4.10
efficiency
increased processing delay as adaptive transmit
Fig. 4.12
power allocation is done for both source and relays at each hop. By avoiding void holes
Transmission loss is mini-
and minimizing collision Fig. 4.9
probability on the cost
Fig. 4.10
of relatively high energy
mized
consumption. The price of minimum PDR is paid by selectImproved IHDAF
ing relay nodes based Fig. 4.12
end-to-end delay
on minimum depth which results in imbalanced en-
Fig.
4.9,
Fig 4.10.
ergy consumption in the network. Network lifetime
is
Fig. 4.11
increased
There is a tradeoff be-
Fig.
tween network lifetime
Fig 4.13.
and energy consumption.
100
4.10,
4.3.3
Performance tradeoffs
The performance tradeoffs of proposed and baseline schemes are summarized in table 4.6. In FACVCB, at the cost of end-to-end delay high PDR is achieved in the network. The scheme improves PDR as the node density tends to increase because it reduces collision probability which is due to channel interference in the network and forms cooperative virtual chains between source node and sink. However, transmitted data may travel through multiple hops. In FACVCBR, energy consumption decreases as the node density increases by adjusting transmit power level at source and relay but, increased processing delay is faced as a cost. Moreover, energy hole problem is reduced as balance energy consumption is achieved by using residual energy information in relay selection criteria which results an improved network lifetime at the cost of distant transmissions. The scheme enhances the stability period as it maintains low transmission loss, however, cost of high energy consumption paid. In FACVCBR, packet drop rate is improved as nominal energy consumption mechanism is introduced at the cost of more forwarder nodes. In ATMS, low end-to-end delay is attained at the price of PDR as transmission load on low depth nodes near to sinks maximizes packet drop. Moreover, only depth information of sensor nodes is considered as a cooperative node selection criteria which makes a tradeoff between network lifetime and PDR in low node density region. In ATMS, cost of high energy consumption is paid in order to attain low end-to-end delay as static transmission power at source and relay node is used. 101
In IACVCBR, due to consideration of on demand retransmission mechanism and shortest cooperative virtual chain selection, there is a tradeoff between end-to-end delay and energy consumption. The proposed scheme enhances PDR as void hole avoidance in sparse network and probability of collision is reduced in high node density regions due to formation of cooperative virtual chains and the cost paid for it is end-to-end delay. Moreover, energy efficiency is achieved by considering adaptive transmit power allocation mechanism and residual energy information for virtual chain selection at the price of processing delay at each hop. Whereas, in IHDAF network lifetime is improved at the cost of high energy consumption due to constant transmission power level at source and cooperative nodes. Moreover, reduced PDR is witnessed as data is forwarded by low depth nodes which results in improved end-to-end delay at the price of quick energy depletion of low depth nodes in the network.
102
Chapter 5 Conclusion
103
We proposed novel routing protocols CSEEC and CDSEEC to control routing holes in sparse network regions and reducing unbalanced transmission load in dense network areas. Also for avoiding void holes in low node density and minimizing collision probability in dense network regions, we proposed VCBR routing protocol for UWSNs. Furthermore, for achieving data reliability over unreliable and unpredictable link we proposed two cooperative routing protocols FACVCBR and IACVCBR schemes. The proposed CSEEC and CDSEEC schemes achieve better network lifetime by load balancing and avoiding coverage holes in the network due to sparse deployment of sensor nodes. We introduce MS in low density and clustering in high node density regions in order to control routing holes and minimize imbalanced energy utilization in the network. The simulation results shows that our proposed routing schemes CSEEC and CDSEEC outperform counterpart scheme SEEC in network lifespan, stability period and energy conservation in the network. Moreover, in VCBR sensor nodes with distance to sink is selected from neighbor nodes called as Link-PFNs in its range. The selection of Link-PFNs for virtual chain formation between source node and sink successfully avoid void holes in the network which is our main research objective. Moreover, the probability of collision is also reduced because of the selection of Link-PFNs with least number of neighbors in dense network region. Virtual chain formation guarantees successful delivery of data packets to destination which increases PDR. Furthermore, using depth of Link-PFNs and avoiding backward transmissions reduce end-to-end propagation time and energy expenditure in the network. Our simulation results validate that with varying node density, VCBR outperforms WDFAD-DBR, Intar and 104
Re-Intar in terms of delay, energy utilization and APD. We also exploit cooperative communication by proposing FACVCBR and IACVCBR protocols for UWSNs. In both FACVCBR and IACVCBR, potential forwarders having connection with sinks are selected as members of virtual chains from the set of neighbor nodes. The selection of PFNs for cooperative virtual chain formation between source node and sink successfully avoid void holes in sparse network region. Moreover, the probability of collision is also reduced because of the selection of potential forwarders with least number of neighbors in dense network region. We also avoid energy hole problem by selecting master node (next hop destination) and cooperative nodes having maximum residual energy. In IACVCBR, relay nodes are incrementally selected to minimize overall network energy consumption which maximize PDR at the price of high delay. Furthermore, we adjust transmission power levels of source node and set of relays to minimize energy consumption and as a result, network lifetime is prolonged. we identify that maximum energy consumption in existing protocols operation is due to the process of neighbor identification phase and use of constant transmission power level. In order to overcome these problems, we introduce a mechanism to achieve energy conservation in knowledge sharing phase and by using adaptive transmission power incase of near transmissions. Thus, by introducing such techniques we achieve improved network lifetime and PDR. In order to minimize collision probability, we use multiple hops to forward data to destination by selecting node with least number of neighbors which results in high end-to-end transmission delay in the network.
105
Chapter 6 REFERENCES
106
Bibliography [1] Akyildiz, Ian F., Pompili, D., and Melodia, T. “Underwater acoustic sensor networks: research challenges.” Ad hoc networks 3, no.3, (2005): 257-279. [2] Erol-Kantarci, M., Mouftah, H. T., and Oktug, S. “A survey of architectures and localization techniques for underwater acoustic sensor networks.” IEEE Communications Surveys and Tutorials 13, no.3 (2011): 487-502. [3] Chandrasekhar, V., Seah, W. K., Choo, Y. S., and Ee, H. V. “Localization in underwater sensor networks: survey and challenges.” In Proceedings of the 1st ACM international workshop on Underwater networks, 2006: pp. 33-40. [4] Bayrakdar, Y., Meratnia, N., and Kantarci, A. “A comparative view of routing protocols for underwater wireless sensor networks.” In OCEANS 2011 IEEESpain, 2011: pp. 1-5. IEEE. [5] Ammar Babiker, and Nordin Zakaria. “Energy efficient communication for underwater wireless sensors networks.” Energy Effic. Commun. Netw 47, 2012. [6] Suhail Al-Dharrab, Murat Uysal, and Tolga M. Duman. “Cooperative underwater acoustic communications [accepted from open call].” IEEE Communications Magazine 51, no. 7, 2013: 146-153. 107
[7] Wahid, A., and Kim, D. “An energy efficient lacalization-free routing protocol for underwater wireless sensor networks.” International Journal of distributed sensor networks, 2012. [8] Khan, J. U., and Ho-Shin Cho. “A Distributed Data-Gathering Protocol Using AUV in Underwater Sensor Networks.” Sensors 15, no. 8 (2015): 19331-19350. [9] Azam, I., Majid, A., Ahmad, I., Shakeel, U., Maqsood, H., Khan, Z. A., and Javaid, N. “SEEC: Sparsity-aware energy efficient clustering protocol for underwater wireless sensor networks.” IEEE 30th International Conference on Advanced Information Networking and Applications (AINA), (2016): 352-361. [10] Wahid, A., Lee, S., Jeong, H. J., and Kim, D. “Eedbr: Energy-efficient depthbased routing protocol for underwater wireless sensor networks.” Advanced Computer Science and Information Technology, (2011): 223-234. [11] Yoon, S., Azad, A.K., Oh, H. and Kim, S. “AURP: An AUV-aided underwater routing protocol for underwater acoustic sensor networks.” Sensors 12, no. 2 (2012): 1827-1845. [12] Majid, Abdul, Irfan Azam, Abdul Waheed, Muhammad Zain-ul-Abidin, Taimur Hafeez, Zahoor Ali Khan, Umar Qasim, and Nadeem Javaid. “An energy efficient and balanced energy consumption cluster based routing protocol for underwater wireless sensor networks.” In Advanced Information Networking and Applications (AINA), 2016 IEEE 30th International Conference on, pp. 324-333. IEEE, 2016. 108
[13] Hameed, Ahmad Raza, Nadeem Javaid, Saif Ul Islam, Ghufran Ahmed, Umar Qasim, and Zahoor Ali Khan. “BEEC: Balanced energy efficient circular routing protocol for underwater wireless sensor networks.” In Intelligent Networking and Collaborative Systems (INCoS), 2016 International Conference on, pp. 20-26. IEEE, 2016. [14] Yan, H., Shi, Z. J., and Cui, J. H. “DBR: depth-based routing for underwater sensor networks.” International Conference on Research in Networking, 2008: 72-86. [15] Majid, A., Azam, I., Khan, T., Sangeen, Khan, Z. A., Qasim, U., Javaid, N. “ A reliable and interference-aware routing protocol for underwater wireless sensor networks.” In 2016 IEEE 10th International Conference on Complex, Intelligent and Software Intensive System (CISIS). [16] Yu, Haitao., Yao, N., Wang, T., Li, G., Gao, Z., and Tan, G. “WDFADDBR: Weighting depth and forwarding area division DBR routing protocol for UASNs.” Ad Hoc Networks, 37, 2016: 256-282. [17] Akbar, Mariam, Nadeem Javaid, Ayesha Hussain Khan, Muhammad Imran, Muhammad Shoaib, and Athanasios Vasilakos. “Efficient Data Gathering in 3D Linear Underwater Wireless Sensor Networks Using Sink Mobility.” Sensors 16, no. 3 (2016): 404. [18] Javaid, Nadeem, Naveed Ilyas, Ashfaq Ahmad, Nabil Alrajeh, Umar Qasim,
109
Zahoor Ali Khan, Tayyaba Liaqat, and Majid Iqbal Khan. “An Efficient DataGathering Routing Protocol for Underwater Wireless Sensor Networks.” Sensors 15, no. 11 (2015): 29149-29181. [19] Chen, Y. S., and Lin, Y. W. “Mobicast routing protocol for underwater sensor networks.” IEEE Sensors journal, 13, no. 2, (2013): 737-749. [20] Umar, A., Javaid, N., Ahmad, A., Khan, Z. A., Qasim, U., Alrajeh, N., and Hayat, A. “DEADS: Depth and Energy Aware Dominating Set Based Algorithm for Cooperative Routing along with Sink Mobility in Underwater WSNs. ” Sensors, 15, no. 6, (2015): 14458-14486. [21] Javaid, N., Jafri, M. R., Khan, Z. A., Alrajeh, N., Imran, M., and Vasilakos, A. “Chain-based communication in cylindrical underwater wireless sensor networks.” Sensors, 15, no. 2,(2015): 3625-3649. [22] Domingo, M. C. “A distributed energy-aware routing protocol for underwater wireless sensor networks.” Wireless personal communications, 57, no.4, (2011): 607-627. [23] Liu, G., and Wei, C. “A new multi-path routing protocol based on cluster for underwater acoustic sensor networks.” Multimedia Technology (ICMT), IEEE International Conference, (2011): 91-94. [24] Javaid, N., Jafri, M. R., Khan, Z. A., Qasim, U., Alghamdi, T. A., and Ali, M. “Iamctd: Improved adaptive mobility of courier nodes in threshold-optimized
110
dbr protocol for underwater wireless sensor networks.” International Journal of Distributed Sensor Networks, 2014, 1. [25] Noh, Y., Lee, U., Lee, S., Wang, P., Vieira, L. F., Cui, J. H., and Kim, K. “Hydrocast: pressure routing for underwater sensor networks.” IEEE Transactions on Vehicular Technology, 65, no.1, 2016: 333-347. [26] Noh, Y., Lee, U., Wang, P., Choi, B., and Gerla, M. “VAPR: void-aware pressure routing for underwater sensor networks.” IEEE Transactions on Mobile Computing, 12(5), 2013: 895-908. [27] Basagni, S., Petrioli, C., Petroccia, R., and Spaccini, D. “CARP: A Channelaware routing protocol for underwater acoustic wireless networks.” Ad Hoc Networks, 34, 2015: 92-104. [28] Zhou, Z., Yao, B., Xing, R., Shu, L., and Bu, S. “E-CARP: an energy efficient routing protocol for UWSNs in the internet of underwater things.” IEEE Sensors Journal, 16, no.11, 2015: 4072-4082. [29] Chen, Y. D., Chen, Y. W., Lien, C. Y., and Shih, K. P. “A channel-aware depth-adaptive routing protocol for underwater acoustic sensor networks.” In OCEANS 2014-TAIPEI, 2014: pp. 1-6. IEEE. [30] Shah, M., Javaid, N., Imran, M., Guizani, M., Khan, Z. A., and Qasim, U. “Interference Aware Inverse EEDBR Protocol for Underwater WSNs.” In 2015 International Wireless Communications and Mobile Computing Conference (IWCMC), 2015: pp. 739-744. IEEE. 111
[31] Li, Z., Yao, N., and Gao, Q. “Relative distance based forwarding protocol for underwater wireless networks.” International Journal of Distributed Sensor Networks, 2014. [32] Diao, B., Xu, Y., An, Z., Wang, F., and Li, C. “Improving both energy and time efficiency of depth-based routing for underwater sensor networks.” International Journal of Distributed Sensor Networks, 2015. [33] Ghoreyshi, S. M., Shahrabi, A., and Boutaleb, T. “An inherently void avoidance routing protocol for Underwater Sensor Networks.” In 2015 International Symposium on Wireless Communication Systems (ISWCS), 2015: pp. 361-365. IEEE. [34] Yu, H., Yao, N., and Liu, J. “An adaptive routing protocol in underwater sparse acoustic sensor networks.” Ad Hoc Networks, 34, 2015: 121-143. [35] Jiang, J., Han, G., Guo, H., Shu, L., and Rodrigues, J. J. “Geographic multipath routing based on geospatial division in duty-cycled underwater wireless sensor networks.” Journal of Network and Computer Applications, 59, 2016: 4-13. [36] Rodolfo W. L. Coutinho, Azzedine Boukerche, Luiz F. M. Vieira, and Antonio A. F. Loureiro. “Geographic and opportunistic routing for underwater sensor networks.” IEEE Transactions on Computers 65, no. 2, 2016: 548-561. [37] Kamran Latif, Nadeem Javaid, Ashfaq Ahmad, Zahoor Ali Khan, Nabil Alrajeh, and Majid Iqbal Khan. “On energy hole and coverage hole avoidance in 112
underwater wireless sensor networks.” IEEE Sensors Journal 16, no. 11, 2016: 4431-4442. [38] Youngtae Noh, Uichin Lee, Paul Wang, Brian Sung Chul Choi, and Mario Gerla. “VAPR: void-aware pressure routing for underwater sensor networks.” IEEE Transactions on Mobile Computing 12, no. 5, 2013: 895-908. [39] Chaima Zidi, Fatma Bouabdallah, and Raouf Boutaba. “Routing design avoiding energy holes in underwater acoustic sensor networks.” Wireless Communications and Mobile Computing (2016). [40] Haitao Yu, Nianmin Yao, Tong Wang, Guangshun Li, Zhenguo Gao, and Guozhen Tan. “WDFAD-DBR: Weighting depth and forwarding area division DBR routing protocol for UASNs.” Ad Hoc Networks 37, 2016: 256-282. [41] Chien-Fu Cheng, and Lung-Hao Li. “Data gathering problem with the data importance consideration in Underwater Wireless Sensor Networks.” Journal of Network and Computer Applications 78, 2017: 300-312. [42] YunLi, Zhigang Jin, Xunjun Wang, and Zixin Liu. “Relay selection and Optimization algorithm of Power allocation based on Channel Delay for UWSN.” International Journal of Future Generation Communication and Networking, 9(2), 2016: 103-112. [43] Yu Luo, Lina Pu, Zheng Peng, Zhong Zhou, Jun-Hong Cui, and Zhaoyang
113
Zhang. “Effective relay selection for underwater cooperative acoustic networks.” In Mobile Ad-Hoc and Sensor Systems (MASS), 2013 IEEE 10th International Conference on, pp. 104-112. IEEE, 2013. [44] A. Umar, M. Akbar, Z. Iqbal, Zahoor Ali Khan, U. Qasim, and Nadeem Javaid. “Cooperative partner nodes selection criteria for cooperative routing in underwater WSNs.” In Information Technology: Towards New Smart World (NSITNSW), 2015 5th National Symposium on, pp. 1-7. IEEE, 2015. [45] Hina Nasir, Nadeem Javaid, Hifsa Ashraf, S. Manzoor, Zahoor Ali Khan, Umar Qasim, and M. Sher. “CoDBR: cooperative depth based routing for underwater wireless sensor networks.” In Broadband and Wireless Computing, Communication and Applications (BWCCA), 2014 Ninth International Conference on, pp. 52-57. IEEE, 2014. [46] Alouane, Wided Hadj, Noureddine Hamdi,and Soumaya Meherzi. “Closedform BEP of Demodulate-and-Forward using two-relay over Rayleigh fading environments”, Third International Conference on The Network of the Future (NOF), 2012. [47] Diana Pamela Moya Osorio, Edgar Eduardo Benitez Olivo, Hirley Alves, Jose Candido Santos Filho, and Matti Latva-aho. “An Adaptive Transmission Scheme for Amplify-and-Forward Relaying Networks.” IEEE Transactions on Communications (2016).
114
[48] Chao Gao, Zhiyong Liu, Bin Cao, and Liwei Mu. “Relay selection scheme based on propagation delay for cooperative underwater acoustic network.” In Wireless Communications and Signal Processing (WCSP), 2013 International Conference on, pp. 1-6. IEEE, 2013. [49] Yen-Da Chen, De-Ren Wu, Wei Chen, and Kuei-Ping Shih. “A Self-Adaptive Cooperative Routing Protocol for underwater acoustic sensor networks.” In OCEANS’15 MTS/IEEE Washington, pp. 1-5. IEEE, 2015. [50] Sheeraz Ahmed, Nadeem Javaid, Ashfaq Ahmad, Imran Ahmed, Mehr Yahya Durrani, Armughan Ali, Syed Bilal Haider, and Manzoor Ilahi. “SPARCO: stochastic performance analysis with reliability and cooperation for underwater wireless sensor networks.” Journal of Sensors 2016. [51] Ashfaq Ahmad, Sheeraz Ahmed, Muhammad Imran, Masoom Alam, Iftikhar Azim Niaz, and Nadeem Javaid. “On energy efficiency in underwater wireless sensor networks with cooperative routing.” Annals of Telecommunications 2017: 1-16. [52] Jae Won Lee, Jin Yong Cheon, and Ho-Shin Cho. “A cooperative ARQ scheme in underwater acoustic sensor networks.” In OCEANS 2010 IEEE-Sydney, pp. 1-5. IEEE, 2010. [53] Arindam Ghosh, Jae-Won Lee, and Ho-Shin Cho. “Throughput and energy efficiency of a cooperative hybrid ARQ protocol for underwater acoustic sensor networks.” Sensors 13, no. 11, 2013: 15385-15408. 115
[54] Hina Nasir, Nadeem Javaid, M. Murtaza, S. Manzoor, Zahoor Ali Khan, Umar Qasim, and M. Sher. “ACE: Adaptive Cooperation in EEDBR for Underwater Wireless Sensor Networks.” In Broadband and Wireless Computing, Communication and Applications (BWCCA), 2014 Ninth International Conference on, pp. 8-14. IEEE, 2014. [55] Zhiquan Bai, Jianlan Jia, Cheng-Xiang Wang, and Dongfeng Yuan. “Performance analysis of SNR-based incremental hybrid decode-amplify-forward cooperative relaying protocol.” IEEE Transactions on Communications 63, no. 6, 2015: 2094-2106. [56] Sheraz Hussain, Nadeem Javaid, Syed Zarar, Muhammad Zain-ul-Abidin, Mudassir Ejaz, and Taimur Hafeez. “Improved Adaptive Cooperative Routing in Underwater Wireless Sensor Networks.” In Broadband and Wireless Computing, Communication and Applications (BWCCA), 2015 10th International Conference on, pp. 99-106. IEEE, 2015. [57] Winston K. G. Seah and Hwee-Xian Tan. “Multipath virtual sink architecture for underwater sensor networks.” In OCEANS 2006-Asia Pacific, 2007: pp. 1-6. IEEE.
116