Nissan LEAFTM, Chevrolet Volts, and Smart ForTwo EVs [9]. These EVs made use of an infrastructure that consisted of nearly 8,200 Residential electric vehicle ...
Enforcing QoS on OpenNebula-based Shared Clouds for Highly Dynamic, Large-Scale Sensing Data Streams Omer 1
Rana2,
´ Rafael Tolosana-Calasanz 1, Jos´e Angel Ba˜nares1, 3 4 Congduc Pham , Erotokritos Xydas , Charalampos Marmaras 4, Panagiotis Papadopoulos 5, Liana Cipcigan4
Computer Science & Systems Engineering Department, University of Zaragoza, Spain 2 School of Computer Science & Informatics, Cardiff University, UK 3 LIUPPA Laboratory, University of Pau, France 4 Institute of Energy, School of Engineering, Cardiff University, UK 5 EDF Energy R&D UK Centre, UK
Abstract—With the increasing number of sensors, there is a rising amount of raw volumes of data that need to be processed, leading to the so called Big Data explosion. Data measured or collected by sensors is typically processed at destination or “intransit” (i.e. from data capture to delivery to a user). When such data are processed in-transit over a shared distributed computing infrastructure, the computational power can be adjusted to the required demand. On one hand, this guarantees an efficient usage of resources. However, Quality of Service (QoS) mechanisms must be incorporated into the system in order to guarantee and enforce a previously negotiated Service Level Agreement (SLA) to each user. This is particularly challenging for time critical applications and with highly variable and unpredictable rates of data generation. This is for instance the case of smart meters in Smart Grids applications. In previous papers, we proposed a Reference net based architectural model for supporting QoS for multiple concurrent data streams being processed (prior to delivery to a user) over a shared infrastructure. In this paper, we describe how to implement this architecture in a real Cloud framework such as OpenNebula. We consider our infrastructure to be composed of a number of nodes, each of which has multiple processing units and data buffers. We utilize the “token bucket” model for regulating, on a per stream basis, the data injection rate into such a node. We subsequently demonstrate how a streaming pipeline can be supported and managed using a dynamic control strategy at each node. Such a strategy supports end-to-end QoS with variations in data size between the various nodes involved in the processing.
I. I NTRODUCTION & M OTIVATION The growing proliferation of sensors and sensor technologies leverage the idea of wireless sensor networks (WSN) based on collaborative effort of a large number of nodes. As a result, there is a need in building software applications that process the data coming from this sensors “on the fly”, as it is being generated and streamed, and that do not fit into the model of traditional databases and querying paradigm. This type of applications can be found in the new generation of the electric network, often termed as “Smart Grid”, for controlling the demand of energy and its distribution; in surveillance systems for monitoring of behaviours, activities, etc., in bio-
logical systems for the observation of population of species of interest –i.e. in danger of extinction, protected or of interest for scientists, in traffic, in social network for sentiment analysis, etc. Moreover, as the number of sensors becomes higher, the task of designing and implementing such applications is more challenging, in terms of storing, processing and transmitting such data. In general terms, when data is generated from a “source”, and the result of its analysis is required at a “sink”, there are two main ways to analyse and process these large amounts of data: in-transit or in-situ data analysis. In-situ analysis involves large computing capacity at the location where data is generated, which is something not always possible and in many circumstances it is a prohibitively expensive solution in terms of cost. An alternative approach consists in processing during the transmission of the data origin location to the sink. Additionally, many applications are characterised by their very dynamic nature with highly variable data injection rates. Some of those also fall within the area of “Urgent Computing” – which refers to providing prioritized access to computational and data resources to support emergency computations such as severe weather prediction during matters of immediate concern – such as hurricanes, flooding, medical emergencies, etc. Immediate access to computational jobs in critical emergencies must be given, and time cannot be wasted in job queues of high end computational resources. In this paper, we propose an OpenNebula-based system which enforces Quality of Service (QoS), measured exclusively in terms of throughput, for the simultaneous processing and analysis of multiple data streams over a shared, in-transit, data processing infrastructure. Additionally, we also provide some realistic scenarios from next generation of electric network (smart grids), where sensors (smart meters) generate data at highly variable and unpredictable bursts. Our system can properly process and transmit data streams with such characteristics. It is assumed that the network bandwidth for data transfer is not the bottleneck in the system. We also
assume that the processing of a data stream is composed of a sequence of stages and datasets are transmitted through the stages. Besides, each stage is a combination of data access, processing and transmission to the following stage. The data admission control & regulation component is based on a token bucket model whose main objective is to isolate data streams and to regulate the access to the computational phase. At each autonomic control period, the access for stream i is accomplished at a rate of R i data elements per unit of time (coming from charging requests), which is based on the average income rate from historical information for i. Additionally, it also allows for a configurable maximum burstiness above R for each data stream. The data admission control component guarantees that there will be starvation scenarios. Nevertheless, when there is an income rate that is following an increasing or decreasing tendency, the R parameter can be dynamically modified, therefore leading with bursty and unexpected charging requests. A Petri net-based model of this architecture was already presented in [10], our key contribution in here is to make use of OpenNebula in order to implement the elasticity of the Process Unit component, and to validate that there is no significant overhead derived from the vitalization technologies. A key mechanism for enabling QoS (throughput) in our architecture is the token bucket-based admission & regulation component. Therefore, we have to guarantee that the use of virtualisation technologies is not altering the original income rate of packets at each data stream. In particular, we tested that the jitter, defined as the time between consecutive packets within a data stream being transmitted to a VM, is not altered by the hypervisor. The remainder of this paper is structured as follows. Section II describes real case studies where variable and unexpected rates of streams occur. Section III discusses enforcement techniques based on the TB model and presents our architectural model. In Section IV, an OpenNebula based implementation of our model is described. Section V presents our evaluation scenario, analysing the overhead driven by virtualisation technologies. In Section VI, related work is briefly discussed. Finally, conclusions and future work are given in Section VII. II. C ASE S TUDIES : H IGHLY, U NEXPECTED DATA G ENERATION R ATES In this section, we discuss about three different case studies wherein data is generated in a stream fashion and at different, highly variable, and unexpected rates. The first scenario corresponds to the metering of the new generation of power networks, termed as smart grids. Smart meters measure the energy consumption, and can stream this information to the electric companies. The second scenario corresponds to Electric Vehicles (EVs), which will be connected to smart grids in order to charge their batteries. EVs will be integrated into smart grids, and will also make use of smart meters for recharging of their batteries. Finally, the third scenario is related to cases where data streams are processed through a pipeline of
nodes, and in any of the intermediate nodes, the data inflation / deflation phenomena arises, whereby data elements after being processed change their size (either increase or decrease), leading to performance issues in the following nodes in the pipeline. A. Case Study 1: Smart Metering in Smart Grids Power networks are currently evolving to smart grids, a promising solution for improved energy efficiency, manageability, and controllability of available resources in power networks. From an architectural point of view [ 5], smart grids consists of three layers: (i) the physical power layer –for transmission and distribution of electricity, the smart physical power layer consists of a wide variety of Distributed Energy Resources (e.g. generation, controllable loads and storage) and power consumers. (ii) The Advanced Metering Infrastructure (AMI) –a bidirectional communication capability, connecting the electric generators and power consumers with smart meters. (iii) The application layer –which includes a number of applications for managing power networks such as the automatically gathering of metering information from the consumer side, the interaction of third-party vendors with the customer equipment for monitoring and control, Demand Response (influencing on consumer electricity consumption patterns –i.e. by altering electricity pricing), applications related to Utility Control, Load Monitoring & Forecasting for energy demand, etc. The meters from the AMI are essential in a number of smart grid functionalities such as in monitoring the influence on consumer electricity consumption patterns (often termed as Demand Response). The data that smart meters transmit can be bursty in nature as these devices are not synchronised and send data independently of each other, characteristic that may lead at instantaneous needs to peak [6]. Besides, as proposed in [6], the transmission of data from consumption at a constant rate in the meters may result into inefficient usage of network bandwidth and computational resources. The rationale behind this is based on the premise that as the total power usage within the utility approaches total available capacity, usage information is required more frequently to detect and forecast a peak load event with low latency to allow a timely response. Therefore, smart meters transmit data with dynamic frequency rate at each electric area, and depending on the energy demand and its proximity to load power. B. Case Study 2: Electric Vehicle Charging Process There is an gradual inclusion of EVs into production facilities and marketing plans of all car manufacturers. These vehicles are anticipated to gain an important market share over conventional Internal Combustion Engine (ICE) powered vehicles. Nevertheless, in order to re-charge their batteries, EVs will have to be connected to power networks [ 7], which are currently evolving to smart grids. According to recent studies [8], by 2030, in case the charging of EV batteries is left uncontrolled, a significant increase in the electricity demand peaks is to be expected. Moreover, the impact of EVs
is anticipated to be at the local level where hotspots will be created that depend on how EVs will cluster within a particular geographical location, creating a possible overload on the low voltage distribution networks. From an electricity infrastructure perspective, EVs can be considered as: (i) mobiles devices expected to be able to connect at various locations at different times, and when they connect, they draw a continuous current from the electricity network; (ii) flexible loads that may allow electric companies to interrupt or coordinate their charging procedure; (iii) storage devices that may allow electric companies to request power injections from their batteries back to the electricity grid (called Vehicle to Grid V2G). Electric companies will need to process energy consumption data coming from the smart meters at the smart grid AMI layer. Therefore, the challenge that EVs rise is to determine over what period of the day EV drivers are likely to request charging; as this activity first requires a plan for charging the EVs that meets drivers’ preferences, battery constraints and electric constraints at the minimum economic cost [7]. Computationally, any charging request generates data being transmitted throughout the whole process that requires computation. It is therefore essential to understand real usage of charging infrastructures and drivers’ behaviour. This real usage can be anticipated from The EV Project[ 9] 1 , which is one of the largest electric vehicle infrastructure demonstration projects. This project focuses on examining the various activities and situations involving EV drivers’ behaviour and charging infrastructure use [ 9]. For all these reasons, it can be considered as one of the most realistic deployments available. Data gathered by The EV Project is reported on a quarterly basis, and accessible online 2 . It includes information of interest such as probability distributions for the hourly average usage of charging points, the aggregated hourly charging demand, the average energy requested per charging event (a charging event is defined as the period when a vehicle is connected to a charging unit, during which period some power is transferred), the average recharging time, etc. By the 2nd Quarter of 2013, over 2.9 million charging events had been recorded by the EV Project from project participants in the US driving vehicles enrolled in it: approximately 8,300 Nissan LEAFTM, Chevrolet Volts, and Smart ForTwo EVs [9]. These EVs made use of an infrastructure that consisted of nearly 8,200 Residential electric vehicle supply equipment (EVSE) charging stations, over 3,750 Commercial (publicly available, workplace, and fleet) EVSE charging stations, and 87 DC Fast Chargers (DCFC). Besides, for data privacy issues, each dataset provided aggregates values for a whole participant electric network area in the US, namely residential, private non-residential, and public. From all this data, in this paper, we are interested in the statistics that provide with evidence on when EV drivers are likely to request charging, and the duration of this process. 1 http://theevproject.com 2 http://theevproject.com
Before The EV Project began collecting data, common wisdom had been that 80% of charge events for a typical driver would be at home [9]. Data collected at the EV Project seems to validate this [9]: The percentage of home charging for all regions appeared to stabilize at about 74% of all events for the Leaf and 80% for the Volt. Another important metric given by the EV project is that EVs averaged 1.1 charging events (or requests) per day. For the Volt driver, the average was 1.5 charging events per day. Although Volt drivers charge their vehicles more often, they tend to take these charges at home.
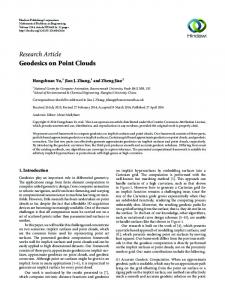
Fig. 1. Aggregated Charging Availability for Weekdays in Residential Areas
These metrics are also related to the use of the charging points at the infrastructure. In this sense, considering only residential areas, Figure 1 illustrates the availability distribution of charging points points for weekdays. This graph shows the maximum and minimum percentage of charging units connected across all days of all EVSE for weekdays. When there is a drop in the lines means that some EVs disconnected, and a rise means that an EV is charging the battery. The behaviour is highly associated with the arrival and departure times of the EVs at their homes, but it is also influenced by the electric tariff, in this case, the minimum electricity demand is observed at 06:00 approximately. This is directly related to the hours that many EV owners are going to their work and therefore stopped the charging process. The opposite is happening at night because the EV owners prefer to charge their EVs at the hours with a lower tariff. In The EV Project, a charging event is defined as the period when a vehicle is connected to a charging unit, during which period some power is transferred [9]. For a Smart Grid management purpose, smart meters at charging points transfer data packages during the power transfer at an established frequency (i.e. every 15mins., half-hourly, etc.). Nevertheless, according to Figure 1, it can be concluded that data flows generated for the EV re-charging processes can be highly bursty in reality (a maximum variability of up to 300% in Figure 1 can be observed), which can make any anticipation or prediction of the expected computational demand very difficult. C. Data inflation/deflation issues The architectural streaming blueprint adopted in this paper consists in a pipeline of nodes (stages) that can be geographically distributed and each performing a specific processing.
Each node can potentially have a number of computational resources for processing, and allocates them for such a purpose. Moreover, a number of data streams are sent through the pipeline in order to be processed, having each data stream a previously negotiated Service Level Agreement (SLA), in here this is essentially throughput, which will be materialized at runtime in terms of Quality of Service (QoS). Hence, for each data stream and at each stage, it is necessary to identify the data storage and processing requirements – derived from the overall throughput requirement of the data stream. These requirements are subsequently used to identify the size of buffers and computing resources needed per node. We assume that these requirements are either known by the user enacting the stream or derived from prior runs. However, what may not be known is whether for a particular combination of inputs and data sources a large amount of output data may be generated at a stage (leading to data inflation). Conversely, data deflation at a node may lead to an inefficient use of available resources. The challenging issues of data inflation/deflation are summarized in Figure 2 that illustrates the various steps starting from SLA negotiation based on the application’s data injection rate (step 1). For simplicity, the figure only shows one flow instance. Step 2 involves data access and control based on QoR (R) parameters. Steps 3 and 4 show how incoming data get processed by the first stage leading to data inflation. Subsequently, step 5 identifies the impact on a subsequent stage, where the rate is limited by the token bucket parameters of the stage. This may lead to either data loss or an inability to meet an application’s end-to-end QoS.
Fig. 2.
Example of data inflation at the 2nd stage
Pre-defined values of R and buffer sizes cannot overcome effects of data inflation/deflation on resource management or workflow QoS. It is therefore necessary to identify a strategy for altering the processing rate at each node to avoid large buffer overflow or large queue sizes. In consequence, it is mandatory to identify the parameters that can be adjusted at a node based on the computing resources available at the processing, and the data injection rate into the node. III. AUTONOMIC S TREAMING S YSTEM A RCHITECTURE The system architecture and its corresponding Reference net based models were presented in [10], [1]. The Reference net formalism [11] was used to specify the architectural
components. Reference nets is a particular class of highlevel Petri net that uses Java as an inscription language and extends Petri nets with dynamic net instances, so-called net references, and dynamic transition synchronization through synchronous channels. As depicted in Figure 3, our system architecture consists of pipeline of autonomous computational stages. Each stage consists of a combination of data admission control & regulation, computation, data transfer capability, and a rule-based controller components, which are designed upon autonomic computing principles for supporting and enforcing QoS. The data admission control & regulation component is based on a token bucket model, whose main objective is to isolate data streams, and to regulate the access to the computational phase. At each autonomic control period, the access for stream i is accomplished at a rate of R i data elements per unit of time, which is based on the average income rate from historical information for i. Additionally, it also allows for a configurable maximum burstiness b i , above Ri for each data stream i. The data admission control component guarantees that there will not be starvation scenarios, and that the established QoS per stream will be enforced. The computation phase consists of an elastic pool of computational resources that can be switched on and off at runtime, based on the income rate of data streams at each node. Between the admission control and the computational phase there is a buffer, whose occupancy is monitored by the computational phase controller, so that the computational power is adjusted (either increased or decreased, i.e. computational nodes are added / removed) on demand. We consider in here the average throughput per stream, and the maximum allowed burst per stream as QoS parameters. Finally, the transmission component monitors the processing capability of the next node in the pipeline as well as the network bandwidth and autonomically adjusts the transfer rate accordingly to avoid data loss. For simplicity, for each data stream i, initial b i and Ri parameters are selected based on historical executions, and it should be emphasised that the number of allocated computational resources is in relation with both b i and Ri , as the buffer occupancy between both components triggers rules that adapts the computational power accordingly. Therefore, it is crucial to select bi and Ri appropriately; initially they are both based on average values. Nevertheless, a characterisation for bi and Ri in case of the scenarios from Section II would require for instance setting up an average value for Ri and a huge value for the maximum allowed burstiness b i . Consequently, the token bucket-based data access component in the architecture will not succeed in its objective of isolation of flows: in case of burstiness from a data stream, there would be performance degradation for the rest of the data streams, as the computational resources would be taken by the data elements in the burst. The solution to this problem was proposed in [ 10], and consists in supporting an adaptive R i token bucket parameter, and a fixed b i for an allowed burst of around 10% or 15%, so that in the example of Figure 2, at node 2 where an data
inflation arose, the initial parameter R i would be increased. The controller monitors the income rate at each node, and when there is a income rate that is following an increasing or decreasing tendency, the R i parameter is updated accordingly. A. Reference net-based models The details and the complete set of Reference net models were given in [10], [12]. In this subsection, we are just briefly describing the top layer of system architecture model. In Figure 3, a top level set of Reference nets is depicted. They show the high-level view of the system architecture, the essential components that coordinate the execution. The upper part of Figure 3 shows three pipeline stages, namely s1, s2, s3 represented by three nodes. The Reference net for each stage is then expanded in the lower part of the figure (note that we use the terms node and stage interchangeably). A node at this level consists of two transitions and a place. Two consecutive nodes, ni followed by n i+1 , share one transition: the final transition of ni is the initial transition of n i+1 . Transitions labelled as ij are responsible for creating and initialising nodes: the parameters specified in the creational inscription new node(opList, res, buf S) are from left to right the list of operations that the resources at the node can perform, the initial number of resources and the buffer size of the PU. At enactment time, multiple data elements from different data flows are streamed into the PU, introduced one by one at the initial transition via Synchronous Channel : inputData([d, wf ]). Pairs in the form [d, wf ], where d is a data element that belongs to wf ’s data stream, are introduced in Transition t1. d stores either the data itself or a reference to the data element. The pair [d, wf ] goes through the sequence of nodes and finishes the processing in Transition t4. Each node contains three different components: a token bucket manager, a Processing Unit (PU) and an Autonomic Data Steaming Service (ADSS). When a pair [d, wf ] enters into the node, it arrives at the token bucket manager component (Transition t1). Then, whenever the corresponding token bucket allows the data element to proceed, it enters into the PU. Finally, after the processing, it goes to the final stage which corresponds to the ADSS. Upon completion of the transmission, a data element gets out of the node and enters into the next node (Transition t4). Figure 3 shows how each place of the node net references the corresponding TBMng, PU and ADSS net instances. Transitions tb1, tb2 are Synchronous Channels and allow TBMng net to claim or release more resources at the PU for this stage by synchronizing with transitions u1, u2. Whenever the token bucket-based data access component allows a data element to proceed to the PU component, it enters first to a FIFO buffer, waiting for any available computational resource. The number of computational resources at the PU is regulated by the autonomic controller depending on this FIFO buffer occupancy. A tendency in time to increase the buffer occupancy indicates that the number of computational resources must be increased, and vice versa for the decrease in the occupancy tendency. In the model, the processing by a
computational resource was simulated by a subnet triggered by a stochastic timed transition. IV. O PEN N EBULA BASED -I MPLEMENTATION The deployment of our system architecture is intended to deploy a node at a location, thereby all the computational resources within a node can communicate with a LAN, reducing the communication latency and overheads. In this paper, we replace the subnet of the PU component at each node, by an adapter component that interacts with OpenNebula, so that OpenNebula in turn will allow us to manage a number of virtual machines (VMs). Therefore, as the Reference nets can be interpreted by Renew [13] (a Reference net interpreter), our Reference net-based model becomes executable. A. OpenNebula Functionality and Architecture OpenNebula exposes user and administrator functionality for creating, and managing private or hybrid, heterogeneous Clouds. In particular, OpenNebula provides virtualization networking, image and physical resource configuration, management, monitoring and accounting [ 14]. Services can be hosted in VMs, and then submitted, monitored and controlled in the Cloud by using Sunstone or any of the OpenNebula system interfaces, namely Command Line Interface (CLI), XML-RPC API, OpenNebula Ruby, and Java Cloud APIs. Additionally, it also supports two main Cloud interfaces, namely Amazon’s EC2-Query API –thereby an OpenNebula Cloud can be accessed by an EC2 query; and OCCI-OGF interface. The hypervisors supported to run VMs are Xen, KVM and VMware, and in order to enable message communication among them, physical and virtual network links can be used. OpenNebula supports the creation of Virtual Networks by mapping them on top of the physical ones. In order to facilitate the creation of virtual machines and to manage and share data, the storage system of OpenNebula is provided to create disk images. These images can be shared among OpenNebula cloud users and used by several VMs. The images are stored at a template repository system with controlled access. Once a VM is instantiated, OpenNebula also provides different methods to customize the VM and adapt it to context by passing contextual information such as network configuration for the VM, user credentials, etc. B. Integration with OpenNebula We are utilising OpenNebula for the creation and management of the pool of computational resources for our Processing Unit (PU) components. At every node, at each PU, we assume that there is a number of computational resources that can accomplish the same functionality with similar performance. We, therefore, utilise VMs for implementing computational resources, which will be linked with the PU controller by a physical network. We utilise the OpenNebula template repository for storing the OS image to be used for each VM with the required executables already installed. As a hypervisor, we are utilizing KVM [15] (Kernel-based Virtual Machine). KVM is an open-source hypervisor for Linux OS on x86 hardware.
Fig. 3.
Autonomic self-configuring component to regulate the stream processing rate at each stage
It is fully integrated into the Linux kernel, and supports the execution of multiple virtual machines running unmodified Linux OS or Windows OS images. Each VM has private virtualized hardware: a network card, disk, graphics adapter, etc. For the purpose of this paper, we run 64-bit Scientific Linux OS VM on an x86 virtualized hardware. Once the VMs are all set up, they are ready for the operational purpose of the PU component: they can be switched on & off depending on the processing requirements. Whenever a data element arrives is sent to the PU, the data element arrives to a FIFO buffer, where the data element is stored until there is a free VM. Once a VM is ready for processing, the PU sends the data element to the available VM by means of an adapter to OpenNebula, as depicted in Figure 4. This adapter creates a TCP connection with each machine, and sends the data element through a socket, and waits for the result of the processing. The OpenNebula adapter component is also responsible for switching on & off the VMs, by making use of the OpenNebula CLI interface. V. E VALUATION Priory to deploy our cloud service infrastructure, we tested that we can enforce QoS among the data streams with OpenNebula and KVM. A key mechanism for enabling QoS (throughput) in our architecture is the token bucket-based admission & regulation component. Therefore, we have to guarantee that the use of virtualisation technologies is not altering the original income rate of packets at each data stream. In particular, we tested that the jitter, defined as the
time between consecutive packets within a data stream being transmitted to a VM, is not altered by the hypervisor of VMs. We accomplished a test at the cloudmip 3 platform of the Universit´e Paul Sabatier of Toulouse, France. It provides an OpenNebula v4.4 platform with 32 physical nodes, where each node features 32Gb RAM x 8cores. In the first test, 4 VMs sent packets to 20 VMs recording the jitter. Each sender VM run 5 java processes for sending packets at a speed of 400 packets/s. We measured the jitter for various packet sizes: 8Kb, 16K, 33Kb and 65Kb. In the second test, we used 8 VMs sending packets to 40 VM for recording the jitter as well. In this way, we generated a traffic that will exceed the maximum traffic received from the outside of the infrastructure (100 Mbps). The way we have measured jitter is by computing the mean, standard deviation (STDV) of the sample and a robuster deviation metric like median absolute deviation (MADV). At a transmission speed of 400 packets per second, the jitter is around 2.5 milliseconds on average. Table I shows that jitter can be maintained in both tests for 8kb and 16kb packet sizes, and there is a slight degradation for higher packet sizes. It should be noted that the Linux OS precision for time is at milliseconds, that is the reason why the jitter measured was 2 milliseconds. Moreover, the STDV & MADV are higher for the second test, but this test generates 4Gbps of traffic, which exceeds the maximum allowed traffic from the outside. Other sources of overhead may occur when trying to schedule more VMs than available resources on a physical 3 http://cloudmip.univ-tlse3.fr/
Fig. 4.
OpenNebula-based QoS Enforcement for several Data Streams
20 VMs receiving packets packet size 8Kb 16Kb 33Kb 65Kb
MEAN (msecs) 2,00 2,00 3,00 3,00
STDV 0,42 3,09 12,98 21,45
MADV 0,30 0,56 1,93 4,15
40 VMs receiving packets packet size 8Kb 16Kb 33Kb 65Kb
MEAN (msecs) 2,00 2,00 3,00 2,00
STDV 4,93 19,55 27,22 36,16
MADV 0,54 2,39 4,72 7,72
TABLE I J ITTER M EAN , STANDARD DEVIATION AND MEDIAN ABSOLUTE DEVIATION WITH VM S RECEIVING PACKETS AT 400 PACKETS PER SEC
machine. Two overhead issues with the hypervisor-VM interaction would be: (i) creating/forking a new VM dynamically; (ii) scheduling between VMs –if there are not enough resources to sustain all VMs concurrently. All these issues will be part of the future work to be considered to deploy our infrastructure in the cloud to enforce QoS in data stream processing applications. VI. R ELATED W ORK Research in Data Stream Management Systems (DSMS) and Complex Event Processing (CEP) has evolved separately, despite the fact that both communities share a number of important similarities and challenges such as scalability, fault tolerance and performance. Data Stream Management Systems (DSMS) shifted the paradigm of Database Management Systems as the need for efficiently processing streamed datasets in real-time or nearly in real-time arose. In general, DSMSs focus on performance by restricting the language in which they can be programmed to graphs of operators with welldefined semantics [16]. This allows these systems to automatically rewrite or compile the specified stream pipelines to a more efficient version. Scalability and query distribution were considered in Aurora [17], Borealis [18] and Stream Cloud [19]. Additionally, QoS support in DSMS has been a critical requirement [16] and various scheduling strategies and heuristics have been developed. When data streams arrives at an expected rate with low variability, near optimal scheduling strategies have shown to enforce QoS for multiple data streams successfully. However, if the data streams arrive with
unpredictable and variable bursts, the scheduling heuristics comprise a combination of strategies that may not always show satisfactory QoS enforcement [16]. These systems therefore employ load shedding strategies – i.e. discarding of data elements from a stream when the loss of some data elements is acceptable. In our approach, we rely on estimations of average input rates for data streams, a token bucket model for regulating data access to the computational resources, on the elastic Processing Unit Component (increase / decrease of the number of computational resources) and on the autonomous behavior of each node. DSMSs have little or no support to express events as the outcome of continuous queries nor further support to form complex events. CEP has seen a resurgence in the last few years, though the need for events, rules, and triggers was accomplished more than two decades ago. Examples of CEP are SPADE/IBM InfoSphere Streams, Esper and DROOLS Fusion [20]. The main difference between existing CEP and stream processing systems is that in the former each event is processed at arrival time, while stream processing systems involve accumulating a data set over a time (or count – i.e. when a certain number of events have arrived) window and processing it at once. Event processing systems assume that the incoming events are not bursty and do not generally consider the presence of queues/buffers between event operators. Additionally, most CEP have little support for QoS requirements, except for the MavEStream system [16] that integrates CEP into a QoS-driven DSMS system. Again, MavEStream system enforces QoS by complex scheduling heuristics that may not always perform suitably under bursty conditions. Additionally, this lack of QoS support in CEP has also been recently considered in the literature: in [21] several microbenchmarks were proposed to compare different CEP engines and assess their scalability with respect to a number of queries. Various ways of evaluating their ability to changes in load conditions were also discussed. Regarding scalability, which has not received much attention in CEP, some event processing languages extend production rules to support event processing and provide run-time optimizations by extending the Rete [ 22] or Treat [23] algorithms to scale with the number of queries. In [24] the importance of scalability for CEP is recognised and event processing is partitioned into a number of stages. At each stage resources can process all of the incoming events in parallel under peak input event traffic conditions. However
this approach does not provide a run-time adaptation, does not involve queues and buffers and assumes the best-effort strategy (as is usual in CEP). VII. C ONCLUSIONS The increasing number of sensors and their software applications is increasing the challenges for processing, storing and transmitting the large amounts of data generated. Moreover, some application domains generate data in a highly bursty, and unpredictable rate, such as in smart grids. In this paper, we propose an OpenNebula-based system architecture as a scalable and economically viable solution for heterogeneous surveillance & monitoring systems that present extremely high dynamics in data patterns and processing requirements. We use Token Bucket envelop process to enable running multiple workflow instances over a shared Cloud infrastructure while providing each workflow with a particular QoS requirement. We add a control strategy at each workflow stage to dynamically adjust Token Bucket parameters to adapt the available resources in order to provide QoS on an end-to-end basis, so that variations in income rate can be self-configured by the application. Simulations have shown that the overhead derived from the virtualisation technologies measured in terms of jitter is not significant. R EFERENCES ´ Ba˜nares, C. Pham, and O. F. Rana, “En[1] R. Tolosana-Calasanz, J. A. forcing qos in scientific workflow systems enacted over cloud infrastructures,” Journal of Computer and System Sciences, vol. 78, no. 5, pp. 1300–1315, 2012. [2] S. Marru, D. Gannon, S. Nadella, P. Beckman, D. B. Weber, K. A. Brewster, and K. K. Droegemeier, “Lead cyberinfrastructure to track real-time storms using spruce urgent computing,” CTWatch Quarterly, vol. 4(1), 2008. [3] C. Pautasso and G. Alonso, “Parallel computing patterns for Grid workflows,” in Proceedings of the HPDC2006 Workshop on Workflows in Support of Large-Scale Science (WORKS06) June 19-23, Paris, France, 2006. [4] C. Partridge, Gigabit Networking. Addison-Wesley, 1994. [5] D. J. Leeds, “The smart grid in 2010: Market segments, applications and industry players,” GTM Research, Tech. Rep., 2009. [6] Y. Simmhan, B. Cao, M. Giakkoupis, and V. K. Prasanna, “Adaptive rate stream processing for smart grid applications on clouds,” in Proceedings of the 2nd international workshop on Scientific cloud computing, ser. ScienceCloud ’11. New York, NY, USA: ACM, 2011, pp. 33–38. [Online]. Available: http://doi.acm.org/10.1145/1996109.1996116 [7] P. Papadopoulos, “Integration of electric vehicles intro distribution networks,” Ph.D. dissertation, Cardiff University, 2012. [8] P. Papadopoulos, O. Akizu, L. Cipcigan, N. Jenkins, and E. Zabala, “Electricity demand with electric cars in 2030: comparing Great Britain and Spain,” Proceedings of the Institution of Mechanical Engineers, Part A: Journal of Power and Energy, vol. 225, no. 5, pp. 551–566, 2011.
[9] S. Schey, “Q2 2013 report – the ev project,” ECOTality North America, Tech. Rep., 2013. [10] R. Tolosana-Calasanz, J. A. Ba˜nares, C. Pham, and O. F. Rana, “Endto-end qos on shared clouds for highly dynamic, large-scale sensing data streams,” in Proc. of 1st International Workshop on Data-intensive Process Management in Large-Scale Sensor Systems (DPMSS 2012): From Sensor Networks to Sensor Clouds, 2012, pp. 904–911. [11] O. Kummer, Referenznetze. Berlin: Logos Verlag, 2002. [12] R. Tolosana-Calasanz, J. A. Ba˜nares, and O. F. Rana, “Autonomic streaming pipeline for scientific workflows,” Concurr. Comput. : Pract. Exper., vol. 23, no. 16, pp. 1868–1892, 2011. [13] O. Kummer and F. Wienberg, “Renew - the Reference net workshop,” in Tool Demonstrations, Application and Theory of Petri Nets 2000, 21st International Conference, ICATPN 2000, Aarhus, Denmark, June 26-30, 2000, Computer Science Department, Aarhus University, Aarhus, Denmark, 2000, pp. 87–89. [14] D. Milojiˇci´c, I. Llorente, and R. S. Montero, “Opennebula: A cloud management tool,” Internet Computing, IEEE, vol. 15, no. 2, pp. 11– 14, March 2011. [15] A. Kivity, Y. Kamay, D. Laor, U. Lublin, and A. Liguori, “kvm: the linux virtual machine monitor,” in Proceedings of the Linux Symposium, vol. 1, 2007, pp. 225–230. [16] S. Chakravarthy and Q. Jiang, Stream Data Processing: A Quality of Service Perspective Modeling, Scheduling, Load Shedding, and Complex Event Processing, 1st ed. Springer Publishing Company, Incorporated, 2009. [17] M. Cherniack, H. Balakrishnan, M. Balazinska, D. Carney, U. Cetintemel, Y. Xing, and S. Zdonik, “Scalable Distributed Stream Processing,” in CIDR 2003 - First Biennial Conference on Innovative Data Systems Research, Asilomar, CA, January 2003. [18] D. J. Abadi, Y. Ahmad, M. Balazinska, U. Cetintemel, M. Cherniack, J.H. Hwang, W. Lindner, A. S. Maskey, A. Rasin, E. Ryvkina, N. Tatbul, Y. Xing, and S. Zdonik, “The Design of the Borealis Stream Processing Engine,” in Second Biennial Conference on Innovative Data Systems Research (CIDR 2005), Asilomar, CA, January 2005. [19] V. Gulisano, R. Jimenez-Peris, M. Patino-Martinez, and P. Valduriez, “Streamcloud: A large scale data streaming system,” in Distributed Computing Systems (ICDCS), 2010 IEEE 30th International Conference on, june 2010, pp. 126 –137. [20] O. Etzion and P. Niblett, Event Processing in Action, 1st ed. Greenwich, CT, USA: Manning Publications Co., 2010. [21] M. R. N. Mendes, P. Bizarro, and P. Marques, “A performance study of event processing systems,” in TPCTC, ser. Lecture Notes in Computer Science, R. O. Nambiar and M. Poess, Eds., vol. 5895. Springer, 2009, pp. 221–236. [22] C. L. Forgy, “Rete: A fast algorithm for the many pattern/many object pattern match problem,” Artificial Intelligence, vol. 19, no. 1, pp. 17–37, 1982. [23] D. P. Miranker, “Treat: A better match algorithm for ai production system matching,” in AAAI, K. D. Forbus and H. E. Shrobe, Eds. Morgan Kaufmann, 1987, pp. 42–47. [24] G. T. Lakshmanan, Y. G. Rabinovich, and O. Etzion, “A stratified approach for supporting high throughput event processing applications,” in Proceedings of the Third ACM International Conference on Distributed Event-Based Systems, ser. DEBS ’09. New York, NY, USA: ACM, 2009, pp. 5:1–5:12. [Online]. Available: http://doi.acm.org/10.1145/1619258.1619265