Section 4 draws the architecture design and software agents functionalities. .... includes software services and libraries for resources, job management, security.
Engineering of an Extreme Rainfall Detection System using Grid Computing Olivier TERZO, Lorenzo MOSSUCCA Istituto Superiore Mario Boella (ISMB) Via Pier Carlo Boggio 61, 10138 Torino, Italy and Adriana ALBANESE, Piero BOCCARDO, Nishshanka Prasanna PREMACHANDRA, Rossella VIGNA Information Technology for Humanitarian Assistance Cooperation and Action (ITHACA) Via Pier Carlo Boggio, 61, 10138 Torino, Italy
ABSTRACT This paper describes a new approach for intensive rainfall data analysis. ITHACA’s Extreme Rainfall Detection System (ERDS) is conceived to provide near real-time alerts related to potential exceptional rainfalls worldwide, which can be used by WFP or other humanitarian assistance organizations to evaluate the event and understand the potentially floodable areas where their assistance is needed. This system is based on precipitation analysis and it uses rainfall data from satellite at worldwide extent. This project uses the Tropical Rainfall Measuring Mission Multisatellite Precipitation Analysis dataset, a NASAdelivered near real-time product for current rainfall condition monitoring over the world. Considering the great deal of data to process, this paper presents an architectural solution based on Grid Computing techniques. Our focus is on the advantages of using a distributed architecture in terms of performances for this specific purpose. Keywords: Grid Computing, E-Science, Early Warning System, Distributed Architecture, Scheduling, River Basins and Hydrological Analysis.
1.
INTRODUCTION
The Extreme Rainfall Detection System (ERDS) is developed by ITHACA (Information Technology for Humanitarian Assistance, Cooperation and Action) [1] in collaboration with Istituto Superiore Mario Boella (ISMB) [2], under a special request made by the World Food Programme (WFP) [3], the food aid branch of the United Nations, in order to increase efficacy in approaching emergency preparedness related to flood events. This completely automated system runs at river basin scale having a global coverage by using 3B42 and 3B42RT satellite rainfall data, products of the Tropical Rainfall Measuring Mission (TRMM) Multisatellite Precipitation Analysis (TMPA) [4]. The 3 hourly real-time 3B42RT data with some statistical adjustments are used to detect critical rainfall events and to create alerts in near real-time. Once alerts are triggered, they are automatically mapped using the informative layers extracted from a Spatial Data Infrastructure [5]. The overall situation can be visualized on a web application, in order to offer an easy access to the data during the emergency also for WFP local offices. All procedures in real-time (including the Extraction Transformation and Loading procedures, the rainfall analysis and data migration for the web application) are managed through the Grid architecture.
ISSN: 1690-4524
SYSTEMICS, CYBERNETICS AND INFORMATICS
The paper is organized as follows: Section 2 discusses the rainfall analysis procedures, according to the geographical area subdivision. Section 3 provides considerations about the system context and explains the choice of Grid technologies to process data. Section 4 draws the architecture design and software agents functionalities. Section 5 is related to the performing results obtained by using the Grid architecture. Future developments are presented in the last section. 2. THE PROCESSING CHAIN OF REAL TIME TRMM RAINFALL OBSERVATION The Real-Time System is conceived to analyze the real-time rainfalls and detect areas affected by critical rainfalls in a time span that does not exceed three hours. The first necessary activity was a preliminary statistical analysis of time series data. For the creation of this historical database, the TRMM 3B42 product dataset has been loaded in a data warehouse architecture. This solution proved suitable for managing more than 10 billion records, performing complex data analyses and queries. The near real-time rainfall analysis uses the TRMM 3B42RT product dataset. The preliminary step for the analysis of both datasets is the ETL (Extraction Transformation and Loading) process structured in the following steps: 1) the extraction of data from ftp NASA servers [6] and the conversion into a suitable format; 2) the transformation of data to fit operational needs (which can include quality levels). The transformation stage applies a series of rules or functions to the extracted data in order to convert them into the chosen format. These gridded files are transformed into ascii format starting from .hdf format (hierarchical data format) for the historical dataset (TRMM 3B42 from 1998 to 2009) and from .bin format for the real-time data (TRMM 3B42RT). Both data are resampled using a geographical layer of hydrographical basin (Hydro1k from USGS) [7], in order to perform the analysis in river basin scale; 3) only for the historical dataset there is an additional step consisting in a loading procedure that uses a bulk load tool (sql loader). After these pre-elaboration procedures, the rainfall data are analyzed through a hydrological model based on depthduration-frequency curves [8], which allows the calculation of cumulated rainfalls in a specific period for each hydrographical basin. The rainfall historical data are used to define these reference curves to which the cumulated rainfall in real-time are compared.
VOLUME 10 - NUMBER 5 - YEAR 2012
45
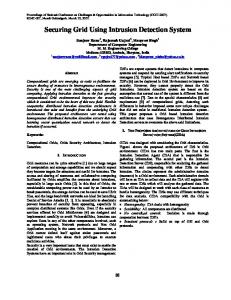
The hydrological analysis is based on two datasets. The first one is the TRMM rainfall data, having a 3 hour temporal resolution and 0.25 degree spatial resolution (from 50 degrees south to 50 degrees North latitude). The second dataset is the GIS watershed layer of HYDRO1k [7], a geographical database which provides a global coverage of topographically derived datasets including drainage basins. The watershed layer shown in Figure 1 is hierarchically arranged into a territorial subdivision with different levels (from one to six). The level 1 basins corresponding to large geographical regions (47 in total) are subdivided into 19,570 level 6 basins. All geographical basins refer to every river catchment: the intersection of the level 6 basins with TRMM grid generates 311,999 micro geographical entities. The rainfall values are resampled on the basis of these entities.
Figure 1. Drainage Basin Overview The real-time rainfall analysis consists of 5 main steps: 1) the system downloads satellite rainfall data product from the ftp NASA server every 3 hours; 2) data are transformed in .txt format and are geographically located by adding the hydrological basin reference. Each file contains an average of 312,000 records; 3) the system can now distribute the last rainfall data file on Grid nodes for the elaboration (see Figure 2); 4) for each geographical regions, the system proceeds to the dispatching of the last rainfall values on each hydrological basin; 5) the last step runs the hydrological model to detect critical rainfall events. In order to obtain an immediate visualization of the alerted areas, a customized WebGIS interface has been developed as shown in Figure 3 [9].
3. THE CHOICE OF GRID COMPUTING The purpose of this project was the application of Grid computing technologies for analyzing satellite rainfall data at worldwide extent, in order to reduce the time required for the analysis. In particular, the first goal was to find a solution that took in consideration the worldwide analysis requirements. The second major aim was to perform the hydrological analysis in a time span not exceeding three hours, since after then new values of rainfall are downloaded and prepared for a new analysis. Considering these requests, a Grid technology was considered suitable to give a flexible architecture that can process such a huge quantity of data reducing the total processing time for the real-time rainfall analysis. The Grid rainfall processing is an integrated system devoted to handle and process rainfall data in near real-time, updated every 3 hours. The general purpose of the entire infrastructure was to share the computational resources. The expected amount of data received every day was approximately 2.5 million rainfall values, corresponding to 312,000 values every 3 hours. In this specific context, this technology solves the scalability problem, thus keeping the capacity to process all data on time. The hydrologic model is constantly improved in terms of complexity and the needs in terms of MIPS (Million Instruction Per Second) increase. The distributed architecture was created using the Globus as middleware [10] [11], an open source Grid software toolkit for building Grid systems and applications. This technology was applied to computationally intensive scientific analysis. The Globus Toolkit [12] addresses the challenging issues in distributed resource sharing and is a fundamental enabling technology for Grid architecture. The toolkit includes software services and libraries for resources, job management, security and file management.
Figure 3. Web Site Overview 4.
Figure 2. Flood Grid Process Schema
46
SYSTEMICS, CYBERNETICS AND INFORMATICS
ARCHITECTURE DESIGN
The pool of nodes on which the Flood Grid Process infrastructure is built consists of 11 nodes with 2 processors each, 2 GB RAM, 32 and 64 bit machines. On all 11 nodes run Ubuntu as operating system, therefore they share the same characteristics and their performances are very similar in terms of computational capabilities. All the nodes - Grid Master and ten worker nodes - are connected through a common IP protocols inside the intranet of ITHACA research center. The
VOLUME 10 - NUMBER 5 - YEAR 2012
ISSN: 1690-4524
Grid Master has been configured as GRIIS Grid Index Information Services and has been assigned four main tasks: monitoring the availability of the worker nodes; downloading and generating the last txt rainfall data file from NASA ftp server every 3 hours through a software agent named Get TRMM rainfall agent; sending the last rainfall value on each nodes; running the hydrological model on each node through a specific Global Run Job agent. Each worker node is configured to run the hydrological model.
interaction is needed, since in normal conditions the automatic mechanism is disabled. Finally, the last task involves job submission [16][17] by running the Job Scheduler Agent on each node involved on the process analysis. Particular attention has been paid to the frequency of execution (3 hours), due to the delivery of rainfall data by the NASA server ftp. It is worth noting that so far the analysis requirements have not evolved in respect to the change of hydrological model algorithm: so, the analysis requirement was considered static. Job Scheduler Agent installed on each node. This specific agent has three main functions. When the Grid Master node submits the run command to this agent, its first task is to verify the availability of rainfall data input to be analyzed. In the second step, if no rainfall data input are found, the agent goes into sleep mode waiting for the next submission of job command from the Grid Master. On the other hand, if any file is found, the process starts distributing rainfall data on each region and subsequently performing the hydrologic model for their analysis. Its last task is to send on the Grid Master node the alerts related to the new critical events found.
Figure 4. Flood Grid Architecture The Software Agents and Scheduler In order to guarantee the system scalability and the monitoring capabilities of the grid network, some agents have been developed [13]. The agents are a solution for providing a flexible, autonomous and intelligent software components. Using software agents, the Grid Master node never sends requests on gridded nodes to get information about grid service status. With this approach all agents are independent and autonomous, preventing deadlocks and starvation. The four agents are: Resources Agent installed on each node. The main function is to monitor each node and periodically inform the Grid Master node about the space availability on each node and about the status of the grid service, such as gridftp and job management. TRMM Rainfall Agent in charge of two main functions: i) the download of data from NASA ftp server and their translation from binary to txt file format and ii) the distribution of the last real-time rainfall data on each node on the grid architecture. Global Scheduler Agent [14][15] installed only on the Grid Master node, in charge of four key tasks. Firstly, this agent performs a resource survey in order to verify the availability of grid service on each node, by querying the information on node status stored on the database. Secondly, it selects the resources by applying the job requirements definition. In our scenario some selection requirements have been defined: the capacity of nodes to send and receive files, the capability to execute the hydrological algorithm and finally the necessary condition that the last running analysis is not in progress. Thirdly, the Global Scheduler Agent monitors the progress of job execution in two ways: i) by automatically querying the job status on each node every 10 seconds and ii) by a one-time notification. In the latter case user
ISSN: 1690-4524
SYSTEMICS, CYBERNETICS AND INFORMATICS
Figure 5. Scheduling Approach SNI-MNI Considerations on the architecture As explained before, in this specific context the global coverage of earth was split in 312000 micro geographical areas. In a typical scenario based on a single machine each area is analyzed in a sequential mode: for N areas to be analyzed the N+1 areas could be processed only when the previous analysis was completed. This sequential scenario is defined Single Node Infrastructure (SNI). In another scenario each geographical entity is referred to a hierarchical structure: large regions are subdivided in 3 levels (macro, micro and short geographical entity) thus making possible to parallelize the entire analysis of the earth considering a Multiple Node Infrastructure (MNI). This allows to analyze worldwide geographical region at the same time with a parallelization of the analysis on different nodes. In Figure 5, the comparison of processing time between the two different architectures is shown. On both examples the start
t0 and in the MNI event execution ends at t0 t , in SNI it finishes at t0 t , with t t .
time is set equal to
VOLUME 10 - NUMBER 5 - YEAR 2012
47
5.
IMPROVING PERFORMANCES
A mathematical representation of a Grid Network is represented in Eq. (1): the Grid is composed of a set of resource nodes N.
G N1 , N 2 , N 3...N n
(1)
The set of Hydrological Basins taken in consideration is shown in Eq. (2); each basin needs a process time for the rainfall distribution:
Tdist
H Ba sin H Ba sin1, H Ba sin 2 , H Ba sin 3...H Ba sin
(2)
In Eq. (3), a transfer time between the Grid Master node and each worker nodes has been defined as
T ftp T ftp1 , T ftp2 , T ftp3...T ftpN
(3)
Some tests have been implemented using the two different architectures, a SNI and MNI, in order to compare performances and to obtain an estimation for the total processing time. The resulting execution time on SNI is in Eq. (4):
Tp et Tdist H Ba sin * and on MNI is in Eq. (5):
Tp et T ftp * N
Tdist H Ba sin * N
(4)
(5)
Where:
Tp
= Total Processing Time
H Ba sin
et
= Hydrological Basin Process
= Geographical Transformation before analysis
Tdist
=Processing Time for basin Rainfall Distribution
T ftp
= Transfer Time for Rainfall Files to Each Node
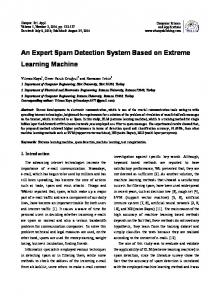
= Number of Geographical Basins N = Grid Nodes Number Table 1 reports the average estimated time for the execution of a single basin on each node. The test was realized for a sample of 5,000 basins for the two scenarios MNI and SNI. An extra time in the process due to file transfer time is observed. Figure 6 shows the total processing times for rainfall analysis at a worldwide range. In an architecture composed of one node, i.e. SNI scenario, the total processing time is 58,700 seconds (approximately 16 hours). It is clearly not an acceptable solution considering the time consumption requirements.
48
SYSTEMICS, CYBERNETICS AND INFORMATICS
Figure 6. Processing Time MNI-SNI A distributed architecture composed of two nodes, i.e. MNI scenario, requires 29,300 seconds (over 8 hours). Therefore, the highest the number of nodes, the lowest the execution time. That is to say, the total execution time decreases when the number of nodes increases. As discussed in Section 3, the ideal processing time should not exceed 3 hours, since after then new near real-time rainfall values are available for a new analysis. In order to satisfy this time limit, the necessary number of nodes is 5, as shown in Figure 6. Obviously, a shorter processing time can be obtained by increasing the number of nodes on the Grid Network. However, the asymptote trend caused by increasing the number of nodes suggests that the ideal solution be ten nodes for the data elaboration and one node for the grid management. Nodes
Proc. Time SNI Proc. Time MNI (sec) (sec) 2.23 4.12 1 2.25 4.19 2 2.31 4.25 3 2.18 4.16 4 2.36 4.21 5 2.23 4.22 6 2.45 4.13 7 2.31 4.22 8 2.22 4.09 9 2.20 4.01 10 Table 1. MNI and SNI Estimation Time for Process a Single Basin 6.
CONCLUSIONS AND FUTURE DEVELOPMENTS
This paper presents a possible approach to reduce the total execution time in a specific context. The application scenario is related to the calculation of critical rainfall events at a worldwide range, which involves a huge quantity of data to be analyzed; moreover, a big constraint is represented by the limitation in terms of processing time for the elaboration of input data. In consideration of the requirements, the difference between a multiple and a single node infrastructure has been evaluated in terms of performances. In spite of the extra time needed for the file transfer on each node, the choice of grid technology proved effective in reducing time consumption and in increasing general performances.
VOLUME 10 - NUMBER 5 - YEAR 2012
ISSN: 1690-4524
Another crucial consideration is the scalability of the system, since the hydrological model evolved in terms of complexity. A direct consequence of this is that the time to process rainfall analysis increases; with respect to this issue, a distributed architecture guarantees a 3-hour rain data elaboration by adding new nodes. Future works include the extension of the proposed architecture to clusters available across the European Grid Infrastructure (EGI) and a solution for EC2 environment by Amazon to allow researchers to deploy new worker nodes easily and to further increase available computing power using also multiprocessing programming. Increasing the number of nodes must also be improved the policies scheduling to distribute the workload it exploits multiprocessing programming based on multi thread in order to parallelize jobs execution.
[15]R. Yahyapour, P. Wieder, “Grid Scheduling Use cases”, Grid Scheduling Architecture Research Group, 2006, pp. 6-11 [16]F. Xhafa, S. Pllan, L. Barolli, “Grid and P2P Middleware for Scientific Computing Systems”, Proceedings of the 2010 International Conference on Complex, Intelligent and Software Intensive Systems, pp. 409-414 [17]K. Kurowsky, J. Nabrzyzki, A. Oleksiak, J. Węglarz, “Scheduling jobs on the Grid-Multicriteria approach”, Computational Methods in Science and Technology, 2006, Vol. 12.2, pp. 123-128
7. REFERENCES [1] Information Technology for Humanitarian Assistance Cooperation and Action (ITHACA) http://www.ithacaweb.org [2] Istituto Superiore Mario Boella (ISMB) http://www.ismb.it/ [3] World Food Programme (WFP) http://www.wfp.org [4] G.J. Huffman, R.F. Adler, D.T. Bolvin, G. Gu, E.J. Nelkin, K.P. Bowman, Y. Hong, E.F. Stocker, D.B. Wolff (2007) “The TRMM Multi-satellite Precipitation Analysis: QuasiGlobal, Multi-Year, Combined-Sensor Precipitation Estimates at Fine Scales”. Journal Hydrometeor 8(1): pp. 38-55 [5] A. Ajmar, F. Perez, O. Terzo, “WFP Spatial Data Infrastructure (SDI) implementation in support of emergency management”, The International Archives of the Photogrammetry, Remote Sensing and Spatial Information Sciences, 2008, Vol. XXXVII. Part B, pp.1097-1104 [6] ftp NASA server , ftp://trmmopen.gsfc.nasa.gov/pub/merged/mergedIRMicro [7] HYDRO1k, http://eros.usgs.gov/#/Find_Data/Products_and_Data_Avail able/gtopo30/hydro [8] A. Albanese, P. Boccardo, F. Giorgi, N. P. Premachandra, O. Terzo, R. Vigna, “Application of an Early Warning System for floods.” In: Advances in Earth Observation of Global Change, Emilio Chuvieco, Jonathan Li and Xiaojun Yang (Eds.), Springer, pp. 217 – 237. ISBN 97890-481-9084-3, e-ISBN 978-90-481-9085-0, DOI 10.1007/978-90-481-9085-0. [9] E. Agosto, S. Dalmasso, “Ithaca geospatial services on a FOSS framework”, Proc GI4DM, pp.19-25, 2009 [10] I. Foster, C. Kesselman, “The Grid: Blueprint for a New Computing Infrastructure” Second Edition, Morgan Kaufmann, 2003, pp.216-241 [11] F. Berman, G. Fox, A.J.G. Hey, “Grid Computing Making the Global Infrastructure a Reality”, Wiley, 2005, pp.171198 [12]Globus, http://www.globusconsortium.org/ [13] P. Gradwell, “Grid Scheduling with Agents”, Department of Computer Science, University of Bath, 2005 [14]S. Dimitriadou, H. Karatza, “Job Scheduling in a Distributed system Using Backfilling with Inaccurate Runtime Computations”, Proceedings of the 2010 International Conference on Complex, Intelligent and Software Intensive Systems, pp. 329-336
ISSN: 1690-4524
SYSTEMICS, CYBERNETICS AND INFORMATICS
VOLUME 10 - NUMBER 5 - YEAR 2012
49