Routing with Multiple and Prioritised Metrics (EBQRMPM). The second supports ..... IEEE International Conference in Communications ( ICC. 2000), vol. 3, pp.
Enhanced Best Effort QoS Routing with Multiple Prioritised Metrics Using the Analytic Hierarchy Process (AHP) Concept Abdullah M. S. Alkahtani, M. E. Woodward, K. Al-Begain and Abdullah Alghannam Computing Department, University of Bradford, BD7 1DP, UK
Abstract:- In this paper, we propose two algorithms. The first supports Enhanced Best effort Quality of service Routing with Multiple and Prioritised Metrics (EBQRMPM). The second supports Enhanced Best effort Quality of service Routing with Multiple Metrics (EBQRMM). Both algorithms apply the concept of the Analytic Hierarchy Process (AHP) which is a well-known model in the area of decision making with multiple objectives. We show how they work in general. We will see clearly how the final path decision changes as the priorities of the metrics change. The main novelty of this paper is the application of AHP approach which provides an opportunity to consider multiple metrics in the proposed algorithms. Key-Words:- QoS routing, Best effort, Routing algorithms, Multiple prioritised metrics, Internet, Communication networks, Analytic hierarchy process (AHP), EBQRMPM, EBQRMM.
1
Introduction
Recent advances in high speed networking technology have created opportunities for the development of multimedia applications. These applications are characterised by multiple QoS requirements. One of the key issues in supporting QoS traffic is QoS routing, which is not only selecting a path for transmitting data from source to destination, but doing this to satisfy constraints dictated by the resource reservations and admission control. Because of the diverse QoS requirements, QoS based routing has been considered to be an NP-complete problem and cannot be solved by a simple and efficient algorithm [1]. In general, routing consists of two basic tasks [2]: collecting the state information of the network and searching this information to find feasible path, if one exists. In this paper we focus on the second task by assuming that the true state of the network is available to every node. Each link in the network is associated with multiple QoS parameters (metrics) such as residual bandwidth, loss probability, delay, delay variation (jitter) and security status. The rest of this paper is organised as follows. In section ˜2, we give an overview of best effort and QoS metrics and how they can be selected. In section ˜3, we highlight some previous works. In section ˜4, we give an overview of AHP.In section 5 and 6, we present our proposed algorithms (EBQRMPM and EBQRMM) and show how they work based on a given example. Section ˜7 and 8 contain the future and work the conclusion respectively.
2
Best Effort and QoS Metrics
The Internet provides the best effort service to applications and thus cannot guarantee to meet the QoS requirements of multimedia communications. However, many research and development efforts have been made towards providing QoS guarantees, section ˜3. Although we generally state that QoS should be guaranteed, in practice the user should be able to specify the degree (or level) of guarantees. In general, there are three levels of guarantee [3] [4]: 1. Hard or deterministic guarantee: user-specified QoS should be met 100%. Hard guarantees are achieved by reserving network resources based on the peak-bit rate of a stream. This level of guarantee is also known as QoS routing with single or multiple constraints [5]. However , it has been shown that deterministic performance guarantees can be achieved without reserving resources based on the peak bit rates of streams [6]. 2. Soft or statistical guarantee: user-specified QoS should be met to a certain specified percentage. This is appropriate for continuous media because continuous media normally do not need 100% accuracy in playback. In addition, this type of guarantee uses system resources more efficiently. Resource usage can be based on statistical multiplexing: resources unused by one application can be used by other applications. 3. Best effort: no guarantee is provided and the application is executed with whatever resources
are available. The traditional computer/network systems operate in this mode.
different natures of composition rules. Therefore, the problem in QoS routing is much more complicated.
Different levels of guarantee are used for different types of traffic. In some cases, one connection may use different levels of guarantee for different QoS parameters. For example, the user may request that the specified bit error rate should be met 100% (hard guarantee) but the specified delay jitter value should be met 90% (soft guarantee).
The value of a metric over the entire path can be one of the following compositions [1] [7]:
Various approaches have been considered to deal with QoS characterisation. Namely, by using a single metric, a single compound metric or multiple metrics.
♦ Additive
metrics: It can mathematically as follows
be
represented
LK
m( p ) = ∑ m(lk i )
(1)
i =1
Where m(p) is the total of metric m of path (p),
lk i is a link in the path (p), LK is the number of links in path (p) and i = 1,...., LK .
2.1
Single Metric
In traditional data networks, routing protocols usually characterise the network with a single metric such as hop-count or delay, and use the shortest path algorithms for path computation. However, in order to support a wide range of QoS requirements, routing protocols need to have a more complex model.
2.2
Single Compound Metric
The basic idea of this is to combine several QoS parameters (metrics) in one representative value. Then use this value to take the routing decision applying any single metric algorithm. One possible approach might be to define a function and generate a single metric from multiple parameters. For example, a compound metric M may be produced with bandwidth B, delay D and loss probability L with a formula M ( p ) = B ( p ) /( D ( p ) * L( p )) [1]. A path with a large value of M is likely to be a better choice in terms of bandwidth, delay, and loss probability. A single compound metric, however, can only be used as an indicator at best, as it does not contain sufficient information to assess whether user QoS requirements can be met or not. Another problem has to do with combining parameters of different composition rules as will be explained in the following sup-section [1].
2.3
Multiple Metrics
Multiple metrics can certainly model a network more accurately. However, the problem is that finding a path subject to multiple constraints is inherently hard. A simple problem with two constraints was considered as NP-complete [1]. Resource requirements specified by the applications are often diverse and application-dependent. Moreover, the QoS parameters themselves have
Delay, Delay variation (jitter), and cost are examples of this type of composition. Various factors that determine the delay in communication networks are reviewed in [8].
♦ Concave
metrics: It can mathematically as follows
m( p ) = min(m(lk i ))
be
represented
(2)
Bandwidth is an example of this type of composition. The bandwidth we are interested in here is the residual bandwidth that is available for new traffic. It can be defined as the minimum of the residual bandwidth of all links on the path or the bottleneck bandwidth.
♦ Multiplicative metrics: It can be represented mathematically as follows LK
m( p ) =
∏ m(lk ) i
( 3)
i =1
Loss probability (l), indirectly, is an example of this type of composition. Why indirectly? Loss probability metric can be easily transformed to its equivalent metric (the probability of successful transmission (st)) that follows the multiplicative composition rule [1]. Successful transmission (st) can be expressed as follows
st (lk ) = 1 − l (lk ) . st ( p ) =
(4)
LK
∏ st (lk i )
(5)
i =1
Therefore, the loss probability metric (l) can be represented mathematically as follows
l ( p) = 1 − {[1 − l (lk1 )] * [1 − l (lk 2 )] * ... * [1 − l (lk LK )]} (6)
Previous works
Many research and development efforts have been made towards providing QoS guarantees in the Internet. In [6], a new bandwidth allocation mechanism (BAM) is proposed. It uses less bandwidth than the peak rate BAM, while providing the same service. In [9], the use of QoS routing to enhance the support of IP Telephony is proposed. The proposed scheme is based on QoS intradomain OSPF routing, an extension of the conventional OSPF. [10] and [3] present a good overview of QoS in the Internet. The Internet Engineering Task Force (IETF) has proposed many service models, mechanisms and frameworks to meet the demand for QoS. Among them are Resource Reservation Protocol (RSVP) [11], Integrated Services (IntServ) [12], Differentiated Services (DeffServ) [13], Multiprotocol Label Switching (MPLS) [14], Aframework for QoS-based Routing in the Internet [15].
4
The Analytic Hierarchy Process (AHP)
The Analytic Hierarchy Process (AHP), a multicriteria technique developed by Saaty [16] [17], is a robust and flexible multi-criteria decision analysis methodology. AHP is a decision-support procedure for dealing with complex, unstructured, and multipleattribute decisions. Although most applications of AHP are in the area of socio-economic planning, there have been some applications in decisions related to road networks [18], petroleum pipeline networks [19], Health service [20], project management [21], and telecommunications [22] [23] [24]. There are four basic steps in using AHP [23] [24]: 1. The description of a complex decision problem as a hierarchy. In a typical hierarchy, the top level reflects the overall objective of the decision maker. The elements affecting the decision between alternatives are called criteria, metrics in our proposal, and they are represented at the intermediate levels. Criteria can be further divided into sub criteria for additional refinement. 2. The use of pair-wise comparisons to estimate the relative weight (importance or priority) of the various elements to each other. This gives what is called the priority weights. 3. The use of pair-wise comparisons to estimate the relative weight (importance) of the various elements on each level of the hierarchy. Every element on each level is compared with adjacent
4. The integration of these weights, from 2 and 3, to develop an overall score of decision alternatives. Then, the alternative with maximum overall score will be selected. The final score for an alternative is the sum of the product of the criterion importance weight, step 2, times its weight, with respect to that criterion, step 3, where the sum is taken across all criteria.
5
The First Proposed Algorithm (EBQRMPM)
5.1
Introduction
In this section we discuss situations in which the routing algorithm, EBQRMPM, chooses between different paths on the basis of how well the alternatives meet multiple and prioritised QoS metrics. Four QoS metrics are considered: Metric-1 Residual Bandwidth (B), Metric-2 Loss probability (L), Metric-3 End-to-End Delay (D) and Metric-4 Security (S=1 for secure or 0 for unsecure).
5.2
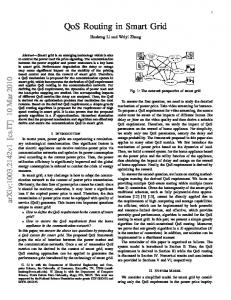
EBQRMPM Functionality in General
To illustrate how the EBQRMPM works, consider the network (N) shown in Figure 1. It consists of 6 nodes and 8 links. Therefore, its average is 2.7. Each link has four metrics; Residual bandwidth (b), loss probability (l), delay (d) and security (s), (1: secure, 0: insecure). It is required to set up a connection between two nodes s and t. It is better to consider all the four QoS metrics. On top of that, priorities of the metrics have to be considered when making the routing decision. For this example the priority order is bandwidth (1), loss probability (2), delay (3) and security (4).. The following steps illustrate, in general, how EBQRMPM works and determines which path to be selected in order to consider the four QoS metrics and their prioritisation (b,l,
V
d,s)
(b ,l,d ,s)
1 (b,l,d,s)
3
elements in respect of their importance. This gives what is called the score of each level in each element.
3
(b,l,d,s)
2
s) d, ,l, b (
(b,l,d,s)
(b,l,
d,s)
) ,d,s (b,l
W
4
Figure 1 Example of a small network. ♦ StepA: EBQRMM
finds all possible paths between s and t. this step includes finding the
overall metrics of each path following equations (1) (2) (3) (4) (5) (6). As can be seen from Figure 1, there are seven paths from a source (s) to a destination (t). These seven paths are summarised in Table1. Each path consists of more than one link.
Table 4 Normalised path scores on each metric.
1 2 3 4 5 6 7
Table 1 The seven paths from (s) to (t). Path #
1
2
3
4
5
6
7
Links
s12t
s1234t
s132t
s134t
s34t
s32t
s312t
∑
Table 2 Paths metrics: b (res. Bandwidth, l (loss), d (delay) and s (security). Metrics b
l
d
s
1 2 3 4 5 6 7
20 15 40 80 90 100 110
3e-6 5e-6 20e-6 10e-6 8e-6 15e-6 13e-6
20 4 3 10 5 13 15
1 0 1 0 1 1 1
b 0.0439 0.0329 0.0879 0.1758 0.1978 0.2198 0.2418 1
l 0.3502 0.2101 0.0525 0.1051 0.1313 0.0701 0.0809 1
d 0.0464 0.2321 0.3095 0.0929 0.1857 0.0714 0.0619 1
s 0.2 0.0 0.2 0.0 0.2 0.2 0.2 1
♦ Step_D: given the priority normalised weights
Assuming that the overall metrics of each path are as given in Table 2.
Path No#
Metrics
Path No#
(prnw) form Table 3 and the score of each path on each metric from Table 4, EBQRMPM will calculate the total score of each path using this equation: Total normalised score of path j = n ∑ prnwi * normalised score of path i =1
j
in metric i (7)
Computing each path’s total score, we obtain the results showed in the first row of Table5.
♦ Step_E:
now choose the path with the highest total score. Thus, the EBQRMPM would indicate that path 5 should be selected.
♦ Step_B:
EBQRMPM generates priority normalised weights, prnwi , (i=1, 2, 3, 4) for the
ith metric. For this example, the generated weights are shown in Table 3. The weights indicate that bandwidth (b) is the most important metric, followed by loss probability (l), delay (d), and security (s).
Table 3 priority normalised weight (with prioritisation: EBQRMPM). Priority NO# Priority normalised weight (prnw )
1 0.465819
2
3
0.27714
0.16107
4 0.09596
∑ 1
♦ Step_C: EBQRMPM will determine how well each path “scores” on each metric. For this example, the calculated normalised scores of each path on each metric are shown in Table4. It can be seen that path 7 best meets the metric of a high bandwidth (b), 0.24, but “scores” badly on all other metrics. It is worth mentioning here that these weights give accurate relative information about any path compared with all other paths.
5.2.1
Effect of changing priorities
If we change the priority of the metrics, the final path decision may change depending on how the total score will be after recalculations. Table5 and Figure 2 represent these changes in two different ways. Moreover, Figure 2 compares EBQRMPM algorithm, dark bars, with a modified version in which prioritisation of metrics is disabled. The modified version will be discussed in the next section. Changing priority is a natural action in order to meet some special requirements for certain traffic. For example, when routing delay sensitive traffic as in real-time applications, the delay metric will be the first priority while the loss metric will be in a lower priority level if not the least. In contrast, when routing loss sensitive traffic as in data transfer applications, the loss metric will be the first priority while the delay metric will be in a lower priority level if not the least.
Table 5 Effect of changing priority on the final path decision applying EBQRMPM algorithm. Priorities order
6
Selected path
Total normalised path score P1
P2
P3
P4
P5
P6
P7
BLDS BLSD BDLS BDSL BSLD BSDL
0.1442 0.1542 0.1089 0.0992 0.1368 0.1169
0.1109 0.0959 0.1135 0.0999 0.0715 0.0729
0.1246 0.1174 0.1544 0.1639 0.1345 0.1513
0.1259 0.1199 0.1246 0.1177 0.1077 0.1069
0.1776 0.1786 0.1839 0.1884 0.1865 0.1901
0.1525 0.1609 0.1526 0.1611 0.1759 0.1760
0.1642 0.1732 0.1619 0.1697 0.1870 0.1858
5 5 5 5 7 5
LBDS LBSD LDBS LDSB LSDB LSBD
0.2019 0.2119 0.2023 0.2121 0.2301 0.2301
0.1444 0.1293 0.1675 0.1654 0.1384 0.1255
0.1179 0.11075 0.1436 0.1509 01382 0.1238
0.1126 0.1066 0.1029 0.915 0.0808 0.0862
0.1651 0.1661 0.1637 0.1638 0.1655 0.1663
0.1242 0.1326 0.1071 0.1057 0.1206 0.13.3
0.1338 0.1428 0.1129 0.1102 0.1262 0.1379
1 1 1 1 1 1
DLBS DLSB DBLS DBSL DSBL DSLB
0.1449 0.1551 0.1094 0.0996 0.1174 0.1379
0.1717 0.1695 0.1511 0.1374 0.1336 0.1451
0.1921 0.1991 0.1962 0.2061 0.2188 0.2165
0.1007 0.0892 0.1089 0.1021 0.0817 0.0771
0.1739 0.1741 0.1817 0.1860 0.1864 0.1821
0.1073 0.1059 0.1247 0.1331 0.1308 0.1211
0.1094 0.1067 0.1281 0.1358 0.1309 0.1205
3 3 3 3 3 3
SBLD SBDL SDBL SDLB SLBD SLDB
0.1662 0.1464 0.1467 0.1667 0.2017 0.2019
0.0653 0.0667 0.0898 0.1013 0.0858 0.0988
0.1557 0.1724 0.1981 0.1958 0.1516 0.1660
0.0746 0.0738 0.0641 0.0595 0.0663 0.0609
0.1869 0.1905 0.1891 0.1848 0.1792 0.1785
0.1722 0.1723 0.1551 0.1453 0.1548 0.1452
0.1791 0.1771 0.1571 0.1465 0.1604 0.1487
5 5 3 3 1 1
The Second Proposed Algorithm (EBQRMM)
For the sake of comparison, we modified the EBQRMPM algorithm in order to disable the metric prioritisation. I.e. all metrics have the same level of importance or priority. The modified algorithm is called EBQRMM, Quality of Service Routing with Multiple Metrics. There are two possibilities in order to disable prioritisation; firstly, to remove the part of EBQRMPM algorithm that deals with the priority weighting. Secondly, to assign the same priority for all metrics, priority 1. Although, final results of both approaches are the same, We decided to choose the second approach because it needs less modification than the first one. Clearly, the priority normalised weights for all priorities will be 1/n as can be seen from Table 6, where n is the number of metrics.
Table 6 priority normalised weights (no prioritisation: EBQRMM algorithm). Priority NO# Priority normalised weight (prnw )
1
2
3
4
0.25
0.25
0.25
0.25
∑ 1
The Normalised path scores on each metric will be exactly the same as EBQRMPM (See Table 4). As can be seen from Table7 and Figure 2, changing priorities has no effect on the total scores of the paths and consequently has no effect on the final path decision when applying the modified algorithm, EBQRMM. Figure 2 also presents a comparison between EBQRMPM, dark bars, and EBQRMM algorithms, bright bars.
Table 7 final path decision applying EBQRMM algorithm (no prioritisation). Priorities order
P1
P2
P3
P4
P5
P6
P7
Selected path
BLDS BLSD BDLS BDSL BSLD BSDL
0.16014 0.16014 0.16014 0.16014 0.16014 0.16014
0.1188 0.1188 0.1188 0.1188 0.1188 0.1188
0.1625 0.1625 0.1625 0.1625 0.1625 0.1625
0.0934 0.0934 0.0934 0.0934 0.0934 0.0934
0.1787 0.1787 0.1787 0.1787 0.1787 0.1787
0.1403 0.1403 0.1403 0.1403 0.1403 0.1403
0.1461 0.1461 0.1461 0.1461 0.1461 0.1461
5 5 5 5 5 5
LBDS LBSD LDBS LDSB LSDB LSBD
0.16014 0.16014 0.16014 0.16014 0.16014 0.16014
0.1188 0.1188 0.1188 0.1188 0.1188 0.1188
0.1625 0.1625 0.1625 0.1625 0.1625 0.1625
0.0934 0.0934 0.0934 0.0934 0.0934 0.0934
0.1787 0.1787 0.1787 0.1787 0.1787 0.1787
0.1403 0.1403 0.1403 0.1403 0.1403 0.1403
0.1461 0.1461 0.1461 0.1461 0.1461 0.1461
5 5 5 5 5 5
DLBS DLSB DBLS DBSL DSBL DSLB
0.16014 0.16014 0.16014 0.16014 0.16014 0.16014
0.1188 0.1188 0.1188 0.1188 0.1188 0.1188
0.1625 0.1625 0.1625 0.1625 0.1625 0.1625
0.0934 0.0934 0.0934 0.0934 0.0934 0.0934
0.1787 0.1787 0.1787 0.1787 0.1787 0.1787
0.1403 0.1403 0.1403 0.1403 0.1403 0.1403
0.1461 0.1461 0.1461 0.1461 0.1461 0.1461
5 5 5 5 5 5
SBLD SBDL SDBL SDLB SLBD SLDB
0.16014 0.16014 0.16014 0.16014 0.16014 0.16014
0.1188 0.1188 0.1188 0.1188 0.1188 0.1188
0.1625 0.1625 0.1625 0.1625 0.1625 0.1625
0.0934 0.0934 0.0934 0.0934 0.0934 0.0934
0.1787 0.1787 0.1787 0.1787 0.1787 0.1787
0.1403 0.1403 0.1403 0.1403 0.1403 0.1403
0.1461 0.1461 0.1461 0.1461 0.1461 0.1461
5 5 5 5 5 5
Total normalised path score
E B Q R M P M : w ith p rio r itis a tio n
E B Q R M M : w ith o u t p rio r itis a tio n
7 6
4 3 2
P r i o r i tie s : (B : b a n d w id th , L : lo s s p ro b ., D :d e la y , S :s e c u rit y ) . N o te : p rio rit y is g iv e n b y th e o rd e r o f le tte rs .
Figure 2 Effect of changing priority on the final path decision.
SLDB
SLBD
SDLB
SDBL
SBDL
SBLD
DSLB
DSBL
DBSL
DBLS
DLSB
DLBS
LSBD
LSDB
LDSB
LDBS
LBSD
LBDS
BSDL
BSLD
BDSL
BDLS
0
BLSD
1
BLDS
Selected Path
5
7
[6]
M. Furini and D. F. Towsley, "Real-Time Traffic Transmissions Over the Internet," IEEE Transactions on Multimedia, vol. 3, no. 1, pp. 33-40, March 2001.
[7]
M. M. M. Al-Fawaz and M. E. Woodward, "Fast Quality of Service Routing Algorithms with Multiple Constraints," presented at 8th IFIP Workshop on ATM&IP, Ilkely, UK, pp. 01/1-01/10, Jul 2000.
[8]
R. O. Onvural, Asynchronous transfer mode networks : performance issues, 2nd ed. Boston: Artech House, 1995.
[9]
A. Dubrovsky, M. Gerla, S. S. Lee, and D. Cavendish, "Internet QoS Routing with IP Telephony and TCP Traffic," presented at IEEE International Conference in Communications ( ICC 2000), vol. 3, pp. 1348-1352, 2000.
Future Work
The proposed algorithm is still in its early stages of research and there are a number of issues for our future work: 1. Simulation experiments will be done on realistic topologies generated using well known tools, e.g. Waxman model for random network generation, in order to evaluate performance of the algorithms. The simulation will show us the behaviour of the proposed algorithms as the network size increases, scalability issue. 2. A comparison between the proposed algorithms and other proposed or published algorithms will be conducted in order to give them more credibility. Some preliminary results have been collected and they will be published nearly. 3. The algorithms applicability to wireless and mobile networks will also be investigated. For example to support QoS re-routing in the case of handover.
8
Conclusions
In this paper, we proposed two algorithms. The first one supports Enhanced Best effort Quality of service Routing with Multiple and Prioritised Metrics (EBQRMPM). The second one supports Enhanced Best effort Quality of service Routing with Multiple Metrics (EBQRMM). Both algorithms apply the concept of the Analytic hierarchy process (AHP) which is a very well known model in the area of decision making with multiple objectives. We showed how they work in general. We saw clearly how the final path decision changes as the priorities of the metrics change. The main novelty of this paper is the application of AHP approach which provides a convenient way to include multiple metrics in the proposed algorithms.
References [1]
Z. Wang and J. Crowcroft, "Quality-of-Service Routing for Supporting Multimedia Applications," IEEE Journal on Selected Areas in Communications, vol. 14, no. 7, pp. 12281234, 1996.
[2]
S. Chen and K. Nahrsted, "An Overview of Quality of Service Routing for Next-Generation High Speed Networks," IEEE Networks, vol. 12, no. 6, pp. 64-79, 1998.
[3]
G. Lu, "Issues and technologies for supporting multimedia communications over the Internet," Computer Communications, vol. 23, no. 14-15, pp. 1323-1335, 2000.
[4]
[5]
B. G. Kim, "The Soft QoS Service (SQS) in the Internet," presented at 4th IEEE International Conference on ATM (ICATM 2001), pp. 56-60, Apr 2001. A. M. S. Alkahtani, M. E. Woodward, K. Al-Begain, and A. Alghannam, "QoS Routing with Multiple and Prioritised Constraints Using the Concept of the Analytic Hierarchy Process (AHP)," presented at the International Network Conference, INC2002, pp243-251, Jul 2002.
[10] X. P. Xiao and L. M. Ni, "Internet QoS: A big picture," IEEE Networks, vol. 13, no. 2, pp. 8-18, 1999. [11] IETF: L. Zhang, S. Berson, S. Herzog, and S. Jamin, "Resource ReSerVation Protocol (RSVP)," http://community.roxen.com/developers/idocs/rfc/rfc2205.html, September 1997. [12] IETF: R. Braden, D. Clark, and S. Shenker, "Integrated Services in the Internet Architecture: an Overview," http://community.roxen.com/developers/idocs/rfc/rfc1633.html, June 1994. [13] IETF: S. Blake, D. Black, M. Carlson, E. Davies, Z. Wang, and W. Weiss, "An Architecture for Differentiated Services," http://community.roxen.com/developers/idocs/rfc/rfc2475.html, December 1998. [14] IETF: E. Rosen, A. Viswanathan, and R. Callon, "Multiprotocol Label Switching Architecture (MPLS)," http://community.roxen.com/developers/idocs/rfc/rfc3031.html, January 2001. [15] IETF: E. Crawley, R. Nair, and others, "A Framework for QoSbased Routing in the Internet," http://community.roxen.com/developers/idocs/rfc/rfc2386.html, Aug1998. [16] T. L. Saaty, The Analytic Hierarchy Process. New York: McGraw Hill, 1980. [17] W. L. Winston, Operations Research : Applications and Algorithms, 3rd ed: International Thomson Publishing, 1994. [18] P. Klungboonkrong and M. A. P. Taylor, "A microcomputerbased- system for multicriteria environmental impacts evaluation of urban road networks," Computers, Environment and Urban Systems, vol. 22, no. 5, pp. 425-446, 1998. [19] P. K. Dey and S. S. Gupta, "Decision-support system yields better pipeline route," Oil and Gas Journal, vol. 98, no. 22, pp. 68-73, 2000. [20] N.-P. Wang, "The aplication of analytic hierarchy process in the selection of hospital," Chinese Journal of Public Health, vol. 18, no. 2, pp. 138-151, 1999. [21] K. M. A.-S. Al-Harbi, "Application of the AHP in project management," International Journal of Project Management, vol. 19, no. 1, pp. 19-27, 2001. [22] N. Sato and H. Kataoka, "Selecting Network Services Based on Joint Assessment by Customer and Provider," presented at IEEE GLOBECOM’96 conference, vol. 1, pp. 634-638, 1996. [23] A. A. Andijani, "Buffer management of a switch for ATM networks: A multi-objective approach," Computer Systems Science and Engineering, vol. 13, no. 6, pp. 379-386, 1998. [24] C. Douligeris and I. J. Pereira, "A Telecommunications Quality Study Using the Analytical Hierarchy Process," IEEE J. on S. A. in Communications, vol. 12, no. 2, pp. 241-250, 1994.