vestigating the human brain cognitive functions. Because of the low ..... Talairach J, Tournoux P (1988) Co-planar Stereotaxic Atlas of the Human Brain. Stuttgart ...
Journal of Cerebral Blood Flow and Metabolism 14:639-M2 © 1994 The International Society of Cerebral Blood Flow and Metabolism Published by Raven Press, Ltd., New York
Enhanced Detection in Brain Activation Maps Using a Multifiltering Approach
Jean-Baptiste Poline and Bernard M. Mazoyer Groupe d'Imagerie Neurofonctionnelle, Service Rospitalier Frederic Joliot, DRIPP-CEA, Orsay, and C,R,V. Bichat, Vniversite Paris, France
Summary: Current methods for detecting activation foci
detection methods by using a multifiltering strategy that is shown to be more sensitive when various kinds of signals are present in the brain activation images. Key Words: Positron emission tomography- Brain activation Multifiltering-Detection sensitivity.
Over the last decade, positron emission tomogra
the same. Therefore, we propose a multifiltering de
in positron emission tomography difference images in clude a low pass filtering step aimed at improving the signal-to-noise ratio. However, we show that detection sensitivity depends both on the activation signal and the filter sizes, Therefore, we propose to improve current
phy (PET) has emerged as a powerful mean for in
tection (MFD) strategy that improves the previous
vestigating the human brain cognitive functions.
activation detection methods when various kinds of
Because of the low signal-to-noise ratio (SNR) of
signals are present. This new approach has been
the individual scans, the standard activation data
applied to simulated and experimental data and
analysis method consists in (a) stereotactic averag
compared to a single-filtering detection (SFD) strat
ing across subjects of the difference between the
egy.
task and the control state volumes, (b) use of low pass filtering, and (c) detection of statistically sig
METHODS
nificant foci (Fox et aI., 1988; Mintun et aI., 1989;
Methods, simulations, and experimental data will be
Friston et aI., 1991; Worsley et aI., 1992).
presented in the two-dimensional case (2D). Extension to the 3D case is straightforward and only computer cum bersome.
So far, these methods have been applied using a single low-pass filter size that is likely to be not optimal for all kinds of activation signals. As a mat
Single-filter detection
ter of fact, it has been shown that detection sensi
The SFD procedure is borrowed from Worsley (Wors ley et aI., 1992) for bidimensional data. After Gaussian filtering, the impulse response function ( IRF) of the averaged difference image is modelled by a 2D symmet ric Gaussian function with parameter (J' related to its full width at half maximum (FWHM) by (J' = FWHMV8In(2). The parameter (J', also called the smooth ness of the image, is assessed using the partial derivative of the spatial process (Adler, 198 1). The detection proce dure consists in assessing the threshold level t above which a pixel value is said to be significant at the a sig nificance level given by (Worsley et aI., 1992):
tivity of a given activation signal depends on the low-pass filter width used (Poline and Mazoyer,
1991). Indeed, there is an optimal filter for each kind of activation signal. Regarding PET brain activations, there is no ra tionale for assuming that these signals should all be
Received June 29, 1993; final revision received September 7, 1993; accepted December 27, 1993. Address correspondence and reprint requests to Dr. Bernard Mazoyer, Service Hospitalier Frederic Joliot, DRIPP-CEA, 91406 Orsay Cedex, France. Abbreviations used: AC-PC, anterior posterior commissural plane; FWHM, full width at half maximum; IRF, impulse re sponse function; MFD, multifiltering detection; PET, positron emission tomography; SFD, single-filtering detection; SNR, sig nal-to-noise ratio.
( 1) where S is the observed image surface size and to be 0.05.
a
is taken
In our work, the filtered data IRF FWHM was set at
639
f.-B. POLINE AND B. M. MAZOYER
640
18.8 mm (0' = 8 mm), which is comparable to the 20 mm FWHM value proposed by others (Friston et aI., 1991; Worsley et aI., 1992).
Multifiltering detection Multifiltering is an image processing tool that has been previously used in other research fields (Koenderink, 1984). A general overview of the MFD approach is sketched in Fig. 1. Gaussian filters of increasing width are successively applied to the original image and the detec tion procedure is applied to each filtered image with use of a significance level (xo. Suprathreshold regions made of
three chosen Gaussian kernels. Indeed, it has been shown
by Worsley that stereotactic averaged images can be ad
equately modeled by a smooth homogeneous Gaussian process (Worsley et aI., 1992). Images were 64 x 64 pix 2 els (pixel size is 2 x 2 mm ), which corresponds approx imately to an experimental brain axial slice surface size. Disk signals of various sizes (radius r = 4, 6, 8, 10, and 12 mm) and magnitUde (l.5, 7, 0.75, 0.5, and 0.4 image pixel standard deviation) were added to the uncorrelated noise only images before convolution. Since it can be easily
0.016, that would be applied if the three detection steps were independent.
shown that the SNR improvement due to the Gaussian filter only depends on the signal size and/or shape and not on its magnitude, this latter parameter has been kept con stant for each signal size. The single-filtering and multi filtering detection strategies were then applied, and the signal was said to be detected if the suprathreshold region center of mass was located within the original disk signal. The SFD method was applied three times with use of the three different image-smoothness values, thereby al lowing to investigate the effect of the filter width on the performance of the SFD approach. The sensitivity of the two methods was assessed as the percentage of correctly detected signals over 1,000 such simulated images for each configuration.
Simulated images
Experimental images
suprathreshold connected pixels found at each step are eventually combined to form the detected signal image. Three Gaussian filter widths were chosen resulting in im
age smoothnesses of 0' 4, 6, and 8 mm. On the basis of 3,000 Monte Carlo simulations of noise-only images (see Simulated Images), the level (xo at each detection step was set so that the overall type I error would be 0.05. This led to a single detection level (xo = 0.025, for which the false =
positive rate found in the simulation set was 0.046. Note that (xo is slightly greater than the Bonferroni level, i.e.,
MFD and SFD sensitivities were assessed with use of Monte Carlo simulated images obtained by convolving pseudo-Gaussian uncorrelated noise-only images with the
Original image
Gaussian filtering smoothness OJ
Detection algorithm at level
Uo
Store the detected supra-threshold regions (STRj
MFD and SFD were also compared on a set of exper imental images, the characteristics of which have been previously described (Poline and Mazoyer, 1993). Scans were performed on the TTV03 time-of-flight PET scan ner, which provides seven slices 12 mm apart (Mazoyer et aI., 1990). Experimental activation studies consisted of repeated H/ 50 80-mCi i.v. bolus injections. Images were reconstructed in 128 x 128 format, with a 2 x 2-mm pixel I size using a Hanning filter with a 0.25-mm - cut-off fre
quency, leading to a 7-mm FWHM spatial in plane trans verse resolution. Five right-handed young French male, healthy volun teers were scanned during two different states denoted R and A, this sequence being repeated twice (denoted by subscripts 1 and 2) for a total of four scans (RI, R2, AI' A2). State A was an auditory cognitive task, whereas state R consisted of a control silent state. Each scan was
normalized by the global activity in the brain, defined as the average radioactivity within the brain contours over the seven PET slices. Data were stereotactically averaged in the Talairach space as described by Fox et al. (Fox et aI., 1985; Talai rach and Tournoux, 1988) to produce a volume of the difference between the 10 state A and the 10 state R scans. An axial section taken in the middle of this volume [z = 18 mm above the anterior posterior commissural (AC-PC) plane, surface = 4,380 pixels] was analyzed by both the MFD method, with use of the same three Gaus sian kernels, and by the SFD method, with use of an image-smoothness parameter equal to 8 mm.
RESULTS Yes
Combined all detected STR in one image FIG. 1. Flow chart of the multifiltering detection method.
J Cereb Blood Flow Metab, Vol. 14, No.4, 1994
Simulated data
Table 1 presents the results for MFD and SFD on the simulated data. It first demonstrates that the filter that maximizes the detection sensitivity de pends on the size of the signal to be detected and that an inadequate filter choice can drastically
MULTIFILTERING OF BRAIN ACTIVATION MAPS TABLE 1. Comparison of single-filtering detection (SFD) and multifiltering detection (MFD) sensitivities (%) for simulated disk signals of various sizes and magnitudes r
Strategy
4 (1.5)
6 (1.0)
10 (0.5)
12 (0.4)
-----_.,,--'_._-- --
SFD CT
=
CT
=
CT
=
MFD
4 6 8
62. 1 31.4 12. 0 55. 6
80. 2 66.7 42. 6 75. 1
Multijlltering detection (MFD) and single-filtering detection (SFD) results on an experimental positron emission tomography (PET) axial plane TABLE 2.
(m)
8 (0.75) 74. 3 75.4 61. 4 73. 7
39. 8 57. 8 54. 3 50. 7
27.5 46. 3 50. 7 43. 4
Detection sensitivities of MFD and SFD were assessed with use of disk signals of various size (disk radius r in mm) added to normal distributed noise. Three different SFD procedures were performed at the 0. 05 significance level using three Gaussian filters (smoothness CT in mm) on over 1,000 64 x 64 simulated images. Signal magnitude (m) is expressed in image noise stan dard deviation units. MFD was applied on the same images using the same three filters with an estimated type I error of 0.046.
lower the SFD sensitivity (up to a factor 5 in our simulations). Secondly, these results show that for a given signal size, the MFD sensitivity is at worst
10% below the sensitivity of the optimal filter, whereas it is often two or three times better than the
641
SFD MFD
CT
X
Y
z
Z score
p
Localization
8 4 6 8
-44 +46 - 44 -44
-34 -18 -32 -34
18 18 18 18
4. 23 4. 24 4.27 4.23
.0021 .0184 . 0041 . 0021
Left 22 Right 40 Left 22 Left 22
Detection results for MFD and SFD on a section of 10 stereo tactically averaged PET difference volumes. CT, in mm, is the resulting image smoothness. x, y, z: stereotactic coordinates of the maximum value pixel detected by the two methods. Z score: value of the detected local maxima. p: probability of the occur rence computed with Eq. I. Brain localization is Brodmann area number as proposed by the Talairach atlas (Talairach and Tournoux, 1988). SFD did not significantly detect the right hemi sphere activation that was found significant with MFD, thanks to the smallest filter of the series. Notice also that the left hemi sphere activation was no longer detected at the 0.025 significance level with this small width filter. Filters CT 6 mm and CT 8 mm detected almost the same suprathreshold regions that form one connex component in the combined signal image. =
=
tions were consistent with the results of a region of-interest analysis applied to these data (Mazoyer et aI., 1993).
score of the worst choice. DISCUSSION
Experimental data
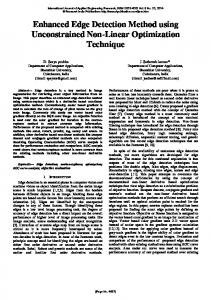
Figure 2 shows the central axial plane taken from
We have shown that a multifiltering strategy can
the stereotactic volume of the five subjects without
improve the detection sensitivity of PET activa
and with the use of the three Gaussian filters (re
tions. Ours is also a first attempt to deal with the
sulting smoothness 4, 6, and 8 mm). Notice that the
arbitrary choice of the low-pass filter used in cur
activation signal in the right hemisphere (left side of
rent detection methodologies.
the image) is lowered by the large filters. This is
In the experimental example presented above,
also shown by Table 2 in which MFD detected both
the loss of sensitivity of the single-filter procedure
a left and a right activation, the latter not being
was due to the presence of a small-sized activation.
detected with the single-filter (a
8 mm) strategy for which the probability of the upcross was 0.121.
shown in the simulation results: a large signal may
The locations of both the right and the left activa-
not be filtered enough to be detected.
=
However, the opposite case may also happen, as
max
min
(a)
(b)
(e)
(d)
FIG. 2. A: Axial section (18 mm above AC-PC plane) of the stereotactic average of 10 positron emission tomography difference brain activation volumes. The surface of the section is 4,380 pixels. 8, C, D: Previous image after convolution with Gaussian filters resulting in image smoothness of 4, 6, and 8 mm, respectively. The activation on the left side of the image is detected by the multifiltering detection method at the 0.05 significance level thanks to the smallest width filter, whereas it is not by the single-filtering detection approach (p 0.121) using an 8-mm smoothness (full width at half maximum 18.8 mm). =
=
J Cereb Blood Flow Metab, Vol. 14, No.4, 1994
642
i.-B. POLINE AND B. M. MAZOYER
Therefore, the choice of the filter series appears
As suggested by this work, multifiltering could be
to be of critical importance. It should be based on
a mean for going further both in the detection and
an a priori knowledge of the expected signal or on
the localization aspects of brain activation data
the estimated activation signal size and shape of
analysis. The approach is general enough to be in
previous studies. For a valid statistical analysis,
tegrated to the various detection methods of the
this choice has to be made before applying the sta
various PET research groups. It is also applicable to
tistical tests. If activation studies were to produce
brain activation images obtained by other modali
only a constant and known kind of signal, it would
ties such as functional magnetic resonance imaging.
be preferable to choose the filter that would maxi mize its detection and indeed, when both the shape of the signal and the detection test are known, a theoretical formula can be derived and the optimal filter chosen. However, as illustrated by the above experimental example, it seems more likely that brain activations are of various sizes and shapes, leading to a preferable multifiltering methodology. It also suggests that this variability should be stud ied in order to build an optimal filter series. The noise model chosen here is identical to that of previous work in the same area (Friston et aI.,
1991; Worsley et aI., 1992), and it has been shown to be adequate for simulating experimental stereo tactically averaged difference images. Although one could think of using a more accurate noise model, it is very unlikely that the benefits of the MFD strat egy would depend on it because the noise model mainly concerns the detection procedure. Note also that Gaussian filter may be applied before or after the averaging or the substraction process, thanks to the Gaussian filtering linearity property. Muitifiltering strategy may not only improve the detection sensitivity but also provide important in formation about the activation size and location. Since large (respectively small) signals are more likely to be detected by large (respectively small) filters, the size of the filter that detects (or best detects) the activation also informs the experi menter of the more probable activated region size. However, the correspondence between filter and signal sizes depends on the signal shape (unknown) and therefore should provide only a first approxi mation. We believe this approximation to be poten tially useful and in any case more appropriate than the size of the suprathreshold region given by Eq. 1, which was much smaller than the true activation size in our simulations. A comparable discrepancy was also visually observed in the experimental data.
J Cereb Blood Flow Metab, Vol. 14, No.4, 1994
Acknowledgment: The authors are indebted to N. Tzourio and L. Raynaud (Orsay) and to their colleagues from the Laboratoire de Psycholinguistique et Sciences Cognitives, CNRS, Paris. This work has been supported in part by a grant from the Ministere de la Recherche et de la Technologie, Action Sciences de la Cognition.
REFERENCES Adler RJ (1981) The Geometry of Random Fields. New York, Wiley Fox PT, Perlmutter SJA, Raichle ME (1985) A stereotactic method of anatomical localization for positron emission to mography. J Comput Assist Tomogr 9:141-153 Fox PT. Mintun MA, Reiman EM, Raichle ME (1988) Enhanced detection of focal brain responses using intersubj ect averag ing and change-distribution analysis of substracted PET im ages. J Cereb Blood Flow. Metab 8:642-653 Friston KJ, Frith CD, Liddle PF, Frackowiak RSJ (1991) Com paring functional (PET) images: the assessment of signifi cant change. J Cereb Blood Flow Metab II : 690-699 Koenderink JJ (1984) The structure of images. Bioi Cybern 50: 363-370 Mazoyer BM, Trebossen R, Shoukroun C, Verrey B, Syrota A, Vacher J, Lemasson P, Monnet 0, Bouvier A, Lecomte JL (1990) Physical characteristics of TTV03, a new high spatial resolution time-of-flight positron tomograph. IEEE Trans Nucl Sci 37:778-782 Mazoyer BM, Dehaene S, Tzourio N, Frak V, Murayama N, Cohen L, Levrier 0, Salamon G, Syrota A, Mehler J (1993) The cortical representation of speech. Journal of Cognitive Neuroscience 5: 467-479 Mintun MA, Fox PT, Raichle ME (1989) A highly accurate method of localizing region of neuronal activation in the hu man brain with positron emission tomography. J Cereb Blood Flow Metab 9:96-103 Poline JB, Mazoyer BM (1991) Towards an individual analysis of brain activation PET studies: optimal filtering of difference images. J Cereb Blood Flow Metab I I(suppl 2):S564 Poline 18, Mazoyer BM (1993) Analysis of individual positron emission tomography activation maps by high signal to noise ratio pixel cluster detection. J Cereb Blood Flow Metab 13: 425-437 Talairach J, Tournoux P (1988) Co-planar Stereotaxic Atlas of the Human Brain. Stuttgart, Georg Thieme Verlag Worsley KJ, Evans AC, Marrett S, Neelin J (1992) A three dimensional statistical analysis for CBF activation studies in human brain. J Cereb Blood Flow Metab 12:900-918