polymers Article
Enhancement in Mechanical and Shape Memory Properties for Liquid Crystalline Polyurethane Strengthened by Graphene Oxide Yueting Li 1,2 , Huiqin Lian 1, *, Yanou Hu 1 , Wei Chang 1,2 , Xiuguo Cui 1, * and Yang Liu 1 1
2
*
Beijing Key Lab of Special Elastomer Composite Materials, College of Materials Science and Engineering, Beijing Institute of Petrochemical Technology, Beijing 102617, China;
[email protected] (Y.Li);
[email protected] (Y.H.);
[email protected] (W.C.);
[email protected] (Y.Liu) College of Materials Science and Engineering, Beijing University of Chemical Technology, Beijing 100029, China Correspondence:
[email protected] (H.L.);
[email protected] (X.C.); Tel.: +86-10-8129-2129 (H.L.)
Academic Editor: Joannis K. Kallitsis Received: 22 April 2016; Accepted: 9 June 2016; Published: 19 July 2016
Abstract: Conventional shape memory polymers suffer the drawbacks of low thermal stability, low strength, and low shape recovery speed. In this study, main-chain liquid crystalline polyurethane (LCPU) that contains polar groups was synthesized. Graphene oxide (GO)/LCPU composite was fabricated using the solution casting method. The tensile strength of GO/LCPU was 1.78 times that of neat LCPU. In addition, shape recovery speed was extensively improved. The average recovery rate of sample with 20 wt % GO loading was 9.2˝ /s, much faster than that of LCPU of 2.6˝ /s. The enhancement in mechanical property and shape memory behavior could be attributed to the structure of LCPU and GO, which enhanced the interfacial interactions between GO and LCPU. Keywords: graphene oxide; liquid crystalline polyurethane; composites; shape memory property
1. Introduction Shape-memory polymers (SMPs) are smart materials that have attracted much attention in fields ranging from the scientific to the industrial. SMPs are good candidates for clothing manufacturing, deployable space structures, morphing aircraft, and medical treatment due to their excellent structural versatility, high shape recovery ratio, easy processing, and low cost [1]. SMPs have the ability to memorize a permanent shape and to be programmed for one or many temporary shapes. They recover their original permanent shapes from temporary deformations under external stimuli of heat, light, electricity, and solution [2]. Typically, SMPs contain at least two separate phases: a crosslink phase, which determines the permanent shape, and a switching segment, which is responsible for the temporary shape [3]. Usually, many polymers show shape memory behavior, including cross-linked PE, cross-linked ethylene-vinyl acetate copolymer, and epoxy [4]. Among them, polyurethane (PU)-based SMP offers many advantages in terms of structure designable, higher shape recoverability, a wider range of shape recovery temperature, and better biocompatibility. However, neat SMP materials suffer from relatively low thermal stability, strength, and stiffness, which hinders their applications as functional and structural materials [5,6]. It has been noticed that liquid crystalline polymers (LCPs) have unique properties in that the orientational ordering of the polymer chains in the melt phase distinguishes it from the isotropic phase [7,8]. Typically, LCPs have the virtues of a high mechanical strength at high temperatures, extreme chemical resistance, and a good weather ability, which benefits the shape memory effect [9].
Polymers 2016, 8, 236; doi:10.3390/polym8070236
www.mdpi.com/journal/polymers
Polymers 2016, 8, 236
2 of 13
It is well known that the mechanical properties of SMPs are strongly dependent on the aspect ratio of the filler and the interaction between the filler and the elastomer [10]. Coleman reports that carbon nanotubes improve the stiffness of polymethylmethacrylate [11]. Graphene oxide (GO) is a two-dimensional nanomaterial with a typical pseudo-two-dimensional structure that can provide reinforcement to the base polymer matrix [12]. Wallace et al. [13,14] reported highly stretchable electrodes composed of reduced GO, single-walled carbon nanotubes (SWNTs), and PU via a spray coating technique. The GO/SWCNT/PU composite electrode has potential advantages for wearable and biocompatible devices. In this work, a novel structure of SMP is reported. Main-chain liquid crystalline PU was synthesized through in-situ polymerization, which improved the mechanical property of PU. Moreover, the ionic group was introduced to PU, which enhanced the compatibility of GO with the PU matrix. Furthermore, GO was added to PU to enhance the mechanical property and the shape memory performance of the PU-based SMP in terms of shape-recovery and response speed. This method presented an effective way of fabricating the GO/liquid crystalline polyurethane (LCPU) composite. The drawbacks of low thermal stability, strength, and stiffness, from which conventional SMPs suffer, can be simultaneously overcome. 2. Materials and Methods 2.1. Materials 4,41 -methylenediphenyl diisocyanate (MDI), 1,6-hexanediol (HDO), 2,2-dimethylol propionic acid (DMPA), polytetramethylene ether glycol (PTMG, Mn = 1000), N,N-dimethylformamide (DMF, 99.9 wt % purity), and graphite were obtained from Shanghai Aladdin Bio-Chem Technology Co., LTD. (Shanghai, China). PTMG was purified by dehydrated at 100 ˝ C in a vacuum for 1 h. DMF was dried with CaH2 and distilled under reduced pressure prior to use. Graphene oxide (GO) was prepared from graphite powders using Hummers’ method [15]. 2.2. Procedure of Producing GO/LCPU Composites 2.2.1. Preparation of LCPU In a three-neck round-bottomed flask equipped with a mechanical stirrer and condenser, the mixture of 5.0 mmol PTMG-1000 (5.00 g), 10.0 mmol MDI (2.50 g), and 15 mL of DMF were heated to 80 ˝ C for 1 h in nitrogen. Then, 2.5 mmol HDO (2.95 g) and 2.5 mmol DMPA (3.35 g) were added slowly. The mixture solution was heated at 80 ˝ C for 12 h. Films were produced by casting the product into polytetrafluoroethylene mold and allowing them to dry at 80 ˝ C for 12 h. 2.2.2. Preparation of GO/LCPU Composite Membrane A solution casting method was used to prepare a series of GO/LCPU composite films. The procedure to prepare GO/LCPU composite films was as follows: First, a certain amount of GO was dispersed in the DMF (20 wt %) and ultrasonicated for 30 min. The amounts of GO added were 5, 10, 15, and 20 wt % of the mass of LCPU, hereafter referred to as LCPU5, LCPU10, LCPU15, and LCPU20, respectively. Then, LCPU was added, followed by stirring at 25 ˝ C for 30 min, and then ultrasonicated for 30 min. Finally, the mixture dispersion was cast in an oven at 80 ˝ C for 24 h forming a film layer with a thickness of 3 mm. In addition, the LCPU5, LCPU10, LCPU15, and LCPU20 are used to represent the LCPU5, LCPU10, LCPU15, and LCPU20, respectively. 2.3. Characterization Fourier transform infrared (FT-IR) spectra were recorded on a Thermo Scientific Nicolet 6700-OMNI Smart Accessory Spectrum FT-IR spectrometer (Thermo Scientific, Waltham, MA, USA). X-ray diffraction (XRD) spectra were collected on Bruker D8 Focus (BRUKER AXS, Berlin, Germany).
Polymers 2016, 8, 236
3 of 13
Differential scanning calorimetry (DSC) was performed in a range from ´50 to 250 ˝ C. The scans was performed at a heating and cooling rate of 10 ˝ C¨ min´1 in a nitrogen atmosphere (flow = 40 mL¨ min´1 ). Thermogravimetric analysis (TGA) was carried out on a TA AQ-500 (TA Instruments, Waltham, MA, USA) in the range of 25 ˝ C–500 ˝ C in nitrogen (flow = 50 mL¨ min´1 ) at a heating rate of 20 ˝ C¨ min´1 . LC textures were observed under a polarizing optical microscope (POM) on a Leica DM4500P (LEICA, Berlin, Germany) equipped with a hot stage. Scanning electron microscopy (SEM) was performed with field emission SEM (FESEM) S-4800 (Hitachi, Tokyo, Japan) at an acceleration voltage of 100 kV. X-ray photoelectron spectroscopy (XPS) analyses were carried out using a Kratos AXIS-ULTRA (SHIMADZU, Kyoto, Japan). Raman spectrum was performed with a Renishaw RM2000 confocal Raman spectrometer (RENISHAW, London, UK) with a 514-nm excitation laser. Atomic force microscopy (AFM) was performed with Asylum Research MFP-3D Classic (OXFORD Instruments, Oxford, UK) in tapping mode. Transmission electron microscopy (TEM) was performed with Tecnai G2 20 S-TWIN (FEI, Hillsboro, OR, USA). Tensile tests were carried out at a room temperature (25 ˝ C) using a Instron 5567 (INSTRON, Boston, MA, USA). A cross-head speed was set at 50 mm/min to ensure the stress–strain curves were gained to illustrate the toughness or the stored energy of the samples. Characterization of the shape memory performance was carried out using a digital camera. All samples were annealed in an oven at 120 ˝ C for 1 h before tests. The rectangle membrane was folded along its longitudinal center forming two small rectangle planes with an angle of 0˝ at 90˝ C and the deformation was kept at 0 ˝ C for 10 min. Upon stopping cooling, a small angle (Au ) of the sample was recovered instantaneously. Then, all samples were put into the dryer at 90 ˝ C, and the shape recovery was recorded by camera. The shape fixity (Rf ) and shape recovery ratio (Rr ) were calculated according to Equations (1) and (2), where Am was the angle after reheated. The angle was read from the protractor below the samples. ˝
Rf p%q “
p180 ´ Au q ˆ 100 , and ˝ 180
(1)
Am ˆ 100 . ˝ 180
(2)
Rr p%q “ 3. Results and Discussion 3.1. Characterization of GO
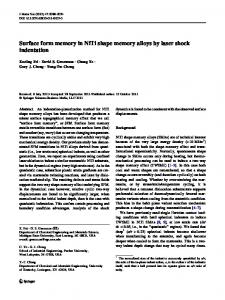
GO was obtained from graphite power through oxidation. The creating polar groups (carboxyl group, hydroxyl) on the surface of graphite benefitted the dispersion of GO in solution. The chemical characteristics of GO were studied using X-ray photoelectron spectroscopy, as shown in Figure 1a. The C1s spectrum of the GO film showed that it consisted of two main components arising from C to O (hydroxyl and epoxy, ~286.5 eV) and C=C/C–C (~284.6 eV) groups and two minor components from C=O (carbonyl, ~288.3 eV) and O–C=O (carboxyl, ~290.3 eV) groups. The degree of oxidation of GO was measured by the surface O/C atomic ratio. From Figure 1a, the O/C atomic ratio of GO is 0.47, which is higher than the reported value of 0.44 [16]. The Raman spectrum of GO film (Figure 1b) showed two intensity peaks: the D-band (ID) around 1350 cm´1 and the G-band (IG) around 1580 cm´1 . The D-band was caused by the defects and disorders in the hexagonal graphitic layers, while the G-band corresponded to an E2g mode of graphite [17]. The ID/IG ratio of GO was 0.93, which was higher than that of 0.91 reported by Zoraida [16]. It was
Polymers 2016, 8, 236 Polymers 2016, 8, 236
4 of 12 4 of 13
disorders in the hexagonal graphitic layers, while the G-band corresponded to an E2g mode of graphite [17]. The ID/IG ratio of GO was 0.93, which was higher than that of 0.91 reported by consistent the result of XPS. Thethe TEM image GO The (Figure 1c)image showed flat (Figure structure. The AFM a Zoraida [16].with It was consistent with result of of XPS. TEM ofaGO 1c) showed image of GO (Figure 1d) showed that the thickness of GO was about 3 nm. flat structure. The AFM image of GO (Figure 1d) showed that the thickness of GO was about 3 nm.
Figure 1. 1. Characterization (a) X-ray X-rayphotoelectron photoelectronspectroscopy spectroscopy (XPS) Figure Characterizationofofgraphene graphene oxide oxide (GO). (GO). (a) (XPS) of of GOGO film; (b) Raman spectrum of GO film; (c) transmission electron microscopy (TEM) of GO; (d) atomic film; (b) Raman spectrum of GO film; (c) transmission electron microscopy (TEM) of GO; (d) atomic force microscopy force microscopy(AFM) (AFM)of ofGO. GO.
3.2. FT-IR 3.2. FT-IR The composite films areare shown in in Figure 2. 2. The TheFT-IR FT-IRspectra spectraofofGO, GO,LCPU, LCPU,and andGO/LCPU GO/LCPU composite films shown Figure spectrum of LCPU showed somesome typical functional groups. The most relevant The spectrum of LCPU showed typical functional groups. The most relevantbands bandscorresponded corresponded to 1 −1,´which N–H stretching at 3174–3160 cm indicated that polyurethanes were capable forming to N–H stretching at 3174–3160 cm , which indicated that polyurethanes were capable ofof forming hydrogen bonds in in which thethe N–H group of of thethe urethane linkage was thethe proton donor [18]. The hydrogen bonds which N–H group urethane linkage was proton donor [18]. 1 were assigned to the CH groups. The absence of NCO −1 were The of peaks of2850, 2925,and 2850, andcm 1410 cm´assigned peaks 2925, 1410 to the CH2 groups. The absence of NCO groups at 2 ´ 1 −1 groups atcm 2250–2279 cmthatindicated thatproceeded the reaction proceeded complete of the 2250–2279 indicated the reaction until completeuntil conversion ofconversion the isocyanate [19]. In addition,ofthe spectrum of LCPU the characteristic and N–CO–O In isocyanate addition, [19]. the spectrum LCPU showed the showed characteristic C–O and C–O N–CO–O stretching ´1 ) bands in polyurethanes. The peak−1at 1729 cm´1 was −1; 1058–1056 −1) bands cm stretchingcm (1219–1218 cm´1cm ; 1058–1056 (1219–1218 in polyurethanes. The peak at 1729 cm was related to the related to the carboxyl groups. These spectral features showed was successfully synthesized. carboxyl groups. These spectral features showed that LCPU that wasLCPU successfully synthesized. There are ´1 , C=O stretching There are some typical features of GO shown in Figure 1c: O–H stretching at 3630 cm −1 some typical features of GO shown in Figure 1c: O–H stretching at 3630 cm , C=O stretching at 1725 ´1 , and C–O–C vibration of epoxy at 1070 cm´1 [20]. cmat−1,1725 andcm C–O–C vibration of epoxy at 1070 cm−1 [20].
Polymers 2016, 8, 236 Polymers 2016, 8, 236
5 of 13 5 of 12
Figure 2. Fourier transform infrared (FT-IR) spectra of GO, liquid crystalline polyurethane (LCPU), and LCPU with 5 wt % GO (LCPU5).
3.3. XRD The XRD patterns of LCPU, GO, and GO/LCPU composite films with different doping levels are shown in Figure 3. In Figure 3a, the broad peak of 2θ around 19.6° appearing in LCPU was the characteristic peak of semi-crystallization of LCPU [21]. The GO showed a strong diffraction peaks at 2θ of 12.1° (Figure 3f), corresponding to a d-spacing of 0.73 nm. It was noticed that a weak diffraction peak at 2θ of 26.8° from graphite Figure 2. Fourier transform infrared (FT-IR) spectra of GO, liquid crystalline polyurethane (LCPU), Figure that 2. Fourier transform (FT-IR) spectra of GO, liquid crystalline polyurethane (LCPU), indicated the GO was notinfrared fullyand oxidized. LCPU with 5 wt % GO (LCPU5). and LCPU with 5 wt % GO (LCPU5). For the GO/LCPU composites, the peak intensity marginally increased to 2θ = 20.9° (LCPU5), XRD 20.6°3.3. (LCPU10), 20.3° (LCPU15), and 20.3° (LCPU20), respectively. This could be related to the 3.3. XRD crystallinity caused by theof GO in theGO, LCPU duecomposite to the strong effect GO has within The XRD patterns LCPU, and matrix GO/LCPU filmsnucleating with different doping levels the The polymer matrix. Besides, the XRD pattern of the GO/LCPU composites showed no peak at 2θ = are shown in Figureof 3. LCPU, In Figure 3a, and the broad peak ofcomposite 2θ around 19.6° in LCPU was the XRD patterns GO, GO/LCPU filmsappearing with different doping levels ˝ 12°,shown originating from loss of 3a, regularity exfoliation of the GO the LCPU, in which indicated characteristic peak of oforLCPU [21]. are in Figure 3. the Insemi-crystallization Figure the broad peak of 2θ around 19.6in appearing LCPU was thea The GO showed a strong diffraction peaks at 2θ of 12.1° (Figure 3f), corresponding to a good dispersion of fillers in the LCPU matrix. characteristic peak of semi-crystallization of LCPU [21]. d-spacing of 0.73 nm. It was noticed that a weak diffraction peak at 2θ of 26.8° from graphite indicated that the GO was not fully oxidized. For the GO/LCPU composites, the peak intensity marginally increased to 2θ = 20.9° (LCPU5), 20.6° (LCPU10), 20.3° (LCPU15), and 20.3° (LCPU20), respectively. This could be related to the crystallinity caused by the GO in the LCPU matrix due to the strong nucleating effect GO has within the polymer matrix. Besides, the XRD pattern of the GO/LCPU composites showed no peak at 2θ = 12°, originating from the loss of regularity or exfoliation of the GO in the LCPU, which indicated a good dispersion of fillers in the LCPU matrix.
Figure3.3.X-ray X-raydiffraction diffraction(XRD) (XRD)patterns patternsofofLCPU LCPU(a); (a);LCPU5 LCPU5(b); (b);LCPU LCPUwith with10 10wt wt%%GO GO(LCPU10) (LCPU10) Figure (c); LCPU with 15 wt % GO (LCPU15) (d); LCPU with 20 wt % GO (LCPU20) (e); and GO (c); LCPU with 15 wt % GO (LCPU15) (d); LCPU with 20 wt % GO (LCPU20) (e); and GO (f). (f).
3.4. TGA The GO showed a strong diffraction peaks at 2θ of 12.1˝ (Figure 3f), corresponding to a d-spacing ˝ from stabilitythat of composites was characterized by26.8 TGA (Figure 4). A indicated magnifiedthat picture of 0.73The nm.thermal It was noticed a weak diffraction peak at 2θ of graphite the of awas local part was inserted for better distinctness. It clearly showed that the curves shifted towards GO not fully oxidized. Figure 3. X-ray diffraction (XRD) patterns of LCPU (a); LCPU5 (b); LCPU with 10 wt % GO (LCPU10) ˝ higher after into the LCPU matrix. to estimate the stability, Fortemperatures the GO/LCPU composites, the peak intensity marginally 2θ = thermal 20.9 (c); LCPU with 15adding wt % GOGO (LCPU15) (d); LCPU with 20 wtIn %order GO increased (LCPU20) (e);toand GO (f). (LCPU5), ˝ ˝ ˝ the temperatures corresponding 2% 20.3 (T2%) and 50% (T50% ) weight-lossThis of the composites weretotaken 20.6 (LCPU10), 20.3 (LCPU15),toand (LCPU20), respectively. could be related the 3.4.criteria. TGAcaused as the The 2% and T50% LCPU20 243theand 377 nucleating °C increased 5 has andwithin 34 °C, crystallinity byTthe GO in the of LCPU matrixwere due to strong effectbyGO the polymer Besides,ofthe XRD pattern of the GO/LCPU composites showed no peak at Thematrix. thermal stability composites was characterized by TGA (Figure 4). A magnified picture 2θ = 12 from the loss of regularity or exfoliation of the GO the LCPU, which indicated of˝a, originating local part was inserted for better distinctness. It clearly showed thatin the curves shifted towards temperatures after GO into the LCPU matrix. In order to estimate the thermal stability, a goodhigher dispersion of fillers inadding the LCPU matrix. the temperatures corresponding to 2% (T2%) and 50% (T50%) weight-loss of the composites were taken
3.4. TGA as the criteria. The T2% and T50% of LCPU20 were 243 and 377 °C increased by 5 and 34 °C, The thermal stability of composites was characterized by TGA (Figure 4). A magnified picture of a local part was inserted for better distinctness. It clearly showed that the curves shifted towards higher temperatures after adding GO into the LCPU matrix. In order to estimate the thermal stability, the
Polymers 2016, 8, 236
6 of 13
temperatures corresponding to 2% (T2% ) and 50% (T50% ) weight-loss of the composites were taken as Polymers 2016, 8, 236 6 of 12 the criteria. The T2% and T50% of LCPU20 were 243 and 377 ˝ C increased by 5 and 34 ˝ C, respectively, ˝ C). Obviously, the addition of GO into the LCPU was compared with that of LCPU 343 (238 respectively, compared with(238 thatand of LCPU and 343 °C). Obviously, the addition of GO into the able toLCPU significantly the thermal of the composites. This is probably owing to the was able improve to significantly improvestability the thermal stability of the composites. This is probably “tortuous path” effect of graphene sheets, which delayed the escape of volatile degradation products owing to the “tortuous path” effect of graphene sheets, which delayed the escape of volatile degradation products and char formation as well [22]. and char formation as well [22].
Polymers 2016, 8, 236
6 of 12
respectively, compared with that of LCPU (238 and 343 °C). Obviously, the addition of GO into the LCPU was able to significantly improve the thermal stability of the composites. This is probably owing to the “tortuous path” effect of graphene sheets, which delayed the escape of volatile degradation products and char formation as well [22].
Figure 4. Thermogravimetric analysis (TGA) curves: LCPU (a); LCPU5 (b); LCPU10 (c); LCPU15 (d);
Figure 4. Thermogravimetric analysis (TGA) curves: LCPU (a); LCPU5 (b); LCPU10 (c); LCPU15 (d); LCPU20 (e). LCPU20 (e). 3.5. DSC
3.5. DSC
The dependence of the thermal transition temperatures on the LCPU and GO/LCPU composites
Heat flow (W/g)
were studied via DSC experiments. Figure 5 showed the heating DSCLCPU curves and of the samples at acomposites rate The dependence of the thermal transition temperatures on the GO/LCPU of 10 °C/min in a nitrogen atmosphere after eliminating the thermal history. Based on the heating were studied via DSC experiments. Figure 5 showed the heating DSC curves of the samples at a rate transition temperatures of the films are shown in Table 1. It can be seen that there of 10 ˝process, C/min all in phase a nitrogen atmosphere after eliminating the thermal history. Based on the heating were three thermal events in the range from −50 to 250 °C. process, all phase transition temperatures of the films are shown in Table 1. It can be seen that there Figure 4. Thermogravimetric analysis (TGA) curves: LCPU (a); LCPU5 (b); LCPU10 (c); LCPU15 (d); ˝ were three thermal events in the range from ´50 to 250 LCPU20 (e). C. First, the single glass transition identified from Figure 5 illustrated that the monomers were placed LCPU 3.5. along DSC the main chain without phase separation randomly [23]. All phase transition temperatures of the films areThe listed in Tableof1.theThe glasstransition transition temperature (TLCPU was observed at about dependence thermal temperatures on the and GO/LCPU composites LCPU5 g ) of LCPU via DSC experiments. Figure 5 showed the heating DSC curves of the samples at a rate 40.8 ˝ C.were Thestudied Tg values of the GO/LCPU composites were slightly higher than those of the LCPU. LCPU10 ˝ of 10 °C/min in a nitrogen atmosphere after eliminating the thermal history. Based on the heating Among all samples, LCPU 20 exhibited the highest TLCPU15 g of 42.8 C. The increasing T g of the GO/LCPU process, phase transition of the films are shown in Table 1. It can be seen that there composites areall attributed to the temperatures well-dispersed GO that LCPU20interacted with the LCPU and hindered the were three thermal events in the range from −50 to 250 °C. relaxation of the polymer chain.
Heat flow (W/g)
LCPU
0
50
100
150
LCPU5
200
250
o
Temperature ( C) LCPU10
Figure 5. Differential scanning calorimetry (DSC) curves: LCPU15LCPU, LCPU5, LCPU10, LCPU15, and LCPU20. LCPU20
First, the single glass transition identified from Figure 5 illustrated that the monomers were placed randomly along the main chain without phase separation [23]. All phase transition temperatures of the films are listed in Table 1. The glass transition temperature (Tg) of LCPU was observed at about 40.8 °C. The Tg values of the GO/LCPU composites were slightly higher than those 0 50 100 150 200 250 of the LCPU. Among all samples, LCPU 20 exhibited the highest Tg of 42.8 °C. The increasing Tg of o
Temperature ( C )
Figure 5. Differential scanning calorimetry (DSC) curves: LCPU, LCPU5, LCPU10, LCPU15, and
Figure 5. Differential scanning calorimetry LCPU20. (DSC) curves: LCPU, LCPU5, LCPU10, LCPU15, and LCPU20. First, the single glass transition identified from Figure 5 illustrated that the monomers were placed randomly along the main chain without phase separation [23]. All phase transition temperatures of the films are listed in Table 1. The glass transition temperature (Tg) of LCPU was observed at about 40.8 °C. The Tg values of the GO/LCPU composites were slightly higher than those of the LCPU. Among all samples, LCPU 20 exhibited the highest Tg of 42.8 °C. The increasing Tg of
Polymers 2016, 8, 236 Polymers 2016, 8, 236
7 of 12 7 of 13
the GO/LCPU composites are attributed to the well-dispersed GO that interacted with the LCPU and hindered the relaxation of the polymer chain. Tabletransition 1. Thermotropic of LCPU and its composites. Second, the melting of theproperties hard domain microcrystals was observed. Neat LCPU showed the Tm of 189.3 °C, which was higher than that of the GO/LCPU composites. In addition, the ˝ Sample T m (˝ C) T i (˝ C) g ( C) Tm of composites decreased as the GO Tcontent increased. Among them, LCPU20 showed the lowest LCPU 40.8 ˘ 0.6 189.3 ˘ 0.2 200.6 ˘ 0.1 improved the thermal Tm of 181.8 °C. It was supposed that the interaction between GO and LCPU LCPU5 41.9 ˘ 0.7 188.0 ˘ 0.2 behavior of the polymer chain due to the good thermal conductivity of GO [24]. Third, liquid LCPU10 42.7 ˘ 0.5 185.7 ˘ 0.3 crystalline mesophase-isotropic transition (Ti) of neat LCPU was observed at about 200.6 °C. LCPU15 42.1 ˘ 0.6 181.9 ˘ 0.2 Meanwhile, the GO/LCPU composites42.8 did˘not Ti under because of the effect of LCPU20 0.5 show181.8 ˘ 0.3 test conditions GO on the crystallinity of the LCPU matrix. Second, the melting transition of the hard domain microcrystals was observed. Neat LCPU Table 1. Thermotropic properties of LCPU and its composites. showed the Tm of 189.3 ˝ C, which was higher than that of the GO/LCPU composites. In addition, Sample g (°C) m (°C) Ti (°C) them, LCPU20 showed the the Tm of composites decreased as the T GO contentTincreased. Among ˝ lowest Tm of 181.8 C. It wasLCPU supposed that the interaction GO and LCPU improved the 40.8 ± 0.6 189.3 ± 0.2 between 200.6 ± 0.1 thermal behavior of the polymer due to the good thermal conductivity of GO [24]. Third, LCPU5chain 41.9 ± 0.7 188.0 ± 0.2 liquid crystalline mesophase-isotropic transition LCPU10 42.7 ± 0.5 (T 185.7 0.3 LCPU -was observed at about 200.6 ˝ C. i ) of ±neat LCPU15 42.1 ± 0.6show 181.9 ± 0.2 test conditions Meanwhile, the GO/LCPU composites did not Ti under because of the effect of 42.8 ± 0.5 181.8 ± 0.3 GO on the crystallinity of theLCPU20 LCPU matrix. 3.6. 3.6.POM POM The of of LCPU showed a single enantiotropic liquidliquid crystalline phase phase from room ThePOM POMobservation observation LCPU showed a single enantiotropic crystalline from temperature up to their pointspoints (Figure 6a). The disappeared whenwhen LCPULCPU was room temperature up toclearing their clearing (Figure 6a).birefringence The birefringence disappeared ˝ C. Moreover, the texture appeared again when the sample was cooled down to 230 ˝ C. heated to 201 was heated to 201 °C. Moreover, the texture appeared again when the sample was cooled down to However, the POMthe images the LCPU5 film did film not show any texture thewhen sample 230 °C. However, POMof images of thecomposite LCPU5 composite did not show anywhen texture the ˝ was heated 25 to 25025C. the image black to completely under POM at POM 201 ˝ C sample wasfrom heated from toFurther, 250 °C. Further, theturned imagetoturned black completely under at without any birefringence (Figure 6b). A similar texture with that of LCPU5 appeared for samples 201 °C without any birefringence (Figure 6b). A similar texture with that of LCPU5 appeared for LCPU10 LCPU15 shown). is interesting the LCPU20 showed a texture thata samples and LCPU10 and(images LCPU15not (images notIt shown). It is that interesting that the LCPU20 showed was different withdifferent that of LCPU. Moreover, of the GO film wasGO observed, which was texture that was with that of LCPU.birefringence Moreover, birefringence of the film was observed, quite different from LCPU. We deduced that different birefringences influenced each other, and the which was quite different from LCPU. We deduced that different birefringences influenced each composition of the composite of was factor. The mechanism of the component and other, and the composition thea key composite wasinteraction a key factor. The interaction mechanism of the the birefringence in the composite needs further investigation. component and the birefringence in the composite needs further investigation.
Figure 6. Representative polarizing optical microscope (POM) images of the texture of LCPU at Figure 6. Representative polarizing optical microscope (POM) images of the texture of LCPU at 115 ˝ C 115 °C (a); LCPU5 at 145 °C (b); LCPU20 at 250 °C (c); and GO at 200 °C (d) (Magnification: 200×). (a); LCPU5 at 145 ˝ C (b); LCPU20 at 250 ˝ C (c); and GO at 200 ˝ C (d) (Magnification: 200ˆ).
3.7. SEM 3.7. SEM Figure 7 showed the SEM morphology obtained from the fracture surface of the LCPU and Figure 7 showed the SEM morphology obtained from the fracture surface of the LCPU and LCPU5. LCPU5. The neat LCPU showed a smooth fracture surface, while the GO/LCPU composite film The neat LCPU showed a smooth fracture surface, while the GO/LCPU composite film appeared to appeared to have a rough surface due to the interaction between GO and the LCPU matrix, which
Polymers 2016, 8, 236
8 of 13
Polymers 2016, 8, 236
8 of 12
have a rough surface due to the interaction between GO and the LCPU matrix, which would benefit the stiffness of thethe GO/LCPU Quaresmin and Nadiv [25,26]and suggested that the enforcement would benefit stiffness composite. of the GO/LCPU composite. Quaresmin Nadiv [25,26] suggested that of the mechanical property in the nanofiller-polymer composite was attributed to the toughening the enforcement of the mechanical property in the nanofiller-polymer composite was attributed to mechanism of graphene by a crack bifurcation-deflection mechanism. The carbon nanotubeThe composites the toughening mechanism of graphene by a crack bifurcation-deflection mechanism. carbon had a rough fracture surface because that carbon nanotube was departing from the polymer We nanotube composites had a rough fracture surface because that carbon nanotube wasmatrix. departing deduced for our GO/LCPU composite, between GO andthe LCPU was responsible from the that, polymer matrix. We deduced that,the for interaction our GO/LCPU composite, interaction between for the rough fracture surface. Moreover, the interaction above enhanced the mechanical property of GO and LCPU was responsible for the rough fracture surface. Moreover, the interaction above the GO/LCPU composite property films. enhanced the mechanical of the GO/LCPU composite films.
Figure 7. Field emission scanning electron microscopy (FESEM) images of LCPU (a,b) and LCPU5 Figure 7. Field emission scanning electron microscopy (FESEM) images of LCPU (a,b) and LCPU5 (c,d). (c,d).
3.8. Mechanical Properties 3.8. Mechanical Properties In the GO-reinforced polyurethane composites, their mechanical properties were significantly In the GO-reinforced polyurethane composites, their mechanical properties were significantly influenced by the GO dispersion status and interfacial interaction between GO and the matrix [27]. influenced by the GO dispersion status and interfacial interaction between GO and the matrix [27]. The mechanical properties of the LCPU and GO/LCPU composite films were evaluated using tensile The mechanical properties of the LCPU and GO/LCPU composite films were evaluated using tensile testing as a function of the GO content. The representative stress–strain curves of LCPU and GO/LCPU testing as a function of the GO content. The representative stress–strain curves of LCPU and composite films are shown in Figure 8. The mechanical property in terms of tensile strength, modulus, GO/LCPU composite films are shown in Figure 8. The mechanical property in terms of tensile and elongation at break of the LCPU-based film were markedly enhanced by the incorporation strength, modulus, and elongation at break of the LCPU-based film were markedly enhanced by the of GO (Figure 9). The most effective enhancement was obtained for the LCPU20 composite film. incorporation of GO (Figure 9). The most effective enhancement was obtained for the LCPU20 Its tensile strength, elongation at break, and elastic modulus were 3.618 MPa, 214.32%, and 26 MPa, composite film. Its tensile strength, elongation at break, and elastic modulus were 3.618 MPa, corresponding to increases by 77.5%, 12.4%, and 174.8% compared with those of neat LCPU. The 214.32%, and 26 MPa, corresponding to increases by 77.5%, 12.4%, and 174.8% compared with those remarkable improvements of the mechanical properties in the GO/LCPU composites were due to of neat LCPU. The remarkable improvements of the mechanical properties in the GO/LCPU the good dispersion of GO in the LCPU matrix and the interfacial interactions between GO and composites were due to the good dispersion of GO in the LCPU matrix and the interfacial LCPU. Some works have demonstrated that the mechanical property of PU improved due to the interactions between GO and LCPU. Some works have demonstrated that the mechanical property good dispersion and bonding of graphene sheets with the PU matrix [28,29]. In our case, the strong of PU improved due to the good dispersion and bonding of graphene sheets with the PU matrix interaction of PU and GO is attributed to the carboxyl group in the main chain of LCPU that was able [28,29]. In our case, the strong interaction of PU and GO is attributed to the carboxyl group in the to form hydrogen bonding with GO, which leads to the effective load deliver from the LCPU to GO main chain of LCPU that was able to form hydrogen bonding with GO, which leads to the effective under external stress [30]. Furthermore, the enhancement of the tensile strength and elongation at load deliver from the LCPU to GO under external stress [30]. Furthermore, the enhancement of the break was able to enlarge the area under the curve, which was crucial in shape memory because the tensile strength and elongation at break was able to enlarge the area under the curve, which was area was the strain energy that is stored when stretching, and it stimulated strain recovery upon the crucial in shape memory because the area was the strain energy that is stored when stretching, and it release of stress in its rubbery state [31]. As shown in Figure 8, the area under the curve of LCPU20 stimulated strain recovery upon the release of stress in its rubbery state [31]. As shown in Figure 8, was much higher than that of pristine LCPU, which means that LCPU20 had a much greater force for the area under the curve of LCPU20 was much higher than that of pristine LCPU, which means that shape recovery in its rubbery state. LCPU20 had a much greater force for shape recovery in its rubbery state.
Polymers 2016, 8, 236 Polymers2016, 2016,8,8,236 236 Polymers
9 of 13 12 99ofof12
Figure8.8.8.Stress–strain Stress–strain curves the pristine pristine LCPU and its its composites composites room temperature. temperature. Stress–strain curves ofofpristine the atat room Figure curves of the LCPULCPU and itsand composites at room temperature. Stretching Stretching rate was set at 50 mm/min. Stretching was set at 50 mm/min. rate was setrate at 50 mm/min.
Figure9. Tensilestrength strength(A); (A);elongation elongationat break(B); (B);and andelastic elasticmodulus modulus(C); (C);LCPU LCPU(a); (a);LCPU5 LCPU5(b); (b); Figure 9.9.Tensile strength (A); elongation atatbreak break (B); and elastic Figure Tensile modulus (C); LCPU (a); LCPU5 (b); LCPU10 (c); LCPU15 (d); LCPU20 (e). LCPU10 (c); LCPU15 (d); LCPU20 (e). LCPU10 (c); LCPU15 (d); LCPU20 (e).
3.9.Shape ShapeMemory MemoryProperty Property 3.9. 3.9. Shape Memory Property Theshape shapememory memoryeffect effectof ofthe theLCPU LCPUand andGO/LCPU GO/LCPUcomposites compositeswas wasinvestigated. investigated.Rectangular Rectangular The shape memory effect of the LCPU and GO/LCPU The composites was investigated. Rectangular specimens were deformed via folding at 90 °C for a few minutes, followed by rapid quenching in specimens were were deformed deformed via via folding folding at at 90 90 ˝°C for aa few few minutes, minutes, followed followed by by rapid rapid quenching quenching in in specimens C for coldwater. water.No Noapparent apparentrecovery recoverywas wasseen seenafter afterthe thedeformed deformedsheet sheetwas waskept keptin inair airfor for 2h.h.Then, Then,the the cold cold water. No apparent recovery was seen after the deformed sheet was kept in air for 22 h. Then, the sample was put into 90 °C water and the deformed SMP sheet started to return to its original shape. sample was was put put into into 90 90 ˝°C sample C water water and and the the deformed deformed SMP SMP sheet sheet started started to to return return to to its its original original shape. shape. Figure10 10showed showedthe thephotos photosof ofthe theshape shapememory memoryeffect effectof ofthe theLCPU LCPUfilm. film.ItItcould couldbe beseen seenthat thatthe the Figure Figure 10 showed the photos of the shape memory effect of the LCPU film. It could be seen that the foldedSMP SMPstarted startedtotorecover recoverits itsoriginal originalshape shapeatat90 90°C. °C.AAseries seriesof ofGO/LCPU GO/LCPUcomposite compositefilms filmswere were folded testedfor fortheir theirshape shapememory memoryeffect. effect.The Theshape shapefixity fixityand andshape shaperecovery recoveryratio ratiofor forfour fourcycles cyclesof ofthe the tested
1 2 3 4 Polymers 2016, 8, 236
98 98 97 98
99 99 98 97
96 95 95 96
100 99 96 96
95 95 95 94
99 98 97 97
92 93 93 93
99 98 98 98
92 93 93 93
100 99 99 98 10 of 13
Table 3. Average shape recovery rate of all the samples.
Cycles LCPU (°/s) LCPU5 (°/s) LCPU10 (°/s) LCPU15 (°/s) LCPU20 (°/s) ˝ folded SMP started to recover its original GO/LCPU composite films were 1 2.6 5.6 shape at 906.3C. A series of8.6 9.2 tested for their shape memory effect. The shape fixity and shape recovery ratio for four cycles of the 2 2.6 4.5 5.9 8.1 8.9 LCPU and GO/LPU composite films 4.9 were listed in Table the shape 3 2.4 5.5 2. Table 3 showed 6.8 7.8recovery rate of all the samples. 4 2.3 4.6 5.3 6.0 7.1
Figure 10. Recovery photos at different times of LCPU at first circle. Figure 10. Recovery photos at different times of LCPU at first circle.
4. Conclusions
Table 2. Shape fixity and shape recovery ratio of LCPU and GO/LCPU nanocomposites.
A novel structure of shape memory polymer (SMP) with main-chain liquid crystalline LCPU LCPU5 LCPU10 LCPU15 LCPU20 polyurethane Cycles (LCPU) that contains a large polar group was synthesized. A graphene oxide (GO)/LCPU composite film the casting method. mechanical Rf Rr was fabricated Rf Rusing Rf solution Rr Rf Rr RThe Rr r f properties of the composite in terms of tensile strength, Young’s modulus, and the elongation 1 98 99 96 100 95 99 92 99 92 100 improved2 due to98the interaction between the GO 95and the Furthermore, the good 99 95 99 98 PU matrix. 93 98 93 99 3 4
97 98
98 97
95 96
96 96
95 94
97 97
93 93
98 98
93 93
99 98
Table 3. Average shape recovery rate of all the samples. Cycles
LCPU (˝ /s)
LCPU5 (˝ /s)
LCPU10 (˝ /s)
LCPU15 (˝ /s)
LCPU20 (˝ /s)
1 2 3 4
2.6 2.6 2.4 2.3
5.6 4.5 4.9 4.6
6.3 5.9 5.5 5.3
8.6 8.1 6.8 6.0
9.2 8.9 7.8 7.1
As shown in Table 2, the shape fixity ratio Rf of composite samples decreased as the GO content increased; the value dropped from 98% of LCPU to 92% of LCPU20 in the first cycle. Nevertheless, all samples maintained their Rf values in the following three cycles. The shape recovery ratios (Rr ) of the composite samples were similar. The Rr values of neat LCPU and LCPU20 were similar in the first cycle. All the Rr values slightly decreased as cycle number increased. Shanmugharaj et al. [32] reported that the recovery ratio dropped in cycles for carbon nanotube–PU nanocomposites because of the formation of frozen-in crystals due to an increase in the orientation of molecular segments in the direction of external force on repeated cycling. Furthermore, the shape recovery rate of samples markedly increased with the GO loading increase, as shown in Table 3. The shape memory behavior was the result of a phase transition of polymer, which was caused by heat change due to the thermal conductivity. GO had a high thermal conductivity, which is attributed to the high-speed shape recovery response of the GO/LCPU composite film [33].
Polymers 2016, 8, 236
11 of 13
4. Conclusions A novel structure of shape memory polymer (SMP) with main-chain liquid crystalline polyurethane (LCPU) that contains a large polar group was synthesized. A graphene oxide (GO)/LCPU composite film was fabricated using the solution casting method. The mechanical properties of the composite in terms of tensile strength, Young’s modulus, and the elongation improved due to the interaction between the GO and the PU matrix. Furthermore, the good thermoconductivity of GO contributed to the fast shape memory response speed of the GO/LCPU composite. Acknowledgments: This work was supported by the Natural Science Foundation of China (NSFC, Nos. 51063009, 21271031, 51203012), the Beijing Natural Science Foundation of China (Nos. 2132009, 2122015), and the project about the promotion of innovation in Beijing universities funded by Beijing Municipal commission of education of China (TJSHG201510017024). Author Contributions: Yueting Li and Huiqin Lian conceived and designed the experiments; Yueting Li performed the experiments; Yueting Li, Wei Chang, and Yanou Hu analyzed the data; Xiuguo Cui and Yang Liu contributed reagents/materials/analysis tools; Yueting Li wrote the paper. Conflicts of Interest: The authors declare no conflict of interest.
References 1.
2. 3. 4. 5.
6. 7.
8. 9. 10. 11. 12. 13.
14.
Warwar Damouny, C.; Silverstein, M.S. Hydrogel-filled, semi-crystalline, nanoparticle-crosslinked, porous polymers from emulsion templating: Structure, properties, and shape memory. Polymer 2016, 82, 262–273. [CrossRef] Liu, Y.; Huang, J.; Su, X.; Han, M. Shape memory polybenzoxazines based on polyetheramine. React. Funct. Polym. 2016, 102, 62–69. [CrossRef] Kim, J.T.; Kim, B.K.; Kim, E.Y.; Park, H.C.; Jeong, H.M. Synthesis and shape memory performance of polyurethane/graphene nanocomposites. React. Funct. Polym. 2014, 74, 16–21. [CrossRef] Arnebold, A.; Hartwig, A. Fast switchable, epoxy based shape-memory polymers with high strength and toughness. Polymer 2016, 83, 40–49. [CrossRef] Chevigny, C.; Foucat, L.; Rolland-Sabaté, A.; Buléon, A.; Lourdin, D. Shape-memory effect in amorphous potato starch: The influence of local orders and paracrystallinity. Carbohydr. Polym. 2016, 146, 411–419. [CrossRef] [PubMed] Zhao, Q.; Qi, H.J.; Xie, T. Recent progress in shape memory polymer: New behavior, enabling materials, and mechanistic understanding. Prog. Polym. Sci. 2015, 49–50, 79–120. [CrossRef] Gao, W.; Xing, L.; Zhang, Q.; Chen, K.; Liu, P.; Chen, L.; Yang, N.; Zhang, X.; Wang, K.; Wei, Y. Nanocomposite hydrogel incorporated with polymerizable liquid crystal surfactant: Shape transition from layered to honeycomb pore structure and thermo/swelling behavior. React. Funct. Polym. 2016, 102, 53–61. [CrossRef] Burke, K.A.; Rousseau, I.A.; Mather, P.T. Reversible actuation in main-chain liquid crystalline elastomers with varying crosslink densities. Polymer 2014, 55, 5897–5907. [CrossRef] Hiraoka, K.; Tagawa, N.; Baba, K. Shape-memory effect controlled by the crosslinking topology in uniaxially-deformed smectic C* elastomers. Macromol. Chem. Phys. 2008, 209, 298–307. [CrossRef] Shayan, S.; Joselito, M.R.; Peter, C.I.; Gordon, G.W. A facile approach to spinning multifunctional conductive elastomer fibres with nanocarbon fillers. Smart Mater. Struct. 2016, 25, 035015. Khan, U.; Young, K.; O’Neill, A.; Coleman, J.N. High strength composite fibres from polyester filled with nanotubes and graphene. J. Mater. Chem. 2012, 22, 12907–12914. [CrossRef] Kang, S.-H.; Fang, T.-H.; Hong, Z.-H. Electrical and mechanical properties of graphene oxide on flexible substrate. J. Phys. Chem. Solids 2013, 74, 1783–1793. [CrossRef] Seyedin, M.Z.; Razal, J.M.; Innis, P.C.; Jalili, R.; Wallace, G.G. Achieving outstanding mechanical performance in reinforced elastomeric composite fibers using large sheets of graphene oxide. Adv. Funct. Mater. 2015, 25, 94–104. [CrossRef] Seyedin, S.; Razal, J.M.; Innis, P.C.; Jalili, R.; Wallace, G.G. Compositional effects of large graphene oxide sheets on the spinnability and properties of polyurethane composite fibers. Adv. Mater. Interfaces 2016, 3. [CrossRef]
Polymers 2016, 8, 236
15.
16.
17.
18.
19.
20.
21.
22.
23. 24. 25. 26.
27.
28.
29.
30.
31.
12 of 13
Pant, H.R.; Pokharel, P.; Joshi, M.K.; Adhikari, S.; Kim, H.J.; Park, C.H.; Kim, C.S. Processing and characterization of electrospun graphene oxide/polyurethane composite nanofibers for stent coating. Chem. Eng. J. 2015, 270, 336–342. [CrossRef] González, Z.; Botas, C.; Álvarez, P.; Roldán, S.; Blanco, C.; Santamaría, R.; Granda, M.; Menéndez, R. Thermally reduced graphite oxide as positive electrode in Vanadium Redox Flow Batteries. Carbon 2012, 50, 828–834. [CrossRef] Kim, J.; Jeon, J.H.; Kim, H.J.; Lim, H. Durable and water-floatable ionic polymer actuator with hydrophobic and asymmetrically laser-scribed reduced graphene oxide paper electrodes. ACS Nano 2014, 8, 2986–2997. [CrossRef] [PubMed] Barrioni, B.R.; de Carvalho, S.M.; Oréfice, R.L.; de Oliveira, A.A.R.; Pereira, M.D.M. Synthesis and characterization of biodegradable polyurethane films based on HDI with hydrolyzable crosslinked bonds and a homogeneous structure for biomedical applications. Mater. Sci. Eng. C 2015, 52, 22–30. [CrossRef] [PubMed] Caki´c, S.M.; Risti´c, I.S.; Marinovi´c-Cincovi´c, M.; Špírková, M. The effects of the structure and molecular weight of the macrodiol on the properties polyurethane anionic adhesives. Int. J. Adhes. Adhes. 2015, 41, 132–139. [CrossRef] Li, X.; Deng, H.; Li, Z.; Xiu, H.; Qi, X.; Zhang, Q.; Wang, K.; Chen, F.; Fu, Q. Graphene/thermoplastic polyurethane nanocomposites: Surface modification of graphene through oxidation, polyvinyl pyrrolidone coating and reduction. Compos. Part A 2015, 68, 264–275. [CrossRef] Han, W.; Tu, M.; Zeng, R.; Zhao, J.; Zhou, C. Preparation, characterization and cytocompatibility of polyurethane/cellulose based liquid crystal composite membranes. Carbohydr. Polym. 2012, 90, 1353–1361. [CrossRef] [PubMed] Chen, S.; Shu, X.; Xie, H.L.; Zhang, H.L. Synthesis and liquid crystalline behavior of 2,5-disubstituted styrene-based random copolymers: Effect of difference in length of the rigid core on the mesomorphic behavior of mesogen-jacketed liquid crystalline polymers. Polymer 2013, 54, 3556–3565. [CrossRef] Pokharel, P.; Lee, D.S. High performance polyurethane nanocomposite films prepared from a masterbatch of graphene oxide in polyether polyol. Chem. Eng. J. 2014, 253, 356–365. [CrossRef] Potts, J.R.; Dreyer, D.R.; Bielawski, C.W.; Ruoff, R.S. Graphene-based polymer nanocomposites. Polymer 2011, 52, 5–25. [CrossRef] Quaresimin, M.; Schulte, K.; Zappalorto, M.; Chandrasekaran, S. Toughening mechanisms in polymer nanocomposites: From experiments to modelling. Compos. Sci. Technol. 2016, 123, 187–204. [CrossRef] Nadiv, R.; Shtein, M.; Buzaglo, M.; Peretz-Damari, S.; Kovalchuk, A.; Wang, T.; Tour, J.M.; Regev, O. Graphene nanoribbon–polymer composites: The critical role of edge functionalization. Carbon 2016, 99, 444–450. [CrossRef] Bian, J.; Lin, H.L.; He, F.X.; Wei, X.W.; Chang, I.T.; Sancaktar, E. Fabrication of microwave exfoliated graphite oxide reinforced thermoplastic polyurethane nanocomposites: Effects of filler on morphology, mechanical, thermal and conductive properties. Compos. Part A 2013, 47, 72–82. [CrossRef] Ramezanzadeh, B.; Ghasemi, E.; Mahdavian, M.; Changizi, E.; Mohamadzadeh Moghadam, M.H. Characterization of covalently-grafted polyisocyanate chains onto graphene oxide for polyurethane composites with improved mechanical properties. Chem. Eng. J. 2015, 281, 869–883. [CrossRef] Kalaitzidou, K.; Fukushima, H.; Askeland, P.; Drzal, L.T. The nucleating effect of exfoliated graphite nanoplatelets and their influence on the crystal structure and electrical conductivity of polypropylene composites. J. Mater. Sci. 2008, 43, 2895–2907. [CrossRef] Jing, Q.; Liu, W.; Pan, Y.; Silberschmidt, V.V.; Li, L.; Dong, Z. Chemical functionalization of graphene oxide for improving mechanical and thermal properties of polyurethane composites. Mater. Des. 2015, 85, 808–814. [CrossRef] Gu, S.; Yan, B.; Liu, L.; Ren, J. Carbon nanotube–polyurethane shape memory nanocomposites with low trigger temperature. Eur. Polym. J. 2013, 49, 3867–3877. [CrossRef]
Polymers 2016, 8, 236
32.
33.
13 of 13
Raja, M.; Ryu, S.H.; Shanmugharaj, A.M. Influence of surface modified multiwalled carbon nanotubes on the mechanical and electroactive shape memory properties of polyurethane (PU)/poly(vinylidene diflouride) (PVDF) composites. Colloids Surf. A 2014, 450, 59–66. [CrossRef] Lian, H.; Li, S.; Liu, K.; Xu, L.; Wang, K.; Guo, W. Study on modified graphene /butyl rubber nanocomposites—Part I: Preparation and Characterization. Polym. Eng. Sci. 2011, 51, 2254–2260. [CrossRef] © 2016 by the authors; licensee MDPI, Basel, Switzerland. This article is an open access article distributed under the terms and conditions of the Creative Commons Attribution (CC-BY) license (http://creativecommons.org/licenses/by/4.0/).