Apr 29, 2005 - Modern Information Retrieval. Ad- dison Wesley, 1999. ... [11] G.N. Lance and W.T. Williams. A general theory of classificatory sorting strategies ...
Enhancement of Textual Images Classification using Segmented Visual Contents for Image Search Engine Sabrina Tollari, Herv´e Glotin, Jacques Le Maitre Laboratoire SIS - Equipe informatique, Universit´e du Sud Toulon-Var, Bˆatiment R, BP 20132, F-83957 LA GARDE cedex, France {tollari,glotin,lemaitre}@univ-tln.fr April 29, 2005 Abstract This paper deals with the use of the dependencies between the textual indexation of an image (a set of keywords) and its visual indexation (colour and shape features). Experiments are realized on a corpus of photographs of a press agency (EDITING) and on another corpus of animals and landscape photographs (COREL). Both are manually indexed by keywords. Keywords of the news photos are extracted from a hierarchically structured thesaurus. Keywords of Corel corpus are semantically linked using WordNet database. A semantic clustering of the photos is constructed from their textual indexation. We use two different visual segmentation schemes. One is based on areas of interest, the other one on blobs of homogenous colour. Both segmentation schemes are used to evaluate the performance of a content-based image retrieval system combining textual and visual descriptions. Results of visuo-textual classifications show an improvement of 50% against classification using only textual information. Finally, we show how to apply this system in order to enhance a web image search engine. To this purpose, we illustrate a method allowing selecting only accurate images resulting from a textual query.
1
Introduction
Within the research field of multimodal image indexing, visual modality is dominant, and despite its rich semantics, the text content is rarely combined with the visual one. An image search engine would benefit from such visuo-textual fusion. We propose in this article a low cost system which is giving some partial solution to that task. Existing image engines allow users to search for images via a keywords interface or via query by image example [7, 8, 4, 17, 12, 16]. Most of them are based on visual similarity measures between an image reference and a test one. Nevertheless, most of CBIR engines allow the user to form a query only by keywords. In the case of web search engine the image index is built with keywords extracted heuristically from HTML documents 1
containing each image, and/or from the URL image. Then asking a too precise query giving many keywords, the user may narrow the scope of accurate images. Thus image indexing should incorporate keyword and visual features. Unfortunately it is difficult to include visual cues within a WWW navigator framework. Therefore in order to refine the query, one can use a second filter stage, by adding visual cues which have been tied with a given textual thesaurus. In this paper we demonstrate such a system that combines textual and visual statistics in a single stochastic fusion for content-based image retrieval (CBIR). By truly unifying textual and visual statistics, one would expect to get better results rather than using them separately. In our approach, textual statistics are captured in vector form [19] . We first cluster images using an Ascendant Hierarchical Classification. Visual statistics are then drawn inside these classes, based on colour, shape or orientation histograms. The last stage consists in a multimodal fusion approach. Search performance experiments are reported for two corpuses, for a total of 1200 images. The first corpus is collected by Editing, a press agency, which was involved in the french RNTL Muse Project [5]. All pictures are manually indexed by keywords from a hierarchical thesaurus and saved in an XML file following the MPEG-7 format [13]. The second corpus is from a pre-processed version of the COREL database [3, 15]. Our visuo-textual fusion model enhances by 50% a text query. Moreover, we apply our model to select most accurate images found on a web search engine with a textual query.
2
Semantic clustering
First, in order to map textual and visual information, we need to get a certain number of semantic classes containing few image samples. In this purpose textual statistics are captured in vector form, and we run the Ascendant Hierarchical Classification (AHC) algorithm [11]. In the AHC algorithm, each class is initialised with exactly one element (one image), then two classes are merged if their distance is the smallest one. We stop to merge classes when all the distances between classes are higher than a certain threshold. Let D = {d1 , d2 , . . . , dm } a document set and T = {t1 , t2 , . . . , tn } a keyword set, the vectorial model [18, 20, 19, 1] describes the document di as T (di ) = (ω1,i , ω2,i , . . . , ωj,i , . . . , ωn,i ) where ωj,i is the term-weighting (the best known is tf-idf schemes). In this study, for each keyword of the thesaurus, a vector element is initialized to 1 if the keyword belongs to the image, to 0 if not, thus ωj,i ∈ {0, 1}. The hierarchical structure (generated by an order relation ≺) of the thesaurus implies that if an image is indexed by tj and tj ≺ tk then it is also indexed by tk . Therefore, using the thesaurus, one can extend the vector T (di ) [14] so that ∀j, k ∈ [1, n], ωk,i = 1 if ωj,i = 1 and tj ≺ tk , else ωk,i = 0. In this study, we use the cosine distance. Finally, each semantic class is randomly split in two equal partitions: one is the reference set REF , the other is the test set T EST . As described later on, REF is providing example documents of each class used to estimate the class of any image of T EST set, either using textual, visual or textuo-visual information. Then, hidden original semantic class of the T EST images gives the classification error rate.
2
3
Classification methods
The class estimation of any document of the T EST set is based on the Kullback-Leibler1 distance L between its normalized2 features and the corresponding normalized features of example documents of the REF set.
3.1
Text-only classification
Each class Ck of REF is represented by the textual vector T (Ck ) averaging the textual vectors of images of class Ck . Then, the text-only class of a document d of T EST is estimated by: C T (d) = argminall Ck L(T (d), T (Ck )). (1)
3.2
Visual-only classification: early fusion
An image is defined by a set of segments S. Let P be the set of their physical characteristics (colour, area, etc), then Vp (sd ) is the visual features set with p ∈ P , for the segment s of the document d. As we have for a given document di a set Si of visual segment features, the comparison of two documents d1 and d2 generates card(S1 ) ∗ card(S2 ) distances. If one considers only the q = min(card(S1 ), card(S2 )) first segments, q 2 distances are required. Let LVp (s1i , s2j ) be the Kullback-Leibler distance for the visual features Vp between the segment s1i of image d1 of TEST and the segment s2j of image d2 of REF. In order to reduce the complexity of the system, we define the visual distance between an image d1 of T EST and an image d2 of REF as the average of the N smallest3 visual distances (N ∈ [1, q 2 ]). Therefore, we obtain for each image d the distance: γVp (d1 , d2 ) = moyminN ({LVp (s1i , s2j ); ∀s1i , s2j ∈ [1, q]}).
(2)
Now, one can estimate the global distance between a test image d of T EST and all images contained in a class Ck of REF , averaging the I first minimal distances. Then we have: δVp (d, Ck ) = moyminI ({γVp (d, dk ); ∀dk ∈ Ck })
(3)
where dk is a document of the class Ck and I ∈ [1, card(Ck )]. Finally, the visual-only class of d is estimated by: (4) C Vp (d) = argminall Ck δVp (d, Ck ). This method allows to reject too large distances which would penalize the system, and keeps the smallest distances which increase the probability of being in the good class. 1
The relative entropy of Kullback-Leibler between two distributions a and b on an alphabet χ is: P divK(a, b) = y∈χ a(y) log a(y) b(y) . Then the Kullback-Leibler distance is L(a, b) = divK(a, b) + divK(b, a). 2 Features normalisation estimates the distribution of the probability that a feature has the highest possible value. Another metric would be convenient as for as it takes in account feature distribution. 3 To express the average of the Z smallest values, we define the function: moyminZ : {α1 , α2 , . . . , αM } → (αmin1 + αmin2 + . . . + αminZ )/Z where Z ≤ M and αminp is the pth smallest element of {α1 , α2 , . . . , αM }.
3
3.3
3.3.1
Combining visual and textual classifications: early and late fusion Early visuo-textual fusion
One can extend the previous process to larger features vectors resulting from the early fusion of textual and visual features [23]. For each image, we define a new vector T Vp (si ) which is the concatenation of its textual vector and its visual vector Vp , for its segment si . Let LT Vp (s1i , s2j ) be the distance between the vectors T Vp of the segment s1i of image d1 of TEST and the segment s2j of image d2 of REF. Then, as in equation (2), we have: γT Vp (d1 , d2 ) = moyminN ({LT Vp (s1i , s2j ); ∀s1i , s2j ∈ [1, q]}).
(5)
Finally, the distance δT Vp (d, Ck ) and C T Vp (d) are estimated as in equation (3) and (4).
3.3.2
Late visuo-textual fusion
A second fusion scheme consists in merging the textual and visual classification results. This late fusion allows more freedom for adaptive weighting in a stochastic framework [10] as follows. For any image d of T EST we calculate the textual and visual classifications C T (d) and C Vp (d). Thus, for each image d the probability to belong to Ck is for the textual modality: L(T (d), T (Ck )) P (0 d ∈ Ck0 |T ) = 1 − P . (6) all Ck L(T (d), T (Ck ))
For the visual modality, we have:
P (0 d ∈ Ck0 |Vp ) = 1 − P
δVp (d, Ck ) . all Ck δVp (d, Ck )
Finally, the combination of visual and textual posteriors is estimated by: X P (0 d ∈ Ck0 |T ∨ V ) = P (0 d ∈ Ck0 |f ) × ω 0 (f )
(7)
(8)
f ∈(T ∨V )
h
) where ω 0 (f ) = P ω(f ) ω(f )h , ω(f ) = P 1−ER(f and ER(f ) is the classification error f ∈(T ∨V ) 1−ER(f ) f ∈(T ∨V ) rate given by the feature f. The parameter h increases contrast between weights. The final class is given by the maximum a posteriori criterion:
C T ∨V (d) = argmaxall
4
Experimentations
4
Ck ∈REF P (
0
d ∈ Ck0 ).
(9)
Edges
Brightness 1000
20
20
40
40
60
60
80
1
150
80
500
1
Red
150
0
1
Green
4000 3000
32 Blue
6000
3000
4000
2000
2000
1000
2000 1000 0
1
32
0
1
32
0
1
32
Orientation edges 300 200 100 0
pi
pi/6 pi/3 pi/2−p/3−p/6
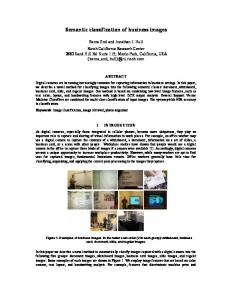
c Figure 1: The five visual features for one image. Photo Editing.
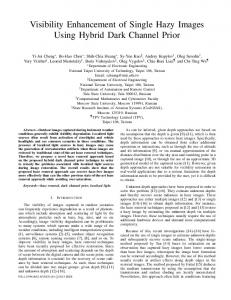
c Figure 2: Selection of the ROI. Photo Editing.
4.1
Corpuses definitions
We made experiments on two corpuses: EDITING and COREL. Both are composed of textual and visual indexation. Each image of these corpuses are segmented into visual segments respectively.
4.1.1
EDITING’s corpus
The first corpus is a database containing 600 images collected by Editing, a press agency, which was involved in the RNTL Muse Project [5]. All pictures are indexed manually by keywords from a thesaurus and saved in an XML file following the MPEG-7 format [13]. The hierarchical Thesaurus is composed of 1200 keywords with an average depth of 3. We chose to use the simplest visual features as possible. Therefore we use colours (red(V1 ), blue(V2 ) and green(V3 )), brightness(V4 ) and direction histograms(V5 )4 (figure 1). In order to deal with image scale variations we extracted the visual features from the original image and from four local regions. The segmentation approach, proposed in [22], performs an unsupervised and fast segmentation based on the Canny edge detection [6]. The local Regions Of Interest (ROI) of four different orders are automatically extracted from the global image as follow. After calculation of the edge matrice of the global image, 4
Details on the direction feature can be found in [22].
5
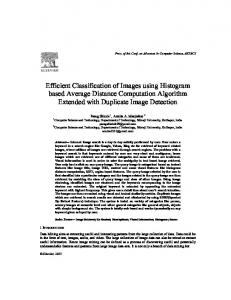
Figure 3: Example of five regions (also called blobs) of a sunset image extracted from [3]. the ROI of first order is extracted from the rectangle window of fixed size which maximises the number of edges. Then the ROI of second order is extracted using the edge matrice where edges corresponding to the first ROI have been removed. Other ROIs of third and fourth orders are processed iteratively. For this experiment we fixed the surface of each ROI to 25% of the surface of the global image. The extraction of the first two ROI is illustrated in figure 2.
4.1.2
COREL’s corpus
The second corpus is a pre-processed COREL database containing 600 labelled images. Since there is no hierarchical thesaurus for this database, legend keyword have been extended using the hypernyms of WORDNET database [9]. This thesaurus is composed of 1500 keywords with an average depth of 6. Data were preprocessed by Computer Vision Group of University of California (Berkeley) and Computing Science Department of University of Arizona as described in [3, 2]. Each image is segmented using normalized cuts [21] (figure 3). This segmentation method tends to produce small or unstable regions. Thus, only the 10 largest regions in each image are selected. For this database, the order of any region is defined as its decreasing size rank. Each region is described by a set of 46 features. Size is represented by the portion of the image covered by the region. Shape is represented by the ratio of the area to the perimeter squared, the moment of inertia (about the center of mass), and the ratio of the region area to that of its convex hull. Colour is represented using the average and standard deviation of (R,G,B) and (L,a,b) over the region. In the case of RGB, the 3 extracted bins are: S=R+G+B, r=R/S, g=G/S, named rgS. Texture and shapes are extracted as in [3]. Authors has chosen these features to be computable for any image region, and be independent of any recognition hypothesis.
4.2
Results of the semantic clustering
For both corpuses, we compute the semantic clustering algorithm described in section 2. We remove from the classification the classes which have less than 8 images. According
6
to the class distribution, we estimate the error rate of the random classifier5 . We finally obtain the classification describe in table 1. Corpus
EDITING COREL
Minimum number images by class 8 12
Maximum number images by class 98 46
Mean number images by class 21.5 24.3
Stdev
Number of classes
Total images number
21.4 10.10
24 23
517 559
Table 1: Results of the clusters for EDITING and COREL corpuses.
4.3
Text-only classification results
Table 2 gives the text classification Error Rate (ER) obtained for EDITING and for COREL corpuses. We notice that, in the case of EDITING, when the vectors are extended
EDITING COREL
Textual with thesaurus 1.17 18.97
Textual without thesaurus 13.72 17.15
Origine of thesaurus manual automatic
Random classifier 91.60 94.80
Table 2: Classification Error Rate in %, with or without thesaurus extension for EDITING and COREL, and for a theoretical error rate of a random classifier. by the thesaurus, the classification is significantly improved. This is due to the high quality of the manual thesaurus. In the case of COREL, when the vectors are extended by WORDNET, the error rate is similar with the thesaurus, maybe because we use all the senses of WORDNET for any COREL keyword, as far as we do not know in what sense a keyword is associated to a COREL image.
4.4
Visual-only classification results
We start by calculating the distance between the segments of equal order. Table 3 shows the results. One notices that, in general, ER on the global images are better, except for the direction where the first order ROI gives better results. Area 1 contains the highest edges density. For the green feature, the good result obtained for ROI 2 is explained by an artifact from the data (one class contains more green than the others). However, areas 1 and 2 have the weakest error rates, which is explained by the fact that they contain most of the visual information (high number of edges or large area). 5
Let Pk be the frequency of the class Ck , the error rate of a random classifier is: ERrand = 1 −
c X
(Pk )2 = 1 −
k=1
c � X k=1
card(Ck ) Pc k=1 card(C)
�2
where c is the number of classes and card(Ck ) is the number of images in the class Ck .
7
Corpus EDITING EDITING EDITING EDITING EDITING COREL
Features Red Green Blue Brightness Direction rgS
LVp (g, g) LVp (1, 1) LVp (2, 2) LVp (3, 3) LVp (4, 4) 81.17 79.21 81.17 82.35 73.33 83.13 78.03 86.66 80.78 78.43 82.35 80.39 83.92 84.70 74.50 80.39 81.17 81.56 83.52 76.40 79.60 81.56 80.00 84.31 85.49 83.57 86.86 84.30 86.86
Table 3: Error Rates (ER in %) for different visual features for segments of equal order. LVp (g, g) refers to the experiment considering only global images.
4.5
Early fusion of visual features
Parameters N , I and q could be optimized on a developpement test set, but they can be roughly estimated from table 4 and 5, and curve in figure 4. Table 4 and 5 give the error N EDITING Red EDITING Green EDITING Blue EDITING Brightness EDITING Direction COREL rgS
1 71.76 76.07 77.64 77.64 83.52 79.92
2 3 4 72.54 72.54 73.72 77.64 77.64 76.86 77.25 79.60 80,00 79.21 77.64 77.64 80.39 80.39 80,00 80.65 80.65 79.56
5 6 76.47 77.64 76.86 76.47 79.60 81.56 79.21 79.21 79.21 78.82 78.46 77.73
Table 4: Influence of the parameter N on the Error Rates (ER in %) (I = 4, q = 5). rates obtained by early fusion while varying the parameters N and I for EDITING and COREL. Table 4 shows that parameter N has little influence on the error rate both on EDITING and COREL for colour features, but is significant for direction features. Table 5 shows that it is better to check if the test image is similar to four images of the same class rather than to only one. I EDITING Blue COREL rgS
1 2 3 4 78.03 77.64 78.03 77.25 85.40 79.92 78.83 77.73
Table 5: Influence of the parameter I on the Error Rates (ER in %) for two visual features. N is fixed according to the best result in table 4
4.6
Textuo-visual fusion: early and late fusion
Early fusion is conducted on COREL as mentioned in section 3.3.1 and gives an error rate of 6.56%. Figure 4 describes the results obtained with late fusion using textual classification without thesaurus6 (E.R. 13.72%) and all visual classifications. We use the best parameters of early fusion. We plot error rates for different h constrast factor defined in equation 8. Naturally, all methods converge to the textual error rate for large h (h > 8). Table 6 summarizes rising of textual classification by the visual classification. 6
One should use a thesaurus for the reference semantic clustering, but during a text process above various search engine, he can’t.
8
24 Text & Visual Text only 22
20
18
ER %
16
14
12
10
8
6
1
1.5
2
2.5
3
3.5
h
Figure 4: Error Rates of the different systems for various h factor: text only and combining of textual with various visual contents (see text for details). Corpus EDITING COREL
Fusion scheme late early
Textual without thesaurus 13.72 18.97
Fusion visuo-textual 6.27 6.56
Relative gain 54.3 65.4
Table 6: Best results of early and late fusions of visuo-textual classification in %. Both early and late fusion enhance by more than 50% the text-only classification.
5
Application to image filtering
We demonstrated in previous sections that visual and textual informations can be efficiently merged in a multimodal search engine. We then show in this section how our system could be applied to filter any set of images found from a textual query. We load 20 images found on “Google” search engine with the textual query “Black Bear Snow”. These terms are present in our reference database. Google is presenting various images, from bears to birds. Like in many other search engines, the accuracy of each image result is given to the user only by the order of each image. Thus, the user has to choose himself which images are not accurate. To give more information to the user, we compute the distance between the visual content of each image and the content of the reference database (COREL). The distances distribution is given in figure 5. We see clearly that the distribution is bi-modal, one mode is centred on 0.03, the other on 0.05. This indicates, that all images of the first mode could be considered as accurate, and the other not. Thus we present to the user the accurate images sorted by increasing distance, from left to right and top to bottom. We see that all images containing a bear are selected.
6
Conclusion
We showed that early and late visuo-textual fusion are significantly improving text-only classification (+54%). Our method must be tested on more data in order to refine the results. Many criteria and parameters remain to be studied to improve visual description, 9
4
3.5
3
nombre images
2.5
2
1.5
1
0.5
0 0.02
0.03
0.04
0.05
0.06
0.07
0.08
0.09
distance
Figure 5: δVp distances distribution for each image found by Google with the textual query: ‘black bear snow’ (see figure 6). This distribution is bimodal, thus, in the filter stage, images with δVp < 0.04 are considered as relevant, other are rejected.
Figure 6: Results of image filtering according to the distances distribution (figure 5). Top: Google results for the textual query: ‘black bear snow’. Bottom: Filtered images extracted from the first cluster of the distances distribution. They are sorted by increasing distance, from left to right and top to bottom. We see that all images containing a bear are kept (the accurate one), the others are rejected.
10
as the influence of the size and the shape of the areas of interest. The description of certain images by local area of interest can be more beneficial for certain types of images than for others. An automatic method determining if an image is of this type or not, would increase the performance of the system. A possible extension to this study would consist on the adaptive size of the local images according to the edge density of the image or an entropic criterion. We presented a simple system to unify textual and visual informations. Our system can be added like a fast visual filter on the result of a request of images on a search engine (such as Google), where textual requests are using a small number of keywords, and can’t be extended by a thesaurus. We could reverse the method by comparing the textual indices to visual classes. This would allow to correct a bad textual indexing using the visual content. For example, if a statistical plot image of the working population was labelled automatically by ‘woman’ and ‘worker’, a comparison with visual classes representing ‘woman’ would highlight the indexation error. Therefore, it could automatically remove the word ‘woman’ from the keyword set of this image.
References [1] Ricardo Baeza-Yates and Berthier Ribeiro-Neto. Modern Information Retrieval. Addison Wesley, 1999. [2] K. Barnard. http://vision.cs.arizona.edu/kobus/research/data/jmlr 2003. [3] K. Barnard, P. Duygulu, N. de Freitas, D. Forsyth, D. Blei, and M. I. Jordan. Matching words and pictures. In Journal of Machine Learning Research, volume 3, pages 1107–1135, 2003. [4] Marinette Bouet and Ali Khenchaf. Traitement de l’information multim´edia : recherche de m´edia image. Ing´enierie des syst`emes d’information (RSTI s´erie ISINIS), 7(5-6):65–90, 2002. [5] E. Bruno, J. Le Maitre, and E. Murisasco. Indexation et interrogation de photos de presse d´ecrites en MPEG-7 et stock´ees dans une base de donn´ees XML. Ing´enierie des syst`emes d’information (RSTI s´erie ISI-NIS), 7(5-6):169–186, 2002. [6] J. Canny. A computational approach to edge detection. IEEE Transactions on Pattern Analysis and Machine Intelligence, PAMI-8(6):679–698, 1986. [7] Marco La Cascia, Sarathendu Sethi, and Stan Sclaroff. Combining textual and visual cues for content-based image retrieval on the world wide web. Technical Report 1998004, 9, 1998. [8] V. Castelli and L. D. Bergman, editors. Image Databases. John Wiley & Sons, 2002. [9] Christiane Fellbaum, editor. WordNet - An Electronic Lexical Database. Bradford books, 1998.
11
[10] H. Glotin. Elaboration et ´etude comparative de syst`emes adaptatifs multi-flux de reconnaissance robuste de la parole : incorporation d’indices de voisement et de localisation. Phd thesis, ICP/Institut National Polytechnique de Grenoble & IDIAP/EPF, Lausanne, 2001. [11] G.N. Lance and W.T. Williams. A general theory of classificatory sorting strategies: I. hierarchical systems. Computer Journal, 9:373–380, 1967. [12] Ying Li, C.C. Jay Kuo, and X. Wan. Introduction to content-based image retrieval overview of key techniques. In V. Castelli and L. D. Bergman, editors, Image Databases, chapter 10, pages 261–284. John Wiley & Sons, 2002. [13] B.S. Manjunath, Philippe Salembier, and Thomas Sikora, editors. Introduction to MPEG-7. John Wiley & Sons, 2002. [14] Jean Martinet, Yves Chiaramella, and Philippe Mulhem. Un mod`ele vectoriel ´etendu de recherche d’informations adapt´e aux images. Actes du XX`eme Congr`es INFORSID, pages 337–348, 4-7 juin 2002. [15] Henning M¨ uller, St´ephane Marchand-Maillet, and Thierry Pun. The truth about corel – evaluation in image retrieval. In The Challenge of Image and Video Retrieval (CIVR2002), 2002. [16] C. Nastar. Indexation d’images par le contenu : un ´etat de l’art. CORESA’97, 1997.
Actes de
[17] W. Niblack. The QBIC project: querying images by content using color, texture and shape. Proceedings SPIE: Storage and Retrieval for Image and Video Database, pages 173–181, 1993. [18] G. Salton. The SMART Retrieval System ; Experiments in Automatic Document Processing. Englenwood Cliffs, Prenctice-Hall, New Jersey, 1971. [19] G. Salton and C. Buckley. Term-weighting approaches in automatic retrieval. Information processing and management, 24(5):513–523, 1988. [20] G. Salton and M.J. Lesk. Computer evaluation of indexing and text-processing. Journal of the ACM, 15(1):8–36, 1968. [21] Janbo Shi and Jittendra Malik. Normalized cuts and image segmentation. IEEE Transactions on Pattern Analysis and machine Intelligence, 22(8):888–905, 2000. [22] S. Tollari, H. Glotin, and J. Le Maitre. Rehaussement de la classification textuelle d’images par leur contenu visuelle. Actes du 14i`eme Congr´es Francophone AFRIFAFIA de Reconnaissance des Formes et Intelligence Artificielle, 2004. [23] Xiang S. Zhou and Thomas S. Huang. Unifying keywords and visual contents in image retrieval. IEEE Multimedia, 2002.
12