series of technology-generated representations of figures from various ... Instructional tool utilization and access effects on spatial visualization skill gains ... grades, and enforcement of experimental design parameters and treatment group ...... APPENDIX A: PURDUE SPATIAL VISUALIZATION TEST â ROTATIONS ........ 137.
ENHANCING SPATIAL VISUALIZATION SKILLS IN FIRST-YEAR ENGINEERING STUDENTS DISSERTATION Presented in Partial Fulfillment of the Requirements for the Degree Doctor of Philosophy in the Graduate School of The Ohio State University By Yosef S. Allam One-of-a-Kind Doctor of Philosophy
The Ohio State University 2009 Dissertation Committee: Clark A. Mount-Campbell, Advisor Patricia A. Brosnan Robert J. Gustafson Douglas T. Owens
Copyright by Yosef S. Allam 2009
ABSTRACT
Spatial visualization skills are a function of genetics and life experiences. An individual’s genetic spatial visualization aptitude can be enhanced through proper instruction and practice. Spatial visualization skills are important to engineers as they help with problem formulation and thus enhance problem-solving ability. They are also vital to an engineer’s ability to create and interpret visual representations of design ideas. This study seeks to investigate the experiential factors affecting spatial visualization skills and methods with which these skills can be enhanced. This study also investigates the correlation between spatial visualization ability and pre-college life experiences, as well as spatial visualization ability and academic performance. Participants were selected from an introductory engineering course. Participants in the treatment and control groups were pre- and post-tested using the Purdue Spatial Visualization Test—Rotations to gauge spatial visualization ability. The treatment consisted of students being given a series of technology-generated representations of figures from various perspectives that may aid in visualization of these objects. Scores between the treatment and control groups were compared and checked for statistical significance. Participants were also given a questionnaire to complete. The answers from the questionnaire were coded for levels of pre-college experience in certain key areas that are hypothesized to aid in the development of spatial visualization skills. These quantitative experience levels were ii
correlated to pre-test results to verify the hypothesis of these life experiences’ significance in spatial visualization ability development. The relationship between student academic performance and spatial visualization ability was also investigated. Instructional tool utilization and access effects on spatial visualization skill gains between pre-tests and post-tests were not significant. This is potentially due to a substitutive rather than additive effect to student experiences through usage of the instructional tool. Developmental experiences with stackable toys such as Legos and building blocks were a significant predictor of initial spatial ability, confirming previous findings. Developmental experiences with home improvement activities significantly affected graded performance in coursework. Initial spatial ability was also a significant predictor of course grades. Course grade and resource web-based applications can be used successfully in the deployment of open access electronic instructional tools. Institutional web applications can also be used to automate and conduct large studies. Access, utilization logging, grades, and enforcement of experimental design parameters and treatment group segregation can be provisioned via online course grade and resource repositories such as Carmen, by Desire-to-Learn, employed in this study. Improvements in data accessibility must be made in course web applications to facilitate more studies conducted in this manner. Improvements in usability, reporting, and analysis are necessary to allow for streamlined study implementation and data dissemination for educational research in courses employing web applications. Improvements to course web applications can allow educational researchers to effectively capitalize on this technology.
iii
DEDICATION
For my family, my mother Magda, my father Serry, and my sister Dina.
iv
ACKNOWLEDGEMENTS It was through the guidance, support, and encouragement of many that the goals of this researcher were realized. Great thanks and appreciation are due to those that follow: Dr. Clark Mount-Campbell, my advisor, for his patience and latitude to allow me to find my own way, as well as his guidance and friendship throughout the years we have known each other. Our conversations over the years spurred many thoughts in new directions. Dr. Patti Brosnan, for her support and encouragement to consider various research methods, as well her openness to allowing me to perform mathematics education course projects with engineering students. These projects formed the initial groundwork for this study. Dr. Bob Gustafson, for allowing and encouraging me to use the First-Year Engineering Program as a laboratory for my research, as well as the many other opportunities which allowed me to gain experience in an environment rich in engineering education innovation. Dr. Doug Owens, for his help from the onset and throughout my journey into educational research. His guidance in the realm of pedagogical theory as well as selection of coursework best suited for my research interests and goals was indispensible.
v
Dr. John Merrill, who made available to me every opportunity in his power to allow me to pursue my passion for engineering education, and for keeping me informed of new developments and opportunities. Dr. David Tomasko, whose energy and passion for both research and engineering education are inspirational. Working with him and seeking his advice over the years has enriched my journey to this goal. All the fine people of The Ohio State University over the years who unfortunately cannot be listed here. The institution and its people have helped me realize my dreams. Finally, I would also like to thank my friends and family who encouraged me along the way and listened. Of particular note are my mother, father, and sister, as well as my friend Dr. Srikant Nekkanty, who empathized and commiserated, and my lifelong friend and confidant, Stephanie, for her help, encouragement, and critical eye in the final stages of this endeavor.
vi
VITA
February 25, 1974………………………….. Born – Bayonne, New Jersey 1997………………………………………... B. S. Industrial and Systems Engineering The Ohio State University 1997 – 1999………………………………... Graduate Teaching Associate Industrial and Systems Engineering The Ohio State University 1999………………………………………... M. S. Industrial and Systems Engineering Specialization: Operations Research The Ohio State University 2002………………………………………... Instructor and Curriculum Developer First-Year Engineering Programs The Ohio State University 2002 – 2008………………………………... Graduate Teaching Associate, Lead Graduate Teaching Associate, Curriculum Developer First-Year Engineering Programs The Ohio State University 2008 – 2009……………………………….. NSF Graduate STEM Fellow in K-12 Education (GK-12) The Ohio State University 2009 – Present……………………………... Instructor First-Year Engineering Programs The Ohio State University
vii
PUBLICATIONS Allam, Y., & Irani, S. A. (1999). Systematic redesign of a manufacturing cell. In S. A. Irani (Ed.), Handbook of Cellular Manufacturing Systems (pp. 661-679). New York: Wiley. Allam, Y., Tomasko, D. L., Trott, B., Schlosser, P., Yang, Y., Wilson, T. M., & Merrill, J. (2008). Lab-on-a-chip design-build project with a nanotechnology component in a freshman engineering course. Chemical Engineering Education, 42 (4), 185192. FIELDS OF STUDY Major Field: One-of-a-Kind Doctor of Philosophy Engineering Education
viii
TABLE OF CONTENTS ABSTRACT ........................................................................................................................ ii DEDICATION ................................................................................................................... iv ACKNOWLEDGEMENTS ................................................................................................ v VITA ................................................................................................................................. vii LIST OF FIGURES ......................................................................................................... xiii LIST OF TABLES ........................................................................................................... xiv CHAPTER 1: CONTEXT, RATIONALE, AND THEORETICAL FRAMEWORK ....... 1 Problem Context ............................................................................................................. 1 Motivating Factors .......................................................................................................... 1 Problem Statement .......................................................................................................... 3 Research Questions ......................................................................................................... 4 Rationale: The Significance of Spatial Visualization Skills in Engineering Education ... 5 Theoretical Framework ................................................................................................... 6 Factors Affecting Spatial Visualization Ability........................................................... 6 Learning Theory and Cognitive Development ............................................................ 6 Piagetian Spatial Development................................................................................. 10 Representation .......................................................................................................... 15 Theoretical Implications ........................................................................................... 19
ix
CHAPTER 2: LITERATURE REVIEW .......................................................................... 22 Historical Perspective.................................................................................................... 23 Significance of Spatial Visualization Skills in Engineering Education ......................... 24 Assessing Visualization Skills ...................................................................................... 25 Factors Affecting Spatial Visualization Ability ............................................................ 27 Alternatives to Promoting Good Visualization Skills .................................................... 30 Enhancing Visualization Skills ..................................................................................... 31 Virtual Three-dimensional Remediation ................................................................... 33 Problem-based Learning .......................................................................................... 38 Implications................................................................................................................... 39 Summary ....................................................................................................................... 40 CHAPTER 3: METHODOLOGY, DATA COLLECTION AND ANALYSIS .............. 41 Participants .................................................................................................................... 42 Instruments .................................................................................................................... 42 Treatment ...................................................................................................................... 46 Procedures ..................................................................................................................... 47 Research Design ............................................................................................................ 51 Sample and Initial Calculations ............................................................................... 51 Underlying Considerations ....................................................................................... 54 Data Collection and Parsing Devices....................................................................... 55 Data Logs .............................................................................................................. 55 Other Data ............................................................................................................ 56 Master Spreadsheet Data and Pre-Analysis Activities ......................................... 57 Hypotheses, Models, and Variables .............................................................................. 57 Tool Access Effects on Spatial Visualization Improvement ...................................... 58 Tool Utilization Effects on Spatial Visualization Improvement................................ 59 Experience Effects on Spatial Visualization Ability Gains ....................................... 60 Experience Effects on Initial Spatial Visualization Ability ....................................... 61 Experience Effects on Grades ................................................................................... 62 Tool Utilization Effects on Grades ........................................................................... 63 Spatial Visualization Pre-test Effects on Grades ...................................................... 64 x
Risks.............................................................................................................................. 65 Internal Validity ............................................................................................................ 66 Data Analysis ................................................................................................................ 66 Tool Effectiveness......................................................................................................... 66 Limitations .................................................................................................................... 67 CHAPTER 4: DATA ANALYSIS AND RESULTS ....................................................... 70 Treatment of the Data .................................................................................................... 70 Preliminary Analysis of DATA: General Trends and Relationships ............................... 72 Principal Analysis of Data: Hypothesis Testing ............................................................ 81 Tool Access Effects on Spatial Visualization Improvement ...................................... 81 Tool Utilization Effects on Spatial Visualization Improvement................................ 86 Experience Effects on Spatial Visualization Ability Gains ....................................... 89 Experience Effects on Initial Spatial Visualization Ability ....................................... 92 Experience Effects on Grades ................................................................................... 94 Tool Utilization Effects on Grades ......................................................................... 100 Spatial Visualization Pre-test Effects on Grades .................................................... 105 Student Feedback ........................................................................................................ 113 Questionnaire.......................................................................................................... 113 Focus Group ........................................................................................................... 116 CHAPTER 5: DISCUSSION, CONCLUSIONS, AND RECOMMENDATIONS ....... 117 Discussion and Conclusions ........................................................................................ 118 Discussion and Conclusions of Results .................................................................. 118 Tool Access Effects on Spatial Visualization Improvement ................................ 118 Tool Utilization Effects on Spatial Visualization Improvement.......................... 118 Experience Effects on Spatial Visualization Ability Gains ................................. 120 Experience Effects on Initial Spatial Visualization Ability ................................. 121 Experience Effects on Grades ............................................................................. 122 Tool Utilization Effects on Grades ..................................................................... 123 Spatial Visualization Pre-test Effects on Grades ................................................ 123 Survey Responses ................................................................................................ 124 Discussion and Conclusions of Limitations ............................................................ 125 xi
Recommendations ....................................................................................................... 127 Recommendations for Practice ............................................................................... 127 Recommendations for Research .............................................................................. 128 REFERENCES ............................................................................................................... 131 APPENDIX A: PURDUE SPATIAL VISUALIZATION TEST – ROTATIONS ........ 137 APPENDIX B: EXPERIENCE SCORE LIKERT-TYPE SURVEY QUESTIONS ...... 153 APPENDIX C: SURVEY AND FOCUS GROUP SOLICITATION ............................ 155 APPENDIX D: RELEVANT ENG 181 WINTER 2008 DRAWING ASSIGNMENTS159 APPENDIX E: ENG 181 WINTER 2008 DAILY ASSIGNMENT LIST ..................... 172 APPENDIX F: CONSENT DOCUMENTATION ......................................................... 174 APPENDIX G: ENG 181 WINTER 2008 EXAM DRAWING PROBLEMS ............... 180 APPENDIX H: DATA PARSING MACRO .................................................................. 188 APPENDIX I: SQL SCRIPT .......................................................................................... 197
xii
LIST OF FIGURES
Figure
Page
1.1: Engineering graphics concepts required for creating graphical representations. ........ 2 1.2: Piagetian cognitive and spatial development. ............................................................ 15 1.3: Important spatial visualization concerns and theoretical protocol............................. 20 3.1: Power curve for one-way ANOVA, n=112, α=0.05, σ=5.3. ..................................... 53 3.1: Potential pattern of results given effective instructional tool. ................................... 67 4.1: Average spatial visualization score plotted vs. Experience score. ............................ 74 4.2: Average spatial visualization post-test score plotted vs. spatial visualization pre-test score. ......................................................................................................................... 75 4.3: Main effects for PSVT—R post-test for the usage random factor. ........................... 89 4.4: Drawing 11 grades plotted against PSVT—R pre-test scores by animation tool usage. ................................................................................................................................. 113
LIST OF TABLES
Table
Page
4.1: Descriptive statistics for blocked sections, excluding grades. ................................... 73 4.2: Pearson product moment correlation coefficients for initial spatial ability, various Drawing and non-drawing grades, and Experience scores. ...................................... 77 4.3: Pearson product moment correlation coefficients for initial spatial ability, various Drawing and non-drawing grades, animation tool utilization, and Experience scores. ................................................................................................................................... 78 4.4: T-test for significant differences in PSVT—R means between control and treatment groups, filtered for pre-test scores, grades, and Experience scores. ......................... 79 4.5: T-test for significant differences in PSVT—R means between control and treatment groups, filtered for pre-test scores. ........................................................................... 80 4.6: ANOVA for significant differences in PSVT—R between blocked labs, filtered for pre-test scores............................................................................................................ 81 4.7: GLM for significant differences in blocked labs, filtered for pre-test and post-test scores excluding zeros. ............................................................................................. 81 4.8: Descriptive statistics for data set filtered for PSVT—R and Experience scores. ...... 83 4.9: GLM ANCOVA for significant differences in PSVT—R post-test between control and treatment groups with blocked labs and experience and pre-test scores as covariates. ................................................................................................................. 84 4.10: GLM ANCOVA for significant differences in PSVT—R post-test between control and treatment groups, given blocked labs and pre-test scores as covariates. ........... 85 4.11: GLM ANCOVA for significant effects of the Overall Total Time utilization covariate on PSVT—R post-test scores. ................................................................... 87 4.12: GLM for PSVT—R post-test score effects by the animation usage factor. ............ 89 xiv
4.13: Experience effects and interactions with PSVT—R test gains. ............................... 91 4.14: GLM for PSVT—R pre-test score effects from Experience composite scores. ...... 92 4.15: GLM for PSVT—R pre-test score effects by Experience components: MODELS, SPORTS, and MUSIC. ............................................................................................. 94 4.16: GLM for response Non-visualization grades effects by Experience score covariates. ................................................................................................................................... 96 4.17: GLM for response all visualization grades effects by Experience score covariates.97 4.18: GLM for response of drawing problem scores on midterm exam effects by Experience score covariates. ..................................................................................... 98 4.19: GLM for drawing assignment visualization grades effects by Experience score covariates. ................................................................................................................. 99 4.20: Effects of animation tool usage on drawing visualization grades. ........................ 101 4.21: Effects of animation tool visits on drawing visualization grades. ......................... 102 4.22: Effects of animation tool visits on midterm exam visualization grades. ............... 103 4.23: T-test for Drawing 11 scores of those using the Drawing 11 animation tool versus those who did not use the tool................................................................................. 104 4.24: GLM for Drawing 11 animation tool usage effects on Drawing 11 grades. ......... 105 4.25: Effects of PSVT—R pre-test scores on all grades. ................................................ 106 4.26: Effects of PSVT—R pre-test scores on all but Drawing assignments. .................. 107 4.27: Effects of PSVT—R pre-test scores on all but Drawing assignments and exam Drawing grades. ...................................................................................................... 108 4.28: Effects of PSVT—R pre-test scores on Drawing assignment and exam Drawing grades. ..................................................................................................................... 109 4.29: Effects of PSVT—R pre-test scores on Drawing assignment grades. ................... 110 4.30: Effects of PSVT—R pre-test scores on Drawing midterm exam grades............... 111 4.31: Effects of PSVT—R pre-test scores and Experience composite scores on Drawing midterm exam grades. ............................................................................................. 112 xv
CHAPTER 1: CONTEXT, RATIONALE, AND THEORETICAL FRAMEWORK Problem Context Everything concrete or tangible in this world forms the experiences and actions for which mental representations among three-dimensional objects in space and time are created for understanding and mental processing. The ability to statically create and dynamically project mental representations of three-dimensional objects in different space and time settings is often referred to as spatial visualization. Spatial visualization skills are a result of genetics (potential) and life experiences (practice and development). Varying levels of potential and practice and development in individuals result in varied levels of spatial visualization skills. Spatial visualization skills in young adults can be enhanced through instruction and practice (Piburn, Reynolds, McAuliffe, et al., 2005; Crown, 2001, Deno, 1995; Lord, 1985; Pallrand & Seeber, 1984; Peters, Chisholm, Laeng, 1995; Sorby & Baartmans, 1996). Motivating Factors Specific to this application, spatial visualization skills are an important aspect of engineering education. They enhance student understanding and help students formulate problems. Spatial visualization ability is essential for engineers to perform adequately in academia and industry. Visualization ability is often indicative of academic performance in the engineering curriculum (Yue, 2002). 1
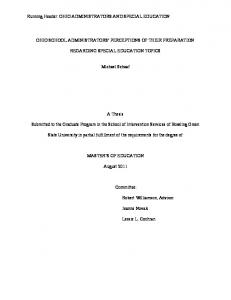
Today, engineering graphics instructional teams strive to develop in students the necessary spatial visualization and graphical representation skills to allow them to express ideas in the course of solving problems. The major requisite skills by engineering graphics students for the generation of graphical representations are depicted in Figure 1.1.
Neat labeling of all of the depictions below
Familiarity With Drafting Tools
Transferring Figure
Familiarity With Technology Tools
Lettering
Project real object Onto 2-D space
Depict with removed material
2-D Multi-view CAD
si ze
si z es ow sh er ly
ow sh s
Pr op
ly er
Represent interior or properly show interior sizes
op
Visualize in 2-D or 3-D per view
Pr
Isometric
(word processor, Presentations, Manufacturing)
Sectioned Multi-view CAD
Sectioned Multi-View
Depict with removed material
Represent interior or properly show interior sizes
Multi-View
Merging with Other Technologies
(virtual space,computer, mouse, etc.)
Project real object Onto 2-D space
(pencil, eraser, T-square triangle, etc.)
Computer-aided design
Representing on Technology Media
Dimensioning & Tolerancing CAD
Dimensioning & Tolerancing
Visualize in 2-D or 3-D per view
Manual Drafting
3-D Solid Model CAD
Figure 1.1: Engineering graphics concepts required for creating graphical representations.
In the context it was defined earlier, spatial visualization is a subcategory of visualization. Visualization can be defined as, “the ability to take an idea from one’s mind and model it…”, and “...the ability to comprehend someone else’s model” (Newcomer, McKell, Raudebaugh, 2001, p. 33). 2
Given that first-year engineering students enter the academic field of engineering with a variety of backgrounds and experiences, and thus, varying degrees of spatial visualization skill development, there is a need for additional attention and effort in some students. Sometimes standard instruction and coursework at the introductory level of engineering graphics is not enough. Students on this lower end of spatial visualization skill development need to close the gap between the level of their skills in this area and the level of the more honed skills of their peers. Since spatial visualization skills are essential for success in engineering and other technical fields of study, it is important to develop spatial visualization ability during the developmental years of students. The need for remediation can be avoided through activities involving building, tactile manipulation of objects, and other tasks to reinforce these skills prior to college. Good spatial visualization skills can maintain low student attrition rates in science and engineering, and improve general student performance in the engineering curricula. Problem-solving and problem formulation abilities are related to spatial visualization skills (Carter, LaRussa, Bodner, 1987). A lack of high spatial visualization capabilities on the part of entering freshman students at the postsecondary level may result in students selecting programs of study outside of engineering and other technical fields. Spatial visualization competency is thus a significant concern. Problem Statement Undergraduate students entering a first-year engineering program arrive with a variety of backgrounds, experiences, and abilities. Spatial visualization skills are among those abilities that have been correlated to performance in engineering graphics and other introductory first-year engineering courses, as well as the overall quality of engineers. 3
This study will examine tools and techniques that can be used to enhance the spatial visualization skills of beginning engineering students. The relationship between grades, spatial visualization instructional tool usage, developmental experiences, and spatial visualization test scores will also be investigated. Research Questions This study will address the following questions: 1.
Can a computer aided design (CAD)-based 3-dimensional animated model of existing, assigned, paper-based engineering graphics problems be used as an effective instructional tool that enables students to enhance their spatial visualization skills?
2.
Does participation in certain activities prior to enrolling in an engineering degree program in college predict initial scores on spatial visualization tests?
3.
Do students’ experience levels in certain developmental activities, positively correlated to spatial visualization ability, predict student gains in spatial visualization tests?
4.
How do spatial visualization skills in engineering students, as gauged by spatial visualization tests, relate to performance on relevant engineering graphics assignments?
5.
How do spatial visualization skills in engineering students, as gauged by spatial visualization tests, relate to performance on relevant non-graphics assignments?
4
Rationale: The Significance of Spatial Visualization Skills in Engineering Education Engineering graphics courses develop graphical communication and spatial visualization skills in student engineers. Spatial visualization skills should be emphasized throughout the engineering curriculum. The use of spatial instructional strategies in engineering courses can reinforce student abilities (Hsi, Linn, Bell, 1997). Exam scores in engineering and other technical fields of study are significantly correlated to spatial visualization ability. Understanding of physics concepts, as evaluated by testing, has been to shown to be predicted by initial spatial visualization abilities of physics students (Kozhevnikov & Thornton, 2006). Spatial visualization skills should be promoted through remedial instruction at the collegiate level or during the developmental periods prior to college. Students who claim a general dislike for the sciences and technical disciplines often lack adequate spatial visualization skills regardless of their performance in other areas (Pallrand & Seeber, 1984). Spatial visualization is also strongly related to problem solving ability, an essential aspect of engineering (Carter, et al., 1987). Technology tools such as computer-aided design and modeling (CAD and CAM) do not alleviate the need for strong spatial visualization skills, nor does the practice of blind adherence to analytic procedures or algorithms in the course of providing alternate representations of objects and designs. Students who do not possess the prerequisite skill set should be given options to remediate and enhance their spatial visualization skills to prepare them for engineering graphics and the remaining engineering curriculum for which possession of these skills is essential. Students should be discouraged from circumventing a skill area necessary for proficiency in their future profession. 5
Theoretical Framework Factors Affecting Spatial Visualization Ability Early research on spatial visualization skills suggested that spatial visualization ability is wholly innate (Lord, 1985). Modern studies however indicate that spatial visualization skills can be improved through practice (Piburn, et al., 2005; Crown, 2001, Deno, 1995; Lord, 1985; Pallrand & Seeber, 1984; Peters, et al., 1995; Sorby & Baartmans, 1996). Those with deficiencies in spatial visualization ability can work to develop their skills. The source of spatial visualization deficiencies includes a lack of previous experiences such as actions performed on objects in space. Childhood activities involving construction games and toys, art and sketching, video games, sports, and tactile experiences with concrete objects are among the positive socio-cultural influences listed by researchers (Pallrand & Seeber, 1984; Peters, et al., 1995; Yue, 2002). Learning Theory and Cognitive Development Jean Piaget proposes four stages of cognitive development: sensory-motor, which is pre-verbal; pre-operational representation, which creates the underpinnings of language and symbol; concrete operational, which precedes full capability of abstraction; and finally, formal or hypothetic-deductive operational, which allows for full abstraction such as reasoning on hypotheses and the ability of propositional logic (2003, S9). Piaget provides ages as guidelines to separate one stage from another: the sensory-motor stage ends around 18 to 24 months of age; the pre-operational representation stage reaches up to seven to eight years of age; the concrete operational stage lasts to eleven to twelve 6
years of age typically; and the hypothetic-deductive operational stage develops through adolescence and onward. Piaget’s theories require that development precedes learning. Learning at higher levels becomes possible only as the individual passes through the four stages of development. Undergraduate engineering students would thus be in the fourth Piagetian stage of development. These stages are traversed as a result of four factors: maturation, limiting mental potential; experience, or play and interaction with the environment; social transmission, or social context; and equilibration, of which the fourth he stresses and discusses in great depth (Piaget, 2003, S10-S14). Piaget says that individuals, upon encountering a new piece of knowledge, always seek to maintain balance or equilibrium. Upon feeling perturbation from a new piece of knowledge, an individual learner will first attempt to assimilate this information into their existing structures, and, if this fails to attain the necessary balance or comfort level, they will accommodate it via a restructuring of their existing mental structures in an effort to avoid feeling perturbation (Piaget, 2003, S13S14). Piaget talks of a structure which acts as an intermediary between “stimulus” and “response” in the traditional S—R model (2003, S14). The response essentially already exists if there is any response at all, as the response is only elicited by the stimulus if there is supporting structure. The structure continues to develop through assimilation and accommodation, potentially affecting the evolution of the response with each iteration, thus the circular nature of the model. Those in Piaget’s fourth stage of cognitive development are typified by ability to delve into the hypothetical without having to see or interact with the concrete; abstract 7
thought is possible (2003, pp. S9-S10). An individual in this last stage of development is capable of reason “on the basis of simple assumptions which have no necessary relation to reality or to the subject’s beliefs, and from the time when he relies on the necessary validity of an inference (vi formae), as opposed to agreement of the conclusions with experience” (Piaget, 1976, p.148). In other words, thought is not bounded by the finite set of experiences of the individual in that “there is even more than reality involved, since the world of the possible becomes available for construction and since thought becomes free from the real world” (Piaget, 1976, p. 151). Eventually the ties to “real action” are not necessary as the individual can make “hypothetic-deductive operations concerning pure implications from propositions stated as postulates” (Piaget, 1976, p. 153). Lev Vygotsky (1978) defines two terms, one of which is the Zone of Proximal Development (ZPD), while the other is “actual developmental level” (p. 85). The actual developmental level is defined as what a child can do independently, without the assistance of others. The ZPD is everything beyond that point which can be performed by the child with assistance. Vygotsky (1978) specifically says the following about the ZPD: It is the distance between the actual developmental level as determined by independent problem solving and the level of potential development as determined through problem solving under adult guidance or in collaboration with more capable peers. (p. 86) Vygotsky states that learning should lead development and encourage development. The only learning of any use to children is that which advances development (Vygotsky, 1978, p. 89). Through the exercising of the child’s ZPD with 8
the help of those in the social context providing necessary guidance and social interactions, internal developmental processes are utilized and knowledge from actual experience in the social context is eventually re-constructed and internalized to expand the child’s attained developmental level (Vygotsky, 1978, p. 90). Progression of learning and development, and expansion of the ZPD thus requires the assistance of an adult or capable peer. After Vygotsky’s time, this is referred to as scaffolding (Bruner, 1990, p. 106). Scaffolding is any type of external aid or assistance provided directly by or developed in proxy by someone more capable, and can take the form of books, conversation, teamwork, computer-based exercises and instruction, questions, discussion, or any cultural artifact in the social context which aids the learner in some manner in their ZPD as they internalize and re-construct that which they take from the social context. A form of scaffolding, for example, could be three-dimensional rotated animations for students in engineering graphical communications classes. So learning drives mental development; independent ability is representative of actual development, while ability with assistance is representative of prospective development. Therefore, prospective development, or the Zone of Proximal Development, should be the target area of instruction. Two individuals may have the same level of actual developmental ability, but they do not necessarily have a zone of proximal development which encompasses the same scope, breadth, or depth in any given area. This suggests the need for a variety of different types, and by extension, sources of scaffolding. This is something difficult for one teacher to provide on their own, and causes educators to look elsewhere for “non-traditional” models and sources of scaffolding, including indirect instructional methods. 9
Discussion of Vygotsky and Piaget and their theories on the structuring of knowledge thus inevitably leads to the theory of constructivism. The two guiding principles, as stated by von Glasersfeld (1989) are: a) Knowledge is not passively received either through the senses or by way of communication; b) knowledge is actively built up by the cognizing subject. a) The function of cognition is adaptive, in the biological sense of the term, tending towards fit or viability; [italics in original] b) cognition serves the subject’s organization of the experiential world, not the discovery of an objective ontological reality. (p. 5) Considering the documented work of classics and contemporaries on the issues of social versus radical constructivism, it is apparent that regardless of social considerations, the individual still constructs knowledge to satisfy his/her world as his/her perception allows. Piagetian Spatial Development In Piaget’s works, there are parent and subordinate spatial abilities in a two-tiered hierarchical tree of spatial abilities which overlap in development with some degree of sequence but also some concurrence. These spatial abilities generally increase in complexity and developmental level required for mastery and are acquired and honed as the child ages and develops mentally. These spatial abilities (or “spaces”) and the subabilities within each space chronologically, but loosely, follow the four stages of cognitive development (Piaget, 1967) at different paces and points of inception. In general, of the three spaces, the two more advanced spaces and their associated spatial
10
sub-abilities develop later in the four stages of cognitive development than the less advanced space and its sub-abilities. Before delving into the details of these spatial abilities, sub-abilities, and how they relate to the stages of cognitive development, Piagetian terminology and nuances should be clarified. There are five terms referred to as “spaces.” To alleviate confusion, it is best to consider perceptual and conceptual space as types of thought, and topological, projective, and Euclidian space as spatial abilities, under each of which are several specific sub-abilities. Piaget does not effectively distinguish between projective and Euclidian spatial abilities in instances, nor does he specify defined starting points of all spatial ability development relative to perceptual versus conceptual spatial thought (Reese, 1999, p. 167) thus eliciting many gray areas. The implication of all this is that it is important to be cognizant of the generalities involved in the spatial abilities, their corresponding spatial sub-abilities, and how they relate loosely—sometimes concurrently, and sometimes sequentially—to the cognitive stages of development. Conceptual thought lags behind but grows in tandem with perceptual thought. Both of these develop simultaneously with perceptual thought as the original buttressing factor of conceptual thought. Perceptual thought remains ahead of conceptual thought throughout the spatial development of the child even as the child traverses the major spaces of topological, projective, and Euclidian spatial abilities. Most of the topological spatial ability develops alongside perceptual and conceptual thought. As these developments near maturity, the development of projective and Euclidian spatial abilities begins to flourish. 11
As a child progresses through Piaget’s four stages of cognitive development, he/she first develops primarily in the area of topological spatial ability and its corresponding sub-abilities. Topological spatial abilities are the most basic of the three spatial abilities and include shape recognition, shape differentiation, order, surrounding, and continuity. At first the infant is in perceptual thought visio-spatially and simultaneously in the sensory-motor cognitive stage of development. At this point the child performs “an imitation of the object by an action” (Piaget, 1967, p. 455) and is unable to mentally capture objects, or conceptualize that which is not immediately accessible. Only the most basic spatial relationships, such as proximity, separation, order, enclosure, and continuity are available with development and time progression through the topological space. The conceptual spatial ability begins late in the sensory-motor cognitive stage of development and occurs when the child can conceptualize or imagine an object or actions on an object regardless of the object’s presence in the field of the child’s activity. “The construction of space begins on the perceptual level and continues on the representational [conceptual] one” (Piaget, 1967, p. 38). As development continues and the child progresses through the conceptual level, “the image, which from the very beginning is symbolic in character, plays an increasingly subordinate role as the active component of thought becomes better organized” (Piaget, 1967, p. 456). The perceptual thought development continues and allows for further conceptual thought development as the child acquires more topological spatial abilities. Simultaneously, the child experiences more “decentration,” corresponding to less egocentricity, allowing him/her to conceive of
12
spatial relationships outside his/her immediate sphere of influence in reality and the surrounding concrete environment, allowing for a later shift in spatial perspectives. The development of projective and Euclidian spatial abilities are minimally concurrent with the development of the topological abilities and have unclear starting points. These two more advanced spatial abilities trickle at first prior to the final, or hypothetical-mathematical, stage of cognitive development while topological spatial abilities are rapidly developing. Projective and Euclidian spatial abilities then accelerate concurrently as the child nears or reaches full development of topological abilities and cognitive development progresses into the fourth, or logical-mathematical, abstract reasoning stage of cognitive development. It is the projective spatial abilities that allow for understanding of spatial relationships between multiple objects simultaneously and, importantly, the concept of viewpoint (Reese, 1999, p. 167). It is here that object orientation, viewer perspective and similar advanced spatial visualization abilities develop. Euclidian spatial development allows for measurement, combining mathematical understandings such as conservation, similarities, proportions, mathematical generalizations applied to space and objects in space, systems and frames of reference and coordinate systems, and full understanding of accurate, scaled, visual, proportioned models or diagrammatic representations. It must be stressed that many of these Euclidian spatial abilities must develop concurrently with projective spatial abilities. Both stem from topologic spatial ability, but in different ways (Piaget, 1967). This study focuses on the Piagetian projective spatial abilities.
13
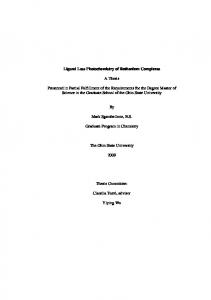
The relationships and developmental timing of Piagetian stages of cognitive development, spatial abilities, and perceptual/conceptual phases are schematically depicted in Figure 1.2. Note that the approximate development of each is indicated by increasing opaqueness of each representative bar as a function of age and cognitive developmental stage progression. Spatial visualization skills can be honed by presenting a variety of different representations of objects. The simplest and oldest of these are concrete representations such as wooden blocks cut to a size and shape to be depicted graphically by the student. Paper depictions and dynamic depictions on a computer screen are other forms that can help students see different perspectives of objects. Research in other fields of education has demonstrated the value of the use of multiple representations in the classroom.
14
Figure 1.2. Piagetian cognitive and spatial development.
Representation A representation is a schema, transformation, model, symbol, or a map of an idea, concept, knowledge bit, datum, or set of these. Representations in education are commonly divided into internal and external representations. External representations occur outside the mind and can serve to communicate organized thoughts for ourselves or others, and include such things as graphs, text, diagrams, drawings, equations, models and prototypes. External representations are an expression of an idea or collection of ideas, perhaps just a bookmark for a thought, or as extensive as a full, formal 15
communication intended for others. The recognition and active application of representations in the classroom are Piagetian in that: Knowledge is not a copy of reality. To know an object, to know an event, is not simply to look at it and make a mental copy or image of it. To know an object is to act on it. To know is to modify, to transform the object, and to understand the process of this transformation, and as a consequence to understand the way the object is constructed. (Piaget, 2003, p. S8) External representations can be static or dynamic (Goldin & Shteingold, 2001), especially considering the current state of technology. Internal representations represent a mental schematic, idea or picture of a concept. They are impossible to gauge directly because they occur inside the mind. However, internal representations dictate how an individual generates external representations, and in this sense they can be gauged indirectly. They can also be corrected, refined, reinforced, extended, and built upon through exercising the recursive use of representations in the classroom. The concepts of internal representation and external representation (Janvier, Girardon, & Morand, 1993) are similar in that they both refer to the symbolism of an object or idea and a resultant transformation. They are distinct in that internal representations are formed internally in the mind and consist of mental images or schemas that exist as part of the cognitive structure of the brain. External representations, however, exist outside the mind in the social context of the learning environment (Vygotsky 1978). Their variety and multitude (Brenner, et al., 1997) and their similarities to the existing internal representations and cognitive structures in the mind of a student can enhance the learning and development of a student. 16
Representations in the classroom can promote or hinder the cognition of concepts. To promote the cognition of concepts, representations, both internal and external, must be provided such that the figurative gaps between them are narrow and can easily be bridged by the individual. In addition, representations can serve a formative purpose. Each student has a different mental structural content. It is thus the role of the instructor to gauge or interpret the structural content of each student’s mind. Given such a window, the instructor can provide (not necessarily directly) the external representations necessary to allow the student to correctly internalize concepts without dictation through the use of classroom discourse and the generation of verbal (discussion), written (minute papers, other more formal papers), diagrammatic (graphs, figures, sketches, etc.), computerbased, or other external representations from the instructor as well as from student peers. As student internal representations develop and progress, more external representations are solicited, begetting a cyclic development. It is important to note that students do not necessarily have the skill set to synthesize an external representation provided by a peer or instructor; the external representation may enhance their comprehension of a concept without creating the ability to internalize that representation in those targeted for learning and development. The cognition of the student can be positively impacted through the connections made between the student’s internal representations and the external representations in a learning environment. As Greeno and Hall (1997) stated, “Forms of representation are significant in the construction and communication of understanding,” (p. 122). Therefore, it is important to establish similarities between the students’ existing conceptualizations or cognitive structures of information (internal representations) and 17
the new concepts for which an instructor wishes to convey meanings through models (external representations). It is in this fashion that the effective use of representations in the classroom is constructivist because “learning is possible if you base the more complex structure on simpler structures, that is, when there is a natural relationship and development of structures and not simply an external reinforcement” (Piaget, 2003, p. S16). Representations, like the constructivism they stem from, are recursive and are also based on Piagetian theory of continuous accommodation and assimilation. The use of multiple representations in the classroom also invokes the Piagetian developmental factor of experience. Piaget discusses two types of experience, physical and logical-mathematical (2003, p. S11). Physical experience is empirical and deals with the concrete and “acting upon objects and drawing some knowledge about the objects by abstractions from the objects” (2003, p. S11). In logical-mathematical experience, “knowledge is not drawn from the objects, but it is drawn by the actions effected upon the objects” (2003, p. S11). To clarify, logical-mathematical experience is “an experience of the actions of the subject, and not an experience of objects themselves” (Piaget, 2003, p. S12). Eventually, the subject can perform such actions without the use of the physical world or props, and can abstractly reason without the support of haptic or otherwise reality-based interactions. Thus in the cycle of building and reconstructing multiple internal and external representations, and internalizing external representations, it is the inter-representational transformations of these understandings that provides valuable experiences for the students that is most significant, not the actual media or content of the representations. 18
Given that all students have different existing mental images, or schemas, and unique cognitive structures, the presentation of multiple, varied representations allows the concepts being represented to fit into the diverse cognitive frameworks in the minds of more students. One size does not fit all, and presenting multiple, varied representations is a fair response to the cognizance of different students with different learning needs and a desire to fulfill as many of these needs as possible. Representations, both internal and external, build on each other and are building blocks of constructivist learning. Theoretical Implications The Vygotskian implications of internalized construction of the history of external experiences in the socio-cultural context, coupled with the scaffolding involved in the Zone of Proximal Development are substantive. From this, any and all kinds of affective socio-cultural support in the development of individuals are crucial. This includes providing external representations to support the recursive development and advancement of internal representations. The external representations provided in this case are scaffolding in the form of three-dimensional animations of rotating objects in virtual space on a computer screen. The use of external representations in the form of virtual three-dimensional animations of objects can serve to bridge gaps between students’ internal schemata of how an object looks when rotated and how it should look two-dimensionally on paper or on a computer screen. These viewing exercises also allow for students in the Piagetian hypothetical-deductive fourth stage of cognitive development to gain what Piaget terms logical-mathematical experience in the exercise of making the mental transformations required to understand the provided external representation, while simultaneously 19
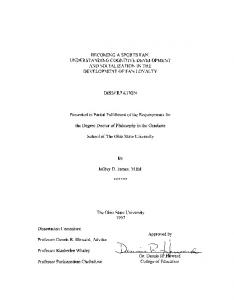
bridging aforementioned gaps in understanding resulting from potentially underdeveloped projective spatial ability. Assimilation and accommodation continue their cyclic structuring of knowledge through the mental operations performed on objects, concrete or otherwise. These transformations continue to affect students in their final cognitive stage of development, as well as in their projective spatial abilities. Existing student spatial visualization ability is determined by genetics, life experiences, and developmental activity. Spatial visualization abilities can be improved through practice or further experiences in transforming object orientations in space. Spatial visualization ability in individuals can be gauged through spatial visualization tests. The major issues surrounding spatial visualization ability and the coupling of the theoretical protocol are depicted in Figure 1.3.
Figure 1.3: Important spatial visualization concerns and theoretical protocol. 20
Throughout this investigation, student spatial visualization abilities prior to instruction and after providing additional logical-mathematical experience in the form of external, virtual, dynamic three-dimensional representations will be gauged to determine the effects of these experiences on students. This investigation serves to seek evidence of whether this Vygotskian scaffolding and Piagetian experience that result in mental transformations from viewing the animations will significantly enhance performance on a known metric of spatial visualization ability. In addition, surveying students’ prior transformative experiences during the Piagetian stages of cognitive development and spatial development shown by others (Deno, 1995) to affect Piagetian projective spatial ability can point to the relationship between these experiences and initial spatial visualization ability prior to treatment. A gauge of these developmental experiences can also indicate the potential for more substantive gains during instruction and treatment as a function of the magnitude of developmental experiences. In other words, those students with a greater extent of these developmental experiences would also be expected to have a greater Zone of Proximal Development, and thus should have more to gain from the scaffolding provided. Research in the areas of the utilization and necessity of spatial visualization skills in life, specific experiences during development affecting spatial visualization abilities, spatial visualization assessment methods, spatial visualization enhancement, and the use of two-dimensional and virtual media to enhance spatial visualization skills is well documented and crucial to this study. However these are extensive, and thus will be discussed in depth in Chapter 2. 21
CHAPTER 2: LITERATURE REVIEW
Spatial visualization skills are critical for success in engineering education and essential ingredients for student understanding. Spatial visualization ability is an important characteristic for engineers to function properly in their professional and academic careers (Sorby & Baartmans, 2000). A variety of metrics show that students with superior visualization abilities perform better in engineering graphics as well as other engineering curriculum classes (Yue, 2002). Engineering graphics instructional teams strive to develop in students the necessary visualization and graphical representation skills that allow them to express ideas in the course of solving problems. Visualization has been defined as, “the ability to take an idea from one’s mind and model it…”, and “...the ability to comprehend someone else’s model” (Newcomer, et al., 2001, p. 33). This chapter presents the historical perspective of engineering graphics coursework, the significance of spatial visualization skills in engineering, spatial visualization skills assessment methods, factors affecting spatial visualization ability, alternatives to promoting good spatial visualization skills, and methods for enhancing spatial visualization skills.
22
Historical Perspective Engineering graphics remained relatively unchanged in the 20th century until the early 1990’s evolution of the economically-accessible computer and software technologies that brought computer-aided design (CAD) and computer-aided modeling (CAM) to engineering classrooms. This affordability coupled with employer and student demand led to the merging of traditional graphics with limited use of these technologies in the classroom until the late 1990’s. Much of the focus remained on traditional manual drawing tools such as triangles, T-squares, compasses, and calipers. Today engineering graphics is much more student-friendly, integrated, and preparatory. In recent years, researchers have investigated and repeatedly stressed the need to change the manner in which engineering is introduced to pre-engineers (Bolton & Morgan, 1997; Condoor, 1999; Morgan & Bolton, 1998). In many institutions with engineering programs, integrated curricula incorporating an introduction to engineering, engineering graphics and communication, technical writing, engineering technology tools, engineering ethics, and teamwork have been proposed and implemented. Typically in the past, more time was spent on individual work and lecture dealing with the creation, projection, and manipulation of manually-drawn depictions of objects and designs. Currently, more stress is placed on the learning styles of engineering students, who tend to be more visual rather than verbal (Scribner & Anderson, 2005; The Ohio State University College of Engineering, 2003). Modern engineering graphics, often taught in “Introduction to Engineering,” “Fundamentals of Engineering,” “FirstYear Engineering,” or other similar titles, use a studio approach similar to the settings found in art and architecture where students are arranged in teams to promote peer 23
instruction, more attention to physical space in the classroom arrangement, and termlength design projects (Barr, Schmidt, Krueger, Twu, 2000; Little & Cardenas, 2001). Significance of Spatial Visualization Skills in Engineering Education The importance of promoting visualization is illustrated by Condoor (1999): Visual thinking is one of the distinguishing characteristics of an engineer. At a mundane level, it is useful for documenting ideas, representing designs, and communicating them to others. At a more fundamental level, it helps reasoning about ideas and designs. For instance, designers use visual thinking to reason about stress, strain, fluid-flow, electric, and magnetic fields. Recognizing the importance of visual thinking as a means of communication and a tool for reasoning, educators have incorporated visual thinking throughout the engineering curriculum. (p. 13). One of the stated goals of the engineering graphics course should include a desire to develop good spatial visualization skills in a student engineer. It is not only important to stress spatial visualization skills at the introductory level, spatial visualization skills should be emphasized throughout the engineering curriculum. Engineering instruction should use spatial instructional strategies to reinforce student abilities (Hsi, et al., 1997). Performance on exams in engineering and other technical fields of study shows that scores are significantly correlated to spatial visualization ability. Academic failure is shown to be related to deficiencies in two- and three-dimensional perceptional abilities (Rochford, Fairall, Irving, Hurly, 1989). Because spatial visualization skills are essential to engineers beginning and graduating from engineering programs at colleges and universities, it is necessary to promote spatial visualization skills either through remedial instruction at the collegiate level or during the developmental periods prior to college. Given the need for technically adept individuals during most economic periods, industry and academia cannot afford to 24
lose intellectually competent individuals due to a lack of nurturing of spatial visualization abilities in developing students. Students who are competent in mathematics and other subject areas often withdraw or simply do not select technical courses due to a lack of the necessary spatial visualization skills and often, as a result, claim a general dislike for the sciences and technical disciplines (Pallrand & Seeber, 1984). In addition, as engineers are reputed problem solvers, spatial visualization skills are indispensable to engineers not only because of the need to represent designs, but also because spatial visualization ability is shown to be significantly correlated to problem solving ability (Carter, et al., 1987). The importance of spatial visualization skills to engineers and others pursuing technical fields are also highlighted by Scribner and Andersen (2005). Assessing Visualization Skills Tests of spatial visualization ability usually measure the subject’s skills by requiring the completion of tasks demanding varying degrees of mental image rotation, cutting, folding, or other alterations. Tasks that can only be performed by mental alterations of given images are said to be holistic or non-analytic. Tasks that require similar actions on images, but provide some verbal cue or can be accomplished algorithmically, are said to be analytic or not completely holistic in nature. Many researchers who wish to obtain a measurement of a subject’s pure spatial visualization ability often avoid tests of spatial visualization that have verbal or analytic cues as the results can be confounded by such features (Carter, et al., 1987). It is apparent that some researchers tend to think that providing analytic aids such as verbal cues or algorithmically-solvable problems allow the subject to “cheat” by foregoing his or her visualization abilities. 25
There are a number of spatial visualization tests available that researchers in this field often use as instruments for gauging spatial visualization abilities of students. The Purdue Spatial Visualization Test: Rotations (PSVT—R) is the most commonly used test of engineering students’ spatial visualization skills. The PSVT—R is often preferred because it effectively measures raw spatial visualization skills while allowing for minimal verbal, analytic, or otherwise non-holistic bias to affect the scoring of those being tested (Carter, et al., 1987). This and other tests typically measure the visualization skills of students at the second stage of the three stages of Piagetian spatial development (Sorby & Baartmans, 1996). It is in the second stage of Piagetian spatial development, referred to as projective representation, where humans develop the ability to mentally perceive the appearance of objects from different perspectives and orientations (Bishop, 1978). The Mental Rotations Test (MRT) is also a commonly used non-analytic test that is similar to the PSVT—R in that it includes 24 problems to be solved via internal rotation of mental imagery, but there are two correct answers per problem. The Paper Folding Test (PFT), an analytical spatial test, asks the participant to determine which of several choices of patterns on paper would result if the original piece of paper were holepunched and folded a number of times. The PFT and other tests are available in the “Kit of Factor Referenced Cognitive Tests” from the Educational Testing Service in Princeton, New Jersey (Lord, 1985; Pallrand & Seeber, 1984; Peters, et al., 1995). There are also other tests either designed anew by researchers or that are alterations of the aforementioned tests. The technologies used and the quality and not sightfulness of these tests vary and are often dependent on the available resources of the researchers 26
performing the study. A compilation of spatial aptitude tests given over the years by military, university, and other researchers in the twentieth century through the early 1980’s is provided by Eliot and Smith (1983). In nearly all studies where gender is mentioned as a variable, a gap typically is reported to exist between the spatial visualization test scores of men and women, with women typically having significantly lower scores than men. In posttests, after the subjects of studies are exposed to some form of spatial visualization instruction, the gap narrows between those originally scoring lower (particularly women) and those originally scoring higher (mostly men) during pretests (Branoff, 1998; Peters, et al., 1995; Sorby & Baartmans, 1996). Factors Affecting Spatial Visualization Ability Some researchers of the 1960’s and early 1970’s suggest that spatial visualization skills cannot be taught and are innate traits of individuals (Lord, 1985). More recent studies show that spatial visualization skills can be improved through activities involving spatial perception (Crown, 2001; Deno, 1995; Lord, 1985; Pallrand & Seeber, 1984; Peters, et al., 1995; Sorby & Baartmans, 1996). When differences in male and female performance are noted, the existing gender gap often found in pretests tends to close following effective exercises of spatial visualization skills as evidenced in posttest results (Hsi, et al., 1997; Peters, et al., 1995; Sorby & Baartmans, 1996). The closing of this gap indicates that those with deficiencies in spatial visualization ability can make up for lost time by exercising their skills in this area until their skill level matches those of their peers. This is analogous to a weaker muscle gaining strength more rapidly than regularly worked muscles in the body and is a valid application of the ubiquitous “learning curve.” 27
The question then inevitably arises regarding the source of spatial visualization deficiencies. To answer, the factors affecting visual spatial ability need to be determined. Researchers suggest that previous experiences such as actions performed on objects in space stimulate adolescents to develop spatial visualization skills (Bishop, 1978). Sociocultural factors such as childhood activities involving construction games and toys, art and sketching, video games, sports, and tactile experiences with concrete objects are among the influences listed by researchers (Pallrand & Seeber, 1984; Peters, et al., 1995; Yue, 2002). These are qualitative observations grounded in experience, but can be speculative and tend to appear in the last sentences of research papers, seemingly as an afterthought. The constructivist argument that, “Each of us makes sense of our world by synthesizing new experiences into what we have previously come to understand” (Brooks & Brooks, 1999, p. 4), supports the importance of experience in making increasingly complex understandings. One study in particular quantitatively compares the scores of subjects who took a spatial visualization test to an inventory of activities in which the subjects participated during their pre-collegiate development (Deno, 1995). This study employed two research tools. The Mental Rotations Test (MRT), used to measure spatial visualization ability, consists of 20 criterion figures for which there are two correct alternatives and two incorrect alternatives. The Spatial Experience Inventory (SEI), developed by the researcher and based on a list of spatial activities compiled through research done by Guay et. al, (Guay, 1977; Guay, McDaniel, & Angelo, 1978; Guay & McDaniel, 1979, 1982; McDaniel, Guay, Ball, & Kolloff, 1978) is comprised of a list of activities, the frequency each activity occurred, and the time period during the student’s development 28
that each activity occurred. The SEI is comprised of 312 items. These items fall into three possible categories: Formal Academic, Non-academic, and Sports activities. Each activity can be placed in the following developmental periods: junior high school, high school, postsecondary; pre-school, elementary organized, elementary non-organized. The sample consisted of 396 beginning engineering students enrolled in Engineering Graphics 166 during Winter Quarter of 1993 at the Ohio State University. Of the 396 students, 324 were men and 72 were women. ANOVA was used to confirm statistical significance of mean differences between groups, reliability analysis was conducted on the SEI, and correlation analysis was conducted between predictors and spatial measures. The SEI spatial ability groups were shown to be highly reliable, as were the elements of the developmental period scale with the exception of the elementary organized activities. It was shown through an analysis using Pearson product-moment correlation that Nonacademic activities during high school seem to be the strongest predictor of ability in spatial visualization. The inventory not only is a catalog of the various activities in which the participants had previously engaged, it also relates the developmental time period of each activity, as well as whether that activity was academic, organized, or unorganized in nature. The findings confirm most of the other researchers’ quantitative assessments of the importance of life experiences in predicting one’s current spatial visualization abilities. The study shows that building activities (non-academic during high school and middle school) are the most correlated to high spatial visualization skills for men. Women with higher spatial visualization skills most commonly have frequent video game and educational program viewing experiences. This difference in activities between men 29
and women answers some questions about the gender gap dilemma as it pertains to spatial visualization ability. Notably, those women with the greater than average building activity experiences have correlations to higher spatial visualization ability, but visual activities still seem to be more correlated to this phenomenon in females. Alternatives to Promoting Good Visualization Skills Some may say that development of spatial visualization skills is not as necessary as it was before the advent of affordable technology tools such as computer-aided design and modeling (e.g., CAD and CAM). As discussed earlier, however, spatial visualization skills are not just requisite of object and design depiction. They are also significantly correlated to problem-solving ability and performance in the sciences. Koch (2006) found that spatial visualization skills, as tested by the Purdue Spatial Visualization Test— Rotations, significantly predicted technical problem solving ability, yet found no significant difference in problem solving ability between students using manual drawing tools versus solid modeling. There are students who may struggle through engineering graphics courses by blindly following analytic procedures or algorithms in the course of providing alternate representations to objects and designs. Once again, it is important to note that this approach towards (or avoidance of) a skill deficiency is not a viable solution given the possibility and value of remediation in the area of spatial visualization ability (Sorby & Baartmans, 1996). Placement exams prove effective in properly placing students in courses for which they are adequately prepared (Sorby & Young, 1998). Students with the necessary spatial visualization skills can be placed in regular graphics courses, while others who do not possess the prerequisite skill set can be placed in remedial courses 30
designed to enhance their spatial visualization skills and prepare them for engineering graphics and the remaining engineering curriculum for which possession of these skills is essential. Finally, it should be reemphasized that poor performance in and withdrawal from courses in technical fields of study are correlated to deficiencies in spatial visualization ability (Carter, et al., 1987; Pallrand & Seeber, 1984; Rochford, et al., 1989). This further highlights the importance of spatial visualization skills, particularly in engineering. Enhancing Visualization Skills Spatial visualization skills can be honed in various ways. The most common methods involve the presentation of a variety of different representations of objects. The simplest and oldest of these are concrete representations such as wooden blocks cut to a size and shape to be depicted graphically by the student. These are still in use in classrooms today. Stackable cubes were successfully used in a study concerning the effects of a remedial course on students with deficiencies in spatial visualization skills (Sorby & Baartmans, 1996). In this study, a pre-graphics course was developed and piloted in 1993 at the Michigan Technological University for the purpose of providing remedial experience in 3-D spatial visualization skills for students scoring low on a spatial visualization placement test. The new course utilized a text and computer lab manual, written for the course, and I-DEAS software as a visualization tool. Of 535 students who took the Purdue Spatial Visualization Test: Rotations (PSVT—R) placement test, 117 (22%) were women. Of the 96 students who failed (scored less than 60% correct) 46 31
(39.3%) were women. From the 96 students who failed, 24 were selected to participate in the pre-graphics course as members of the experimental group. The average PSVT—R score for this group was only 51% correct. Their average score on the PSVT—R as a post-test was 86% with no students failing. There was a statistically significant increase in scores between the pre- and post-test (t=12.53, p