Enhancing the Credibility of Wireless Network Simulations with Experiment Automation L. Felipe Perrone
Christopher J. Kenna
Bryan C. Ward
Department of Computer Science Bucknell University Lewisburg, PA 17837 Email:
[email protected]
Department of Computer Science College of William & Mary Williamsburg, VA 23185 Email:
[email protected]
Department of Computer Science Bucknell University Lewisburg, PA 17837 Email:
[email protected]
Abstract—The last few years have witnessed a growing consensus around the notion that many papers discussing wireless network simulation are plagued by issues that weaken their scientific value. A number of articles have shown evidence of this crisis of credibility and identified many of its causes. In this paper, we show that the methodology flaws in wireless network simulation can be avoided with the use of a framework for experiment automation. We describe the rationale that drove us to develop tools for component-based simulators intending to guide the experimental process from first to last stages. We conclude that a framework that imposes the right constraints on the experimenter can lead to more credible simulation studies. The framework we present helps the construction of consistent models, the definition of model parameters, the design and the execution of experiments, the analysis of output data, and the preparation of data for the dissemination of results that allow experiments to be reproduced.
I. I NTRODUCTION There has been a growing consensus in the wireless networking community that many of the simulation studies presented in the literature exhibit flaws that compromise the strength of their contributions. Several papers have exposed the fact that there exists a veritable crisis of credibility in this field of study [1]–[4]. These publications carry two central messages. First, we learn that even when they appear in the most selective conferences, simulation studies of wireless networks carry egregious errors in modeling and simulation methodologies. Second, we find evidence that often enough, even when best practices in the experimental work are followed, the publications presenting simulation studies do not contain enough detail for others to replicate them. Although the question of how we have reached this status quo bears consideration, we argue that it is not the most important. We believe that it is crucial at this juncture to develop solutions that help the users of simulation to avoid the mistakes that appear recurrently in the literature. Questions whose answers can turn the tide more directly are what these solutions might be and how easily they can be applied. This paper argues the case that the use of automation tools to guide the construction, the execution, and the analysis of This paper appears in the Proceedings o the First IEEE International Workshop on Selected topics in Mobile and Wireless Computing (STWiMob 2008). October, 2008. Avignon, France. Copyright 2008 IEEE.
results in simulation experimentation can improve the credibility of simulation studies of wireless networks. As long as these tools are implemented in accordance with the constraints dictated by well-establshed, sound methodologies, their use can leave no option to the user other than to “do the right thing.” The role of automation is paramount in this context. As the analysis of the literature has indicated, the user cannot be always trusted to carry out simulation studies with expertise and with rigor. In a case like this, automation can serve as a guide and as an enforcer of best practices. The solution we present here is a framework implemented as an interactive web-based application centered on a relational database. The role of the database is to accumulate and to record the relationships between pieces of information that define a simulation experiment, its inputs, and its output data. The role of the scripts is to standardize operational procedures in the simulation study and to constrain users’ actions to follow sound scientific methodologies. The scripts interact with the user to obtain information on the experimental setup, to construct the simulation model, to execute the experiment, and to process the output data in the database. An important property that results from the use of this framework is that experiment repeatability is guaranteed by the fact that detailed records of the process are always kept. The fact that these records exist, however, would be of no use if they couldn’t be easily shared with the audience of publications that disseminate the experiments. To address this issue, the framework we constructed is web-based: it makes all the data associated with experiments available on the World Wide Web. Publications based on a simulation study need only to refer their readers to a URL to grant them access to all the details that allow experiments to be replicated. The level of access in this case is read-only to avoid compromise of the integrity of the experimental set up and data by external observers. The user interface to the framework is a standard web browser, a feature that has important consequences. Just as the framework can be accessed for reading information about experiments, it can also be accessed for constructing experiments and controlling their execution. This architecture creates a client-server model that makes clients platform-independent while offering the power of dynamic, graphical user interfaces
(GUIs) that can be constructed with asynchronous Javascript and XML (AJAX) technologies. The characteristics of this framework led to an implementation in Ruby on Rails [5], a system which allowed us to complete, in short time, a proof of concept prototype without any sacrifice of functionality and with acceptable run time performance. The remainder of this paper is structured as follows. Section II establishes a context for our work and discusses tools that have influenced our design or that relate to our framework somehow. Section III presents the architecture of SWAN Tools, our web-based framework for experimentation. This section introduces the features of the framework that address problems of simulation credibility identified in the literature. Finally, Section IV concludes the paper. II. C ONTEXT AND R ELATED W ORK This work was motivated by the construction of a framework to automate the experimental process for the Simulator for Wireless Ad Hoc Networks (SWAN) [6], which is a componentbased simulator written in C++ and compliant with the SSF standard [7]. In this kind of simulator, the experimenter composes the simulation model using a collection of submodels drawn from a library. SWAN includes models for radio propagation, physical and MAC layers of IEEE 802.11b, node mobility, routing, traffic generation, and a few network attacks. It is important to note that although the implementation of SWAN Tools is directly tied to SWAN, the ideas behind it are transferable nearly directly to other SFF-compliant simulators and also to popular simulators such as ns-2 and GloMoSim, with some effort. Our experimental studies with SWAN have led to two important observations. First, unless a user is extremely organized and disciplined about recording and organizing input and output data, it is easy for one to end up with unrepeatable experiments. Second, small slips in output data processing methodology can invalidate an entire study. Both problems can be avoided with the systematic organization of input data and processing of simulations’ results. We can more easily trust a well-programmed computer to be systematic than a human experimenter. This conclusion led us to adopt the Scripts for Organizing ’Spiriments (SOS) [8], a powerful set of Perl scripts created to facilitate the experimental process with SSF simulators. To explain how SOS works, we must first expose a few details behind SSF. An SSF (or SWAN) simulation model is composed of sub-models woven together by a description written in the Domain Modeling Language (DML) [7]. The syntax of DML is such that a well-formed document consists of a list of DML expressions, where an expression is a pair. A key is simply a string and a value is either a string or a DML expression enclosed in square brackets. The code excerpt in Fig. 1 illustrates the syntax of valid DML expressions; a typical model in our experience contains a few hundred such lines of DML code. The work with SOS starts with the construction of a template DML file for the experiment. This file indicates the factors that will be manipulated in the experimental study.
terrain [ xdim 50 ydim 50 zdim 0 ] session [ name "app" use "test.sess-app-session" packet_size 512 session_length 500 iat_exponential 1.0 vbr true peer [ netid 1 hostid 2 iface 0 ]] Fig. 1.
Sample of DML code
According to the terminology defined in [9], which we use for the remainder of the paper, factors are the input parameters of a simulation model, levels are the values assigned to factors, and responses are the output measures produced in the execution of the experiment. For example, in Fig. 1, packet_size is a factor and 512 is the level assigned to it. (Note that this syntax provides no indication of the units associated with a level, what can lead to confusion in the construction and the interpretation of simulation scenarios.) A second file is constructed with the lists of levels that are assigned to each factor in the experimental study. Selecting exactly one level from each list of factors, we construct a complete set of assignments to factors, that is, an experimental design point. SOS includes a script that generates the total number of design points in a study by computing the crossproduct of the lists of levels. Another script invokes the underlying simulator to execute each design point multiple times, using a different seed for pseudo-random number generation each time. The output of each execution is processed by extractor scripts that use regular expression matching to select the samples of each response. Throughout this process, SOS uses a MySQL database to record information associating each design point to the responses produced as the results of each run. The structure of the database, which is defined when the experiment is created, takes into account all the factors and levels of the experiment determined by the user. The simulation runs are executed one by one and, as they complete, the extractor scripts sift through the output data inserting the sampled quantities into the database in association with the experiment’s identification. The database is the central component in SOS: it associates records of the inputs in an experiment to the output data generated by simulation. SOS is quite powerful, general, and elegant; a user can adapt it to a number of different circumstances after going through a learning curve. The customization, however, requires knowledge of Perl and of the MySQL query language, and more importantly allows plenty of room for less experienced users to make mistakes. We concluded that there was a need for a system that would offer functionality similar to SOS’s with improved usability. We took the main aspects of SOS’ design as starting points for SWAN Tools, but chose to develop our system around a simple user interface that requires of the user no knowledge of DML, of Perl, or of the MySQL query language, and which would additionally validate user input. We combined
this functionality with additional features that aim to help one create simulation studies that do not suffer from the credibility problems identified in [1]–[4]. Some of the features we implemented are present in related work discussed below. Hawick and James [10] discuss a framework for simulation data management that is built around operational patterns observed in the execution of simulation studies. The scope of their project includes the generation of experimental design points from lists of levels and the use of a database for archival of all simulation input and output. The framework requires the user interactions with the database to go through a programming interface, however. The same authors present a tool with an expanded scope in [11], which includes a GUI for experiment set up and the ability for the user to steer the simulation study by manually controlling the scheduling and the dispatching of runs. While the first of these additional features is important for enhancing the usability of the tool, the second makes exploratory simulation studies more efficient. The user can observe the results produced by recently completed jobs and directly manipulate the queue of pending jobs via insertion and removal so that the experimental process can focus on the most interesting areas of the parameter-space. The Akaroa2 suite [12] provides an important lead in the implementation of two key features that affect the credibility of simulations. The first is automatic estimation of the length of transients in the model, what allows for the deletion of data collected before the simulation has reached steady-state. The second is automatic determination of the simulation run length, what guarantees that enough samples of the metrics estimated are collected to yield correct coverage of the confidence intervals produced. The user only needs to specify the desired values of precision and confidence level for the system to determine the termination time of the simulation. These features are also present in the framework described in [13] together with additional functionality to facilitate the experimentation process with the ns-2 simulator. Upon close observation, it became apparent that tools such as those described in [8], [10]–[13] include features that can avoid some of the simulation pitfalls identified in [1]. We found no single tool that avoids all the pitfalls, however. We concluded that, ideally, a comprehensive automation tool would need to offer the following set of features: • Present a simple, usable interface to the system that allows one to define an experiment, control its execution, and access its results. The user would have to provide to the system with all the details of experimental set up before a simulation study could be carried out. These details should include the type of the simulation (terminating or steady-state), the complete set of design points in the experiment, and anything else that is required for one to be able to replicate the experiment. The system would automatically create and organize records of this information for posterior retrieval. Users other than the experimenters should have read-only access to the data associated with experiments, what would benefit the dissemination of the simulation studies.
Provide guidance to users in the design of experiments (DOE) by embodying well-established methodologies, such as 2k factorial design. This would be helpful in reducing the number of design points in experiments thereby reducing the overall compute time required. More importantly, the tool itself would be an incontrovertible record of the DOE methodology used that would be immediately available for use in publications describing the simulation studies. • Guarantee the statistical soundness of the simulation study. For steady-state simulations, this would involve the automatic determination of run length and the deletion of samples collected before the model reaches steady-state. The single data set problem would be avoided by simulating each design point multiple times using in each run different seeds for the pseudo-random number streams generated. The results of the independent runs should be stored in association with data on the experimental set up. The output data produced would be automatically processed by rigorous methods of output analysis that include the default generation of confidence intervals for a chosen level of confidence. • Generate plots from the recorded output data of experiments. The user would be asked to define what data series should appear in a plot, what legends to associate with each data series, and what labels and units to associate with each axis. The plots would include, by default, the point estimates for the data displayed, but also the associated confidence intervals. We conceived SWAN Tools to provide all these features. Our current implementation covers these requirements with the exception of steady-state detection and determination of the appropriate run length, which will be addressed in future work. •
III. T HE D ESIGN OF SWAN T OOLS As indicated in Section I, we found it important to build SWAN Tools as a web-based framework. The user interacts with the framework using a standard web browser rather than a native GUI. In the first dialog presented, the user finds instructions on how to proceed and five hyperlinks corresponding to the main components of the framework. The top row in Fig. 2 shows five components that can be accessed via a web-browser. What the user sees of these components are views, in the terminology of the model-view-controller (MVC) software engineering architectural pattern [5]. Each of these views offers the user access to different functionalities of the system, which are implemented by their associated controllers. What corresponds to the model in this system is the structure of the database that aggregates information about experiments, simulation models, their input parameters, and their output data. We describe each of these components in turn as follows. A. Experiment Configuration This component is used to define and to configure the single experiment with which to work for the duration of a session,
Experiment Configuration
Terrain
Fig. 2.
Model Specification
Node Deployment
Simulations
Results
Terrain
Radio Propagation Channel
Plotter
Model: Flat
Node Mobility
Node Application
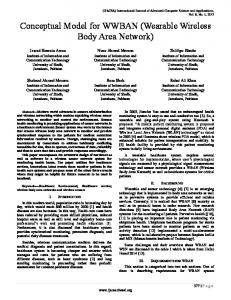
B. Model Specification The overarching goal of this component is the construction of the model that is used throughout the simulation study. Since SWAN is a component-based simulator, the user constructs a model by piecing together elements selected from a library of existing sub-models. Fig. 3 gives an example of
xdim
5,000 m
2.4 GHz
ydim
3,000 m
temperature
290 K
zdim
5.0 m
noise_figure
10.0 dB
boundary
wraparound
ambient_noise_factor
0
system_loss
1.0
Host 1 Host 1 Host 1 Wireless Node 1 Model: Host
Component architecture of SWAN Tools
what we refer to henceforth as active experiment. The user can choose to work with an experiment previously created (already present in the database) or to create a new experiment altogether. When the latter option is chosen, a new numerical experiment identification is generated and the database is initialized to receive all the data that will be associated with the experiment. For the sake of usability, the web interface requires the user to define a mnemonic to map to each numerical experiment id. The user also defines an integer seed value that is used to generate seeds for the various pseudorandom number streams used in the simulation, the number of simulation runs for each design point in the experiment, and the length of the transient period of the simulation. In order to avoid initialization bias, SWAN discards samples of metrics that are estimated during the transient. This component addresses an important issue that has been known to affect the credibility of published simulation studies: it establishes a clear match between an experiment and the code base of the simulator that is used to execute it. The user can select to associate the experiment with a version of the simulator that has been previously installed in the framework. Alternatively, the user can upload a compressed, archive file (that is, a tarball) containing the source code of a different version. SWAN Tools creates a unique identification for the new upload and then invokes the simulator’s build system to produce its executable. In order to avoid storing the entire compressed archive file in the database as a binary large object (know as blob), the framework stores instead only the path to where each version of the simulator resides in the file system. Finally, Experiment Configuration allows the user to edit configurations of experiments and to destroy an experiment, what removes from the database the associated model specifications and results for completed simulation runs. If a user ever tries to edit a configuration after the experiment has been started or concluded, the framework refuses to complete this action. This guarantees that the database never associates results with an incompatible experimental set up. The remaining components of the framework can only be accessed when the user has completed the experiment configuration.
Model: 2-ray ground reflection carrier_frequency
Model: Host Model: packet size Host 512 Model: packet size Host 512
bit rate model CBR 512 packet size bit rate model CBR 512 packet size bit rate bps bit rate model 3000CBR bit rate bps bit rate model 3000CBR protocol_graph wireless bit rate 3000 bps protocol_graph wireless bit rate 3000 bps protocol_graph wireless protocol_graph wireless
Fig. 3.
Mobility Model: Random waypoint min_speed
5.0 m/s
max_speed
10.0 m/s
pause_time
65 s
Node Deployment Model: Random
Example of model composition for a wireless network simulation
model composition. The simulation model is described in a DML file, which the user can compose using a standard text editor to instantiate and to configure each of the sub-models of interest. Although this degree of flexibility is positive, since the user has free rein to write DML code, the risk of introducing syntactic and semantic errors is non-negligible. While syntactic errors are exposed during the simulator’s execution, semantic errors may go uncaught and taint the result of the entire simulation study. We address both of these problems with a single solution. Rather than allow the user to build the model into a DML specification file without any constraints, we have the user interact with a component that automatically generates the specification file. The user is presented a series of dialogs (HTML forms) that require the assignment of levels to each of the factors in the sub-models that are used. Only when all sub-models have been initialized is the component ready to automatically generate a DML specification file. There are important benefits to this process. First, the automated generation guarantees the absence of syntax errors in the DML file. Second, since the user goes through this initialization under strict guidance, we can ensure that no factors are assigned default values and minimize the risk of semantic errors. If the user associates with each factor a level of the wrong data type, the framework indicates the error immediately. Additionally, the form that the user sees has each text entry box labeled with the units expected for the corresponding factor. The framework validates the inputs against expected ranges of values to guarantee that the simulator can run on them. There is no way, however, to make the process completely fool-proof: a careless user may ignore a label for bits per second, for example, and enter a value in bytes per second that passes validation checks. A different kind of semantic error that can be automatically identified results from mismatching components within a simulation model, as illustrated by the following cases. First, it is possible that different sub-models included in the same simulation model might interact in ways that undermine the credibility of the experimental results. Consider the relation-
ship between the initial deployment of wireless nodes in the simulation space and the spatial distribution of nodes that arises when the random waypoint mobility model reaches its steady-state. From [14], we learn that if nodes are deployed at random according to a triangular probability distribution, the transient in random waypoint is likely to be minimized. This knowledge of the interaction between models could be used to indicate the need for improvement in the scenario of in Fig. 3, where random waypoint mobility is used in conjunction with uniform node deployment. This exemplifies the case when submodels shouldn’t be used in the same composition. Second, consider the case when two sub-models must always be used in conjunction for the sake of the correctness of the simulation, but inadvertently an experimenter substitutes a wrong item for one of them. In SWAN, which uses standard interfaces between protocol layer models as does SSFNet [7], the error of pairing an IEEE 802.11b PHY layer model with an IEEE 802.11n MAC layer model might go unnoticed tainting the results of all experiments using the defective simulation model. One can avoid semantic errors of sub-model mismatch in a web-based framework like ours by exploiting a feature of AJAX: the list of sub-models visible to the user can change in response to each selection made. This could be used to guarantee that, at the end of the process, the model constructed includes only sub-models that are compatible with one another and to force the inclusion of sub-models that must be used together. This approach has the drawback that the knowledge of sub-model constraints must be built into the framework. Every change in the relationships between sub-models would require a corresponding change in the framework. Alternatively, one can require that every individual sub-model would carry with it meta-data that identifies their compatibility restrictions and/or inter-dependecies with other sub-models. The framework would then be able to invoke a component to verify the overall consistency of the simulation model by analysing the meta-data of all the sub-models included. This functionality, which is used in package managers for various operating systems and applications, can be excellent protection against consistency errors and yet allows for a decoupling between the framework and the collection of simulator submodels. At our current stage of development, SWAN Tools addresses issues of model composition in yet a third way: it prescribes a consistent model composition that can be configured but not changed. The only mutable aspects of the model are the factors of the sub-models that we chose to expose to the user. As Fig. 2 indicates, once the experimenter accesses the Model Specification component, the only sub-models visible are: • Terrain, which defines the geometry of the simulated space and requires factors specifying three dimensions and the type of boundaries (hard edges or toroidal.) • Node Deployment, which defines how wireless nodes are initially arranged in the simulation space. The user can choose between deterministic distributions (such as a regular grid arrangement) and stochastic distributions (such as uniform, triangular, and random clusters.)
Fig. 4. •
•
Screenshot of dialog for random waypoint model configuration
Node Mobility, which defines how wireless nodes move around the simulation space, if at all. Different models of mobility are available (such as brownian, random waypoint, and Gauss-Markov), each one requiring the configuration of their own specific set of factors. Node Application, which represents the model of the application layer protocol used in each wireless node. The most fundamental function of this sub-model is to generate traffic for the network and for this purpose, it offers constant and variable bit rate options. In order to enable our studies with attack models on wireless networks, which is described in [15], this sub-model defines the kind of attack used, the probability that a node is attacked, and start time of the attack among other factors.
Sub-models that don’t appear in the web interface are fixed and defined by what we call the schema for the simulation experiments. The factors associated with sub-models in the schema cannot be configured from the framework’s user interface. We argue that this apparent lack of ease of configuration actually works toward enhancing the robustness of the models constructed for experimentation by less experienced users. The expert can carefully construct schemas reflecting validated scenarios, submit it to verification tests, and only make it available for widespread use once it has met high standards. SWAN Tools enables sensitivity analysis studies. The factor configuration interface is dynamic: it only shows the user dialogs for factors in selected sub-models. Fig. 4 shows what the user would see after selecting random waypoint mobility. For each factor, the user enters a starting level, the increment between successive levels, and the number of levels with which to experiment. From this information, the framework generates the list of levels that will be used in experimentation. For instance, if factor pause time has starting level 60, increment 30, and 4 for number of levels, the framework generates experiments to explore the following list of pause times: {60, 90, 120, 150}. The framework can be configured to restrict
the number of levels per factor to exactly 2, what makes it work exclusively with with the 2k factorial design. Once all the factors of all the sub-models exposed are initialized, they are saved in the database and associated with the identification of the active experiment. Since the complete specification of the experiment is persistent, it can be retrieved at any time. The use of a database that stores the experiment’s specifications in association with the simulations results avoids mix ups and guarantees that the experiment is always reproducible.
Database Simulations
Configurations
Configurations
Results
Results
... Node 1 Fig. 5.
C. Simulations This component generates all the design points for an experiment, that is, all the possible combinations of assignments of levels to factors, using the information entered via the Model Specification component. With this component, the experimenter can read but not modify the data associated with each design point, that is, the level assigned to each factor, and the corresponding DML file. If the experimenter ever needs to replicate a simulation run outside SWAN Tools, this DML file can be easily downloaded. The information is broken across a number of pages that can be navigated with the web browser so that the experimenter can verify the specific scenario for each experimental design point. This component also allows the experimenter to initiate the execution of simulations. The simulation runs can execute in a single compute server or can be dispatched to execute in parallel across a collection of compute servers. The parallelism exploited by this component doesn’t come from partitioning a single simulation into different pieces for concurrent execution. Instead, we follow the multiple replications in parallel (MRIP) approach used in Akaroa2 [12], that is, SWAN Tools dispatches independent simulations runs to different processors. This approach does not require the partitioning and the synchronization of the components of the simulation model. At the same time, it allows for faster completion of the overall experiment. We implemented MRIP using Distributed Ruby (DRb), a distributed object system for the Ruby language, created by Masatoshi Seki. SWAN Tools offers the experimenter a simple button to start the execution; once this button is pressed, the framework spawns a background process that creates and manages a queue of simulations to execute on a set of client processors. The architecture of this mechanism is illustrated in Fig. 5. Each of the client nodes runs a process that waits for a start signal which causes it to send to the server a request for the download of the version of the simulator associated with the experiment. Once the download completes, the client unpacks and builds the simulator, and then sends the server a request for the specifications of a simulation to run. The request is answered with a DML configuration file, which the client uses for a simulation run. Upon completion of its run, the client sends to the server the data extracted from the simulation’s results together with the matching experiment id. The server receives this information and stores it in the
DRb Experiment Server
Node N Simulation dispatcher architecture
database guaranteeing the accurate matching of a simulation run to its results and configuration. D. Results As simulation runs complete, their results are processed by extractors, as in SOS [8], to yield samples of the quantities that the experimenter wants to estimate. This SWAN Tools’ component displays the samples produced by each run. This functionality allows the experimenter to browse the database for results associated with the identification of the active experiment. Arguably, the most important feature that this component offers is the wide accessibility to the complete set of experimental data. Due to space constraints, published work might not be able to contain all the details of an experiment’s scenarios and results, but it could always list a URL where the framework resides. Readers are able to access the database through the web interface and obtain all that is necessary for reproducing the stored experiments, that is, the model specification data and also the source code of the version of the simulator that was used. The web interface of this component displays the raw data extracted from each simulation run, without any grouping and without the computation of statistics across different runs. The information appears as a table in which each line contains the extracted estimates of a run organized into columns for metrics such as packet delivery ratio, average packet endto-end delay, and the number of packets generated by the routing protocol. Each row in this table carries a hyperlink to a page that displays the levels associated to each factor in the corresponding simulation run. The experimenter can optionally download all results as a comma-separated-value (CSV) file, which is particularly useful for processing by standard spreadsheet applications. The volume of data that can be generated by an exploratory experimental study containing many thousands of simulation runs can be overwhelming to the user. Although our current implementation of this component provides for quick access to the body of data generated by simulations, it can be made more usable and useful. One way to achieve these goals would be to process the data and present it in a hierarchical organization that shows statistics of results that reflect the structure of parametric sensitivity analysis. The framework would automatically issue database queries to extract results
fixing or varying input parameters (factors of the experiments) selected by the user through a graphical interface. The information retrieved could be organized across a set of HTML documents hyperlinked to one another according to a sensible, navigable structure. A second alternative would be to provide the user with graphical aids to construct read-only, custom queries to the database; the resulting data would be processed by statistical methods before being sent back to the web browser. The most powerful (and dangerous) alternative is to grant the user direct access to the results in the database permitting customized queries from external applications, or interactively from a MySQL client or a browser-based tool like phpMyAdmin (). Although the user would have full control over queries and the processing of their results, it is always possible that without protective constraints one might retrieve data that does not correspond to an experiment of interest or yet end up corrupting stored results. E. Plotter Once the experimental results have been accumulated and organized into the relational database, it is common for one to generate custom plots to visualize how a certain estimate produced by simulation behaves as another quantity is varied. The Plotter component in SWAN Tools automates the process of creating plots both for quick inspection via the web browser and for posterior use in the preparation of documents for scientific dissemination. The user selects independent and dependent variables to display on x− and y − axes using the graphical interface and enters a chosen value of confidence level. Plotter issues one or more database queries, retrieves the results, computes statistics, and produces plots with confidence intervals. The resulting plots are displayed in the web browser as portable network graphic objects (PNG) and can be optionally downloaded in portable document format (PDF). It should be noted that Results and Plotter automate the processing of simulation output data using sound statistic techniques and leaving the user no room for errors by carelessness or by omission. IV. C ONCLUSIONS In this paper, we present the design of SWAN Tools, a webbased framework for automating simulation experiments. The main goal of this framework is to provide a high level of guidance to its users in the construction, execution, and output data analysis of simulation studies of wireless networks. The framework constrains the user to follow methodologies that produce credible and repeatable results addressing the “need for simulation study guidance” identified in the final remarks of [1]. Although the design we present is more applicable to SSF-based simulators, our main contribution are ideas that can be transfered to different simulation platforms. SWAN Tools imposes a fairly sequential process on the experimenter that starts with the detailed definition of the experimental setup and the simulation model. It only allows the execution of simulation runs after this body of data has
been collected from the user and recorded in a persistent database. The framework executes the experiment, possibly using a collection of processors to run multiple replications of the simulations in parallel. The output data of the runs are inserted in the database in association with the experimental set up and simulation model configuration parameters. The framework provides infrastructure for that statistical analysis of output data including functionality to create custom plots that include, by default, confidence intervals of the quantities estimated by simulation. Future enhancements planned for this framework include the automatic detection of steady-state and determination of run length in non-terminating simulations. The architecture of the framework lends itself naturally to this extension. The current implementation of SWAN Tools allows for reproducible experimental studies by providing access (direct or remote) to full details of experimental set ups and their corresponding output data. SWAN Tools is publicly available at . R EFERENCES [1] T. Camp, S. Kurkowski, and M. Colagrosso, “MANET simulation studies: the incredibles,” SIGMOBILE Mob. Comput. Commun. Rev., vol. 9, no. 4, pp. 50–61, 2005. [2] K. Pawlikowski, H. J. Jeong, and J. R. Lee, “On credibility of simulation studies of telecommunication networks,” IEEE Communications Magazine, vol. 40, January 2002. [3] K. Pawlikowski, “Do not trust all simulation studies of telecommunication networks,” in International Conference on Information Networking (ICOIN 2003), Jeju Island, Korea, February 2003. [4] L. F. Perrone, Y. Yuan, and D. M. Nicol, “Modeling and simulation best practices for wireless ad hoc networks,” in Proceedings of the 2003 Winter Simulation Conference. IEEE, 2003, pp. 685–693. [5] D. Thomas and D. H. Hansson, Agile Web Development with Rails, 2nd ed. The Pragmatic Programmers, 2007. [6] J. Liu, L. F. Perrone, D. M. Nicol, C. Elliott, and D. Pearson, “Simulation modeling of large-scale ad-hoc sensor networks,” in Proceedings of the European Simulation Interoperability Workshop 2001 (EURO SIW 2001), University of Westminter, London, UK, June 2001. [7] J. Cowie, A. Ogielski, and D. Nicol, “The SSFNet network simulator,” 2002, available via [accessed March 22, 2008]. [8] T. G. Griffin, S. Petrovic, A. Poplawski, and B. J. Premore, “SOS: Scripts for Organizing ’Speriments,” 2002, available via . [Accessed March 22, 2008]. [9] A. M. Law, Simulation Modeling and Analysis, 4th ed. McGraw-Hill, 2007. [10] K. Hawick and H. James, “Distributed scientific simulation data management,” Institute of Information and Mathematical Sciences, Masses University - Albany, Auckland, New Zealand, Tech. Rep. No. CSTN008, 2004. [11] H. A. James, K. A. Hawick, and C. J. Scogings, “User-friendly scheduling tools for large-scale simulation experiments,” in Proceedings of the 2007 Winter Simulation Conference. IEEE, 2007, pp. 610–616. [12] K. Pawlikowski, “Towards credible and fast quantitative stochastic simulation,” in Proceedings of the International Conference on Design, Analysis and Simulation of Distributed Systems (DASD ’04), Orlando, FL, USA, March 2003. [13] C. Cicconetti, E. Mingozzi, and G. Stea, “An integrated framework for enabling effective data collection and statistical analysis with ns-2,” in Proceedings from the 2006 Workshop on ns-2, Pisa, Italy, October 2006. [14] T. Camp, J. Boleng, and V. Davies, “A survey of mobility models for ad hoc network research,” Wireless Communications & Mobile Computing– Special Issue on Mobile Ad Hoc Networking: Research, Trends and Applications, vol. 2, no. 5, pp. 483–502, 2002. [15] L. F. Perrone and S. C. Nelson, “A study of on-off attack models for wireless ad hoc networks,” in First International Workshop on OperatorAssisted (Wireless Mesh) Community Networks (OpComm 2006), Berlin, Germany, September 2006.