Proceedings of the 2nd International Conference of Teaching and Learning (ICTL 2009) INTI University College, Malaysia
ENHANCING THE RESEARCH ENVIRONMENT USING SIMPLE PORTABLE ELECTRONIC SENSORS Wong Ling Shing1 and Betty Voon Wan Niu2 1
INTI University College, Malaysia (
[email protected]) 2 Universiti Tenaga Nasional, Malaysia
ABSTRACT Research is an important teaching and learning activity, which catalyses dynamic and high competitive education institutes, especially the higher education institutes. The curiosity and the research interest among the students can be magnified through research activity. However, researches in science fields usually highly depend on the research equipment and facilities, which are linked to the high set-up cost, high expertise, and complicated operation. Furthermore, most of the equipment is not portable. All these constraints make personal, small-scaled, or even off-campus researches among the students almost impossible. The usage of simple and portable electronic sensors can elevate the research interest by allowing students to conduct their own personal and simple science research experiments, inside and outside the lab. The wide variation of sensors with low setup cost and simple operation might be the way to enhance the research environment in education institutes. The example of the sensors used in this paper is a graphing calculator based electronic sensors.
INTRODUCTION Research is very important and serves as the fundamental of science knowledge, especially in higher educational institutes as research contributes to the continuous growth of originality and creative thoughts, as well as the interest in new findings (Wilson, 1990). Research can be defined as an organized and systematic way of finding answers to the questions (Crotty, 1998). Students can enhance their knowledge, creativity, interpretation skills, problem identification skills, cost estimation, time management and even moral values though research activities (Wilson, 1990). While students can gain skills and knowledge in solving problems through research, some of the scientists gain greatness through choosing the problem to solve. Besides, research activity is extremely important for preparing the students for good standard of living in their future (Shavelson & Towne, 2002). As more and more studies showed the positive correlations between research activity to the teaching and learning activity, the enhancement of research environment in higher education is essential (Clark, 1997; Ramsden & Moses, 1992; Neumann, 1992). However, science research in higher educational institutes nowadays is cost consuming. Wilson (1990) stated that the cost is an issue in science research, which the research should be carried out with most cost effective method. However, a good research in science nowadays is always linked to high cost and sophisticated labs and machines, which turns up to be an unbearable burden to some of the higher educational institutes. The issue turns up to be more complicated when a short research with small grant, requires a high cost and not sharable equipment.
1
The introduction of simple and portable electronic sensors might be able to fill the shortage of research in some of the higher educational institutes, not only in exploring new knowledge in sciences, as well as giving students more hands-on experiences by conducting small scale of research and projects. Exposing students to more hands-on will definitely increase their performance in their study (Lowery, 2003; Stohr-Hunt, 1998; Clark, 1997). The electronic sensors introduced here have wide variation of detection parameters with low set-up cost and simple operation, which might be the way to enhance the research environment in education institutes (Fourier, 2006). In this paper, the sensors which could be integrated with graphing calculator were studied for their performance.
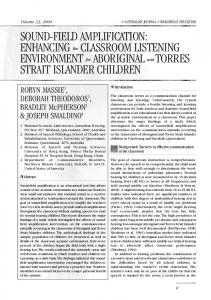
ELECTRONIC SENSOR DESIGN AND OPERATION The electronic sensor has three main components, namely HP graphing calculator, HP StreamSmart 400 data streamer (serves as adapter), and Fourier sensors. The sensors are the main component for the detection of favoured parameters, the adapter digitalised the analogue data, and the graphing calculator, serves as the interpreter, which transforms the digital data into human interface formats (Figure 1). The sensors are simple to set-up and easy to operate. First, plug one of the sensors chosen to the adapter and then, plug the graphing calculator to another end of the adapter. Turn on the graphing calculator, go to “Aplet” menu and choose “Stream Smart” application. The sensor will be automatically detected by the application, and the data acquired will be displayed. The adapter can support up to four different sensors and take four different sets of reading simultaneously.
b
a
c
d
Figure 1. (a) Complete set of electronic sensor, adaptor, and graphing calculator. (b) Humidity sensor. (c) Adaptor which can support up to four sensors simultaneously. (d) HP graphing calculator.
2
RESULTS AND DISCUSSION Electronic sensors for relative humidity, RH (%), temperature (˚C), pH and light intensity (lux) were tested for their performance. Relative humidity and temperature sensors were used simultaneously to detect both parameters inside and outside a house in Kajang area. From the data collected within 7 days, the humidity and temperature inside the house was higher, while overall temperature showed an opposite trend with humidity (Figure 2). Electronic sensor for pH was tested for the acidity of fruits, by mixing a fixed amount of crushed fruits with distilled water. The result is shown in Figure 3, with kiwi had the lowest pH and star fruit had the highest pH. Light intensity was measured in a hostel room from 9 a.m. till 8 p.m. and the result is shown in Figure 4. Highest intensity and lowest intensity were 150.73 lux and 4.12 lux, which were measured at 12 p.m. and 7 p.m. respectively. For all the four sensors tested, the respond time were less than 10 seconds, and the results can be shown in numerical or graph forms, with the reading for single and continuous exposures could be taken, and stored in table form in graphing calculator (Figure 5). Besides the four electronic sensors mentioned above, there are other individual sensors that can be used for the detection of gases (such as CO2 and O2), humidity, wind speed, and chemical concentrations (Na+, Ca2+, Cl, and NO2) for chemistry, biology, and environmental science, as well as distance, force, frequency, acceleration, light, conductivity, current, voltage, and charge for physics (Fourier, 2006). Besides, the sensors measuring heart rate, pH, colour absorption, and radioactivity are also available. All the sensors can work individually or coupled with the other sensors (up to four sensors). Most of the detections of used are electronically calibrated, hence required minimum maintenance. This graphing calculator is widely used by college students (personal computer or laptop can be used as substitution) with its electronic sensors has the following advantages: low set-up cost, wide range of sensing parameters, user-friendly (plug and play), low maintenance, and high portability.
Figure 2. Trends for temperature (˚C) and relative humidity (%) for 7 continuous days, detected using temperature and humidity sensors simultaneously. 3
Figure 3. pH values for different fruits.
Figure 4. Light intensity in different time.
4
a
Figure 5. b
c
(a) Graph form of result showed the changes in RH (%) in 30 seconds. (b) Numerical form of result showed the RH (%) of that particular moment. (c) The reading for continuous exposure of the sensor can be recorded and showed in table form.
CONCLUSION With these electronic sensors, research environment in the higher education institutes can be enhanced as every student can conduct their own research, inside or outside the campus.
REFERENCES Clark, B.R., 1997. The modern integration of research activities with teaching and learning. Journal of Higher Education, 68:241-255. Crotty, M., 1998. The foundations of Social Research: Meaning and perspective in the research process. MIT Press. Fourier, 2006. Fourier systems data logging solutions. Fourier System Ltd. Lowery, L.F., 2003. Research on hands-on programs. www.fossworks.com/pdfs/HandsOnScienceResearch.pdf. Neumann, R. 1993. Research and scholarship: perceptions of senior academic administrators. Higher Education, 25: 97-109. Ramsden, P. & Moses, I., 1992, Associations between research and teaching in Australian higher education. Higher Education, 23:273–295. Shavelson R.J. & Towne, L, 2002. Scientific research in education. National Academies Press. Stohr-Hunt, P.M., 1996. An analysis of frequency of hands-on experience and science achievement. Journal of Research in Science Teaching, 33:101-109. Wilson Jr., E.B., 1990. An introduction to scientific research. Dover Publications.
5