Enhancing Web Based Farm Management Software Through The Use of Visualisation Technologies Pettit, C.J.1, I.D. Bishop2, W.E. Cartwright3, G. Park4 and O. Kemp1 1
2
Department of Primary Industries, PIRVic, Victoria Department of Geomatics, The University of Melbourne, Victoria and CRC for Spatial Information 3 School of Mathematical and Geospatial Sciences, RMIT University, Victoria 4 Biodiversity Research & Development, North Central CMA, Victoria Email:
[email protected]
Keywords: EMS, eFarmer, Google Earth, Gaming Engines EXTENDED ABSTRACT To maximise productivity of agricultural land and minimise adverse impact on natural resource assets and social well-being, both farmers and catchment mangers alike can benefit from greater access to spatial data and models. Being able to scale information up from farm to catchment is potentially a powerful technique in measuring how a catchment is performing against regional catchment targets using near real time data. Likewise it is extremely useful for farmers to be able to overlay a range of spatial information layers and modelling outputs in order to make informed on-farm decisions.
action plan include seeding, replanting native vegetation and creating a new timber reserve. Therefore a number of tree models have been created in Sketchup and 3D Studio Max and imported into Google Earth and SIEVE respectively. In this paper we broadly address the following research questions: 1.
2. There are a range of farm management systems and spatial technologies to assist farmers in making better land use decisions. In our paper we provide a concise review of some of the GIS based farm management systems available to assist farmers and land managers in achieving ‘best practice’ agricultural outcomes. Next, we describe the development and application of the online farm management and catchment planning prototype tool known as eFarmer. The eFarmer tool has been developed using an online GIS platform where a number of spatial data layers can be viewed and farm action plans entered. Within the eFarmer product, data and model output is viewable in a traditional 2D GIS format. In our research we trial the use of more advanced visual interfaces, such as Google Earth and the SIEVE (Spatial Information Exploration and Visualisation Environment) gaming engine product, for displaying and navigating farm to catchment information made available through eFarmer. This has been achieved via exporting a Farm Action Plan from eFarmer for a particular property in the Bet Bet subcatchment and importing this data into Google Earth and the SIEVE collaborative virtual environment. The various components of the farm
1280
What are the state-of-the-art spatial tools that can assist farmers and land managers in making better land use decisions? How can land information be displayed through 3D visualisation to enable farmers and land managers to make better, collaborative decisions?
It is believed that visualisation technologies such as Google Earth and SEIVE, which support Web 2.0 collaboration, will result in more informed land use decision-making. This will ultimately lead to more sustainable land use practices to ensure intergenerational wealth of farm land and better protection of natural resource environments. In future work we will endeavour to test the effectiveness of providing farmers and land managers with spatial information in a 3D format and undertake a usability assessment of the eFarmer farm management software.
2.1. 1.
INTRODUCTION
In this research we endeavour to contribute towards a better understanding of how spatial technologies such as GIS and visualisation tools can be used to make more informed and sustainable farm and catchment management decisions. We begin by providing a review of the state-ofthe-art spatial tools currently available to assist farmers in both day to day and long term farm management. Next we demonstrate how land information can be represented through the use of visualisation tools to ultimately allow farmers and land managers to make better, collaborative land use decisions. The visualisation tools deployed include the Google Earth digital globe product and the SIEVE collaborative virtual environment.
2.
BACKGROUND
Farm management software packages are designed to improve the day to day business and efficiency of a farm. More recently such software packages have been seen as a tool to also assist land managers in monitoring and improving catchment condition. This is made possible if farm action plans created by farmers can be uploaded into a central data repository and collated with other farm action plans. Through the use of technologies such as GIS, catchment managers can then analyse collected information from multiple farms to see how current catchment condition targets pertaining to biodiversity, salinity etc…. are progressing. The interest of land managers to directly access farm action plans to better inform catchment management practices is related to the concept of Environment Management Systems (EMS). An EMS can be defined as a voluntary, continuous process that can be applied to a business (such as a farm) to assess, monitor and improve environmental management (Carruthers and Murray, 1999). The next section of the paper provides a concise review of farm management tools, resulting from a comprehensive desktop analysis.
1281
Review of farm management software
Cartwright (2007) reviewed products and technologies that have potential application at the farm and larger scales. Over 400 websites were identified as portals to possible farm management software applications. It was found that the products fell into two categories: general Geographic Information Systems (GIS) / Remote Sensing packages and ‘customised’ farm/agricultural systems. Some of the customised systems were independent of GIS platforms and others were bundled with other products and exchanged data with them. The software is being used for analysis, farm operation support (office and field) and for providing access to expert information. A number of these ‘customised’ farm/agricultural systems are introduced below. Fieldstar – a positioning/mapping/data logging software package from AGCO Global Technologies (www.soilteq.com). It incorporates GPS and GIS to facilitate variable rate product application equipment and automatic yield logging. SGIS Agronomy – also from AGCO Global Technologies (www.soilteq.com). It is a GISbased, agricultural data management program. It supports crop and land management decisions. SSToolkit – a GIS package for mapping, area calculation, site-specific data organisation and yield data computations. It generates fertility recommendation maps, weed scouting reports and maps. (http://www.sstsoftware.com/) Farm Site – a mapping and layering software package for farmers. Farm Site generates map layers for yield mapping, application logs, soil types, soil sample results, tile lines, etc. (www.farmworks.com) LandView DSS Pro© – a Crop Production Management and Site Specific Precision Farming Decision Support System. It has a full-featured crop production record keeping and precision farming decision support system. (www.landview.com) Pastures from Space – Uses remote sensing to provide estimates of pasture production during the growing season. Satellite data is analysed to accurately and quantitatively estimate Pasture Biomass or Feed On Offer (FOO) or, combined with climate and soil data is used to produce Pasture Growth Rate (PGR) estimates. (http://www.pasturesfromspace.csiro.au/)
APSIM – simulates biophysical processes in farming systems, particularly as it relates to the economic and ecological outcomes of management practices in the face of climate risk. It was developed by the CSIRO Agricultural Production Systems Research Unit. (http://www.apsim.info) WebFRIS Enterprise™ GIS (http://www.jws.com) – a “web-based, enterprise solution for the management of forest resource information. Scenario Planning & Investment Framework Tool (SPIF) – Is a spatial decision support system for assisting managers and investors in targeting where to establish new forests. It can also be used to predict and assess the commercial and environmental outcomes from project proposals. SPIF is a software tool developed by ENSIS (http://www.csiro.au/org/psq3.html)
None of these packages enable direct farm to catchment scaling of information and subsequent reporting against catchment targets. Also none are currently 3D enabled. The next section will discuss a prototype tool, eFarmer that can report farm action plans back to land managers. We then present results of some preliminary research in extending the viewing functionality of eFarmer through the use of 3D visualisation software 2.2.
eFarmer
eFarmer is a prototype web-based farm and catchment spatial information management tool encompassing elements of an EMS. eFarmer is based on a GIS. The tool was trialled with landholders and their associated extension facilitators in Victoria, with the aim to evaluate whether extension officers and landholders found eFarmer a useful and useable product to support land management. This information was then used as a basis to assess whether further development of such an approach was warranted. eFarmer was developed to be compatible with an EMS, having the ability to assess impacts of paddock scale actions within an ‘action plan’, support on-farm monitoring and have the ability to record paddock inputs. These were seen as important functional requirements of the tool for compatibility with EMS. The level of EMS within eFarmer was likened to a ‘Stage 2’ EMS (see Seymour et al. 2007 for further description of EMS). Paddock inputs, production data, soil test data and crop types were included as textual ‘dropdown’ menus, as were land cover classes, describing types of cover over different areas of the farm based on vegetation attributes (native and
1282
non-native). Catchment targets for native vegetation and perenniality assessment for each catchment area involved in the prototype were included. Spatial data was categorised into farm specific information, administrative layers, infrastructure references, natural resource management (NRM) resources, imagery, weather data and time series images. Property and cadastral boundaries from the Vicmap Property Database with positional accuracy of 1:25,000 and better were included both for viewing but also to be copied to create farm boundaries. Vegetation layers included the Ecological Vegetation Classes (EVC) modelled to represent pre-settlement conditions (pre 1750EVC) and Bioregional conservation status (EVC BCS100). Imagery incorporated into eFarmer included aerial photography covering each subcatchment with satellite imagery (SPOT 5) for some landscapes. Satellite imagery for the extent of Victoria was the 1993 LANDSAT image for use at 1:500 000. This was sourced from LANDSAT Thematic Mapper satellite data supplied through the Australian Centre for Remote Sensing (ACRES). The imagery was produced by resampling TM100 and projecting it into a VICMAP projection. The re-sampled pixel size was 90 meters. Map generation and printing was achieved with the capacity to export to a PDF file and present the image in a standard map template and the ability to export polygons to shapefiles. eFarmer enables exportable shapefiles to be manually imported into farm management software and catchment modelling packages, providing input data to various models. Catchment managers were able to enter targets at the sub-catchment level and to review reports of individual landholder targets measured against these sub-catchment targets. Farmers were able to draw the features of their farms such as the property boundary, paddocks and land cover details – both what is there presently and what their target for land cover would be. Various tools were included to move around the map, measure distance and area and to query various features shown on the map. 2.3.
eFarmer evaluation results
During July to November 2006, eFarmer was tested and evaluated with groups of landholders in the North East (Corryong and Tallangatta area), North Central (mostly in the Avon Richardson catchment), Goulburn Broken (South West Goulburn/Broadford) and West Gippsland (Powlett Catchment) regions of Victoria. The functionality of eFarmer was deliberately limited
to a subset of potential datasets and applications (perenniality, biodiversity and riparian targets). Five extension staff/facilitators covering 4 participating CMA regions (North East, North Central, Goulburn Broken and West Gippsland) were trained in the use of eFarmer via a one day course run by the prototype developer (Spatial Vision). They were offered support after the training and then encouraged to spend some time becoming familiar with navigating around the program. A project officer (Olivia Kemp) and project leader (Geoff Park) offered on-going support and guidance. On a number of occasions, an ‘extra helper’ attended the eFarmer training sessions with landholders to offer a better ratio of facilitators to participants. A number of these extension staff had involvement by providing input to the development of the prototype during 2005. Flexibility in delivery and fitting in with local needs in each region was important for eFarmer testing. Each region’s facilitator had a slightly different background and operated from different institutional settings Extension staff were from DPI, Landcare and a CMA. The application was evaluated against criteria of usefulness and useability, with conclusions drawn about its potential for future development. The main findings from the evaluation were: • •
•
•
• •
•
•
eFarmer was found to be a useable tool after initial guidance, training and followup support. There are significant private benefits to landholders from eFarmer and it appeals to both commercial and lifestyle farmers across a range of landscapes. Small groups of landholders (up to 6 per group) with follow up one-to-one learning is the most sensible way to deliver eFarmer training. Provision of a web-based application is currently realistic in rural Victoria (even without future advances in broadband technology). eFarmer has the potential to be a very useful tool for extension officers. Statewide application would allow all extension operators (Department of Primary Industries (DPI), Landcare, CMA, private providers) equitable and immediate access to spatial information. eFarmer has potential to increase capture of on-ground activity (public and privately funded) leading to improvements in catchment condition. Linking eFarmer to catchment targets is functionally simple and has potential to allow informed dialogue between CMAs
1283
• •
and landholders about the progress towards, and usefulness of, catchment targets. There are a number of improvements that could be made to improve useability Feedback from eFarmer users (farmers, extension staff and catchment planners) provides insights for consideration of future development pathways.
In summary the eFarmer pilot has been successful and there appears to be sufficient private benefit for participating landholders. There is a case for future investment into development, as well as consideration of the skills/training and extension programs that are needed to deliver integrated natural resource management information. The case can be developed on the basis of public benefits, as well as other criteria used to guide the investment of public money. The next section of our paper, examines potential technological enhancements to the existing eFarmer through the use of 3D visualisation software. 3.
3D VISUALISATION AND EFARMER
There is a significant body of research in the development and application of 3D visualisation technologies for visualising landscape form, function and process, for example, Lovett et al. (2002) and Bishop & Lange, (2005). However, the results from our literature review on farm management systems reveal there is a paucity of systems which currently deploy a 3D visual interface. Thus, an important additional feature of our research is the capacity for users to see their future land uses or action plans as they will appear in the landscape. A capacity for effective visualisation is important to many land managers who may have difficulty understanding the full implications of their scenarios in map form. There are a number of ways in which moving from 2D mapping to 3D forms of visualisation can assist with interpretation and communication. These include: draping of thematic data over the terrain, realistic incorporation of surface objects (built structures, trees and other vegetation, power or water infrastructure, fencing etc), inclusion of subsurface information (soil profiles, water-table location). We have implemented some of these options in both Google Earth’s Earth Browser and in a game engine based collaborative virtual environment (SIEVE).
3.1.
Google Earth Visualisation
3.2.
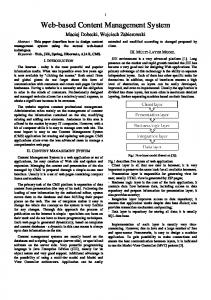
Google Earth is Earth browser software , which is freely available http://earth.google.com/. Users can view satellite imagery, spatial data layers, add placemarks, lines, polygons, image overlays, and 3D models. Keyhole Markup Language (KML) file format is used to store and display geographic data. KML in an open XML standard, which uses a tag-based structure with nested elements and attributes. KMZ is the file format comprising zipped KML files. eFarmer geographic data for the Bet Bet subcatchment in Victoria have been translated from Shapefile format into KMZ file format so that the results of farm action management plans can be viewed in Google Earth – see Figure 1. Google Sketch-up has been used to create 3D objects, in this instance tree objects to populate the study area – see Figure 2.
Figure 1. Google Earth representation of Farm Action Plan. Timber crop planting in the foreground, with native seeds, and woodland replanting in the background.
SIEVE Visualisation
SIEVE (Spatial Information Exploration and Visualisation Environment) is a development of the CRC for Spatial Information. The suite of software includes: a virtual world builder which is an ArcGIS based program for automating the creation of virtual landscapes; a viewer built from the Torque game engine (TGE) for exploring and collaborating in the virtual landscape, and a facility called SIEVE Direct for live linkage of ArcGIS to the viewer for exchange of viewer positions and objects, with their density or scaling, between the 2D and 3D environments (Stock et al, in press). Since EFarmer exports shape files which are native to ArcGIS, the process of populating polygons created in EFarmer and showing these in the SIEVE viewer is straightforward (Figure 3a & 3b). While filling the polygons with trees, shrubs, grasses or livestock is simple enough, specification of the appropriate surface objects is non-trivial. The simplest option is to have a single species associate with each candidate land use. Thus, for example, ‘tree crop’ might be represented by blue gum (Eucalyptus globulus) in all parts of Victoria. However, this would not be realistic as in higher altitude areas the typical plantation hardwood is shining gum (Eucalyptus nitens). Visualisation which inserts the wrong species will not be as impressive, trustworthy or effective to the knowledgeable end user. Therefore the species allocation system needs intelligence about what individual or group of species is appropriate to each target land use under different ambient environmental conditions (e.g. altitude, rainfall). These may be clustered into regional definitions. In addition to species variations there may also be difference in growth rate or growth form according to the underlying biophysical conditions or growth regimes.
Figure 2. ‘X-billboarded’ 3D model created in Google Sketchup Preliminary results look promising in that we have been able to successfully import a number the eFarmer geographical datasets including numerous point objects and associated 3D objects to represent revegetation and new plantations. In ongoing research we are developing an ArcGIS Google Earth extension to automate the translation process.
1284
Figure 3a. ArcGIS view of eFarmer generated polygons in NE Victoria
version of the SIEVE builder will work directly from the Oracle data base. 4.
CONCLUSIONS
In this paper we have endeavoured to broadly address the following research questions: 1.
2.
Figure 3b. SIEVE view of area with objects (wind turbines) and polygon-fill objects (hardwood plantation created from GIS The next challenge is then to link the land use representation to modelled outcomes as required by farmers or catchment managers. We have worked with the outputs of the Catchment Analysis Tool (CAT) hydrological model to create sub-surface objects based on data such as depth to water table and water salinity level. We have then implemented within the SIEVE viewer a facility to clip the foreground to allow concurrent viewing of a surface scenario and the consequent subsurface effects (Figure 4). We have also developed iconic billboards which can be used to fill polygons and to indicate the non-visual impacts of certain decisions. These billboards may be varied in density or scaling to represent different levels of economic return, run-off levels, labour requirements or modelled erosion risks. The other key advantage of SIEVE is that it may be used by an individual or as a collaborative consultation and decision space. Thus, it forms an immediate and compelling virtual environment for web-based communication between farmers, catchment managers and higher level policy makers.
What we have found is there are a number of spatial enabled stand alone and web delivered tools available to assist farmers and land manager in making better land use decisions. These tools have been developed using standard 2D spatial viewer technology. We believe there is an opportunity to delivered enhanced communication of farm information to farmers and land managers through the application of 3D visualisation technology, such as digital globes and game engine technology. Through using farm management data generated through the eFarmer product we have successfully demonstrated the display of farm action plans through using Google Earth and the SIEVE gaming engine 3D visualisation technology platforms. In this paper we have presented the results of some preliminary research which we believe paves the way for further investigation and exploration in making farm management systems more accessible, useable and collaborative through the use of online, interactive 3D visualisation technologies 5.
Figure 4. The water-table as it might be effected by a specific catchment development scenario The current linkage between EFarmer and SIEVE is based on data transfer via Shapefiles. eFarmer is however developed using Oracle as the underlying data manager and our intention is that a new
1285
What are the state-of-the-art spatial tools that can assist farmers and land managers in making better land use decisions? How can land information be displayed through 3D visualisation to enable farmers and land managers to make better, collaborative decisions?
FUTURE WORK
One of the challenges for future research is to overcome the fear of ‘regulatory creep’ and the suspicion of the true intent of farm management systems. In a survey of 213 farmers, catchment managers and government agency staff interviewed on the adoption of EMS (Seymour, 2007) such threats have been highlighted. Such a system needs to be easy to use and the results simple to understand. 3D visualisation technology offers a potential way to more easily navigate and interpret farm management information. However, future research is required to test both the effectiveness and efficiency gains in adopting 3D visualisation technology. If there are efficiency
gains this will go somewhat assist in addressing the issue of ‘regulatory creep’. It is believe that 3D visualisation technologies which support Web 2.0 collaboration will result in more informed land use decision-making. This will ultimately lead to more sustainable land use practices to ensure intergenerational wealth of farm land and better protection of natural resource environments. Again, this required further testing. In future work we will test the effectiveness of providing farmers and land managers with spatial information in a 3D form viewable in collaborative Web 2.0 packages such as Google Earth and SIEVE. Also, we will evaluate the usability of farm management software such as eFarmer to increase environmentally acceptable farm management practices. 6.
REFERENCES
Bishop, I. D. and E. Lange (2005). Visualization in Landscape and Environmental Planning: Technology and Applications. London & New York, Taylor & Francis. Cartwright, W.E. (2007), Desktop Analysis and Review of Spatial Information Products and Technologies that have Application at the Farm and Catchment Scale , Report to the Department of Primary Industries, Victoria. Carruthers, G. and S. Murray (1999) Environmental Management Systems and Agriculture: how can they be applied and what are the benefits? Paper No 2. In Proceedings Production and Environmental Monitoring Workshop, RIRDC. Lovett, A., Kennaway, R. Sunnenberg, G. Cobb, D. Dolman, P, O'Riordan, T. Arnold, D. (2002). Visualizing sustainable agricultural landscapes. Virtual Reality in Geography. P. Fisher and D. Unwin. London, UK, Taylor and Francis: 102-130. Seymour, E.J. (2007) Benefits, threats and getting started with Environmental Management Systems: views of primary producers and catchment managers in Victoria, Australia, Australian Journal of Experimental Agriculture, 47, 303-311.
1286
Seymour, E.J., A.M. Ridley and J. Noonan (2007) Assessing the role of a four-stage approach for improving the compatibility of Environmental Management Systems and Quality Assurance, Australian Journal of Experimental Agriculture, 47, 333-345. Stock, C., I.D. Bishop, A. O'Connor, T.C. Chen, C.J. Pettit and J.P. Aurambout (in press), SIEVE: collaborative decision-making in an immersive online environment, Cartography and Geographic Information Science.