[6] R.M. Haralick, K. Shanmugam and I. Dinstein, Textural fea- tures for image classification, IEEE Trans. Syst., Man., Cy- bern., vol. SMC-3, pp. 610-621, 1974.
Entropy Estimation and Multiscale Processing in Meteorological Satellite Images Jacopo Grazzini, Antonio Turiel and Hussein Yahia AIR project - INRIA, Domaine de Voluceau BP105, 78153 Le Chesnay Cedex, France.
Abstract A new model for the multiscale characterization of turbulence and chaotic information in digital images is presented. The model is applied to infrared satellite images for the determination of specific areas inside the clouds. These images are difficult to manipulate however due to their intrinsically chaotic character, consequence of the extreme turbulent regime of the atmospheric flow. In this paper we briefly review some known techniques for processing such data and we will justify the necessity of multiscale methods to extract the relevant features. In the theory presented herein, one main attribute is determined for every image: the Most Singular Manifold (MSM, of fractal nature), characterizing the sharpest changes in graylevel values. We will see that the most important set (from the statistical point of view) is that which both contains the sharpest transitions (MSM) and maximizes the local entropy. For that reason, images can be reconstructed to a good quality from the value of the gradient over that set of maximal information. The results are interpreted according to their relevance for determining meteorological features.
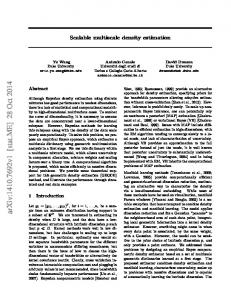
to a decomposition of the image which allows to determine specific complex turbulent regions. We show how this decomposition is related to classical texture information, like entropy or cooccurrence. As regards applications, this paper deals with MeteoSat images acquired during a couple of days in summer 1998 in an infrared channel (10.5µm − 12.5µm wavelength). The structures displayed on those images (see Fig. 1) are convective clouds, which are characteristic for the intertropical convergence zone (ITCZ) over western Africa and are generally responsible for sahelian rainfalls [1]. The final goal will be to determine pluviometry directly from the infrared signal, although we will not discuss that issue in this paper.
Figure 1. MeteoSat infrared image.
1. Introduction and motivation We are interested in devising adequate techniques for processing images for which classical edge operators, or classical algorithms for region segmentation may not be appropriate. This is precisely the case when turbulent, chaotic transitions between graylevel values take place in the area of interest and its boundary [13]. Examples of such images are typically found in satellite imagery, specifically in meteorology and oceanography. For those images, the meaningful entities are located in the most chaotic areas, and thus are difficult to extract. Moreover, satellite images are often acquired in noisy conditions, including numerous artefacts that superimpose on the turbulent region (sharp variations in luminance, missing data) leading to very poor results for classical image processing operators. We introduce a novel approach based on multiscale analysis of irregular graylevel transitions. This approach leads
In the next section we review previous work. In section 3, a multiscale technique called multifractal analysis is introduced. It allows splitting images in different fractal components, one of them turns out to be the most relevant one. In section 4 we show the links between multifractal analysis and classical texture description based on coocurrence matrices; we make explicit the connections between local entropy and the relevant fractal component. Finally, we discuss the work in the perspective of future applications in section 5.
2. Previous work In the literature, we generally distinguish four major families of segmentation methods (see reviews in [4] and [7]): statistical methods (which consist in characterizing stochastic properties of graylevel spatial transitions),
geometrical methods (based on the idea that textures are made up of primitives with geometrical properties), modelbased methods (which intend to capture the underlying process that generated the textures) and signal-processing methods (which perform frequency analysis of the textures). Classical methods generally use textural features, which quantify the texture content in a small, local region of the image [4]. Those methods do not always take into account scale invariance. For example, many approaches fail to accurately model textures with long edges or sharp discontinuities. Other approaches, because they recognize textures using simple local measures, implicitly assume that textures are self-similar at every scale. Moreover, classical boundary detection and segmentation methods (such as Markov random field or other algorithms motivated by physical processes [10]) assume regularity conditions that are not satisfied in the case of turbulence. Consequently it is usually difficult to extract regions of irregular structures. However, turbulent, chaotic signals can be characterized by means of their singularity fronts, that is, the set of pixels over which the most drastic changes in graylevel value take place. In fact, all the pixels in the image can be classified according to the strength of the transitions, giving rise to a multi-fractal splitting. Multifractal measures were first introduced for dealing with energy dissipation in turbulent fronts [5]. Every point in the flow is assigned a singularity exponent via a wavelet transform analysis [2]. Those techniques were further developped for 2D signals in the context of real world images in [12]. They provide two different types of data. The first data is a set characterizing the sharpest transitions (MSM: Most Singular Manifold); the second data describe the distribution of luminance over the MSM. The computation does not rely on a spatially fixed window as it is the case in usual image processing methods for computing entropy or coocurrence matrices [6] [9]. We describe the method and the MSM in the next section. The reader is referred to [12] for the full discussion.
3. The Most Singular Component We will develop in the following the basis of multifractal analysis. The first point concerns the definition of an apropriate multifractal measure. For a turbulent signal T (~x), the density of the measure µ was defined as dµ(~x) = d~x |∇T |(~x), that is, the measure of a ball Br (~x) of radius r centered around the point ~x is given by: Z µ(Br (~x)) = d~y |∇T |(~y ) (1) Br (~ x)
Such a measure gives an idea of the local variability of graylevels around the point ~x. In turbulent flows, a similar expression defines the local dissipation of energy, and it was supposed to discriminate the complicated structures in
which energy is injected and dissipated in the flow. It was observed that for turbulent images such a measure is multifractal: it is characterized by local singularity exponents h(~x) in the way: µ(Br (~x)) = α(~x) rd+h(~x) + o(rd+h(~x) )
(2)
where d is the dimension of the environment space, d = 2 for images. But over discretized images it is difficult to make a log-log linear regression of eq. (2), so it is convenient to use wavelet transforms of the measure. The wavelet transform of µ with the wavelet Ψ at the point ~x and the scale r is given by: Z ~x − ~y 1 ) (3) TΨ µ(~x, r) ≡ d~y |∇T |(~y ) d Ψ( r r For multifractal measures wavelet transforms also allow to compute the exponents [3], according to the following formula: TΨ µ(~x, r) = αΨ (~x) rh(~x) + o(rh(~x) )
(4)
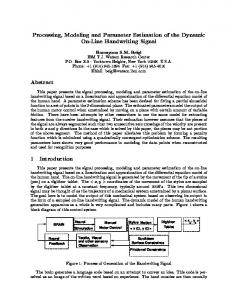
Usual wavelets used for assessing the value of h(~x) are those in the family (1 + |~x|2 )−γ for γ > 1, see [12]. The log-log linear regression applied to eq. (4) showed a good regression coefficient for the vast majority of points. In Fig. 2 we show the distribution of obtained singularities h(~x) across an infrared image. 2.5
2
1.5
1
0.5
0
-1
-0.5
0
0.5
1
1.5
2
Figure 2. Left: empirical distribution of singularities; right: orientated MSM (grey: negative orientation; black: positive orientation; white: non MSM).
This distribution is in good correspondence with the one predicted for log-Poisson multifractals. Full discussion on log Poisson multifractals and their connection with reconstruction can be found in [11] and [12]. We just present here the basic concepts. In log Poisson multifractals the whole multifractal signal can be reconstructed from just only one component, the one associated to the most singular (i.e., most negative) exponent, which we will denote h∞ . We will call that fractal component the Most Singular Manifold (MSM) and it will be denoted by F∞ (see Fig. 2). Let us define the density function of F∞ , δ∞ (~x). It equals 1 if ~x ∈ F∞ , 0 if ~x ∈ / F∞ . We define the restricted gradient
∇T∞ ≡ ∇T δ∞ , that is, the gradient over the MSM. The reconstruction formula is expressed as: T (~x) = (~g ? ∇T∞ )(~x) = (gx ? ∂x T∞ + gy ? ∂y T∞ )(~x) (5) where ? means convolution and ~g is the reconstruction kernel, which is easily represented in Fourier space as ~gˆ(f~) = if~/f 2 . In Fig. 2 we show the MSM at a rather coarse resolution (h∞ = −0.5 ± 0.3) and, in Fig. 3, the reconstructed image (PSNR: 36.6 dB with respect to the original image in Fig. 1) from the field ∇T∞ defined by the MSM.
Figure 3. Reconstruction (left) and reduced signal (right), the later obtained from the orientated MSM (see text).
The quality of the reconstruction is really good, validating the whole approach. An interesting related concept is that of the Reduced Multifractal Signal (RMS), that we will denote TR (~x). It is a signal having the same multifractal structure as the original one, but a more uniform temperature distribution (ideally attaining the most uniform distribution compatible with that multifractal structure). To build such a signal, we apply the reconstruction kernel over a naive restricted gradient. We will assign to every point in the MSM a unitary vector gradient, perpendicular to the MSM and with the same orientation as ∇T . We subsitute ∇T∞ in eq. (5) by this simple vector field to obtain TR (~x) (see Fig. 3). Let us remark that such an image has the same multifractal exponents (so the same MSM) as the original one, but a different, more uniform spatial distribution of graylevels.
4. Texture properties and the MSM We are particularly interested in the statistical properties of meteorological images. We intend to exploit the prior knowledge that spatial graylevel gradients are rather small in the heart of the cloud but more important close to its boundary [8]. Spatial distribution and spatial dependence among local graylevel values have been studied earlier in texture analysis. The most commonly texture features’ extraction method for remotely sensored data consists in computing graylevel cooccurrence matrices and statistical measures of entropy. Those methods show good performance
on benchmark images [9]. As mentioned in the section 2, the cooccurrence statistics use local properties to characterize texture. Typically, this is done by extracting information from a window of predefined size and centered on the pixel of interest. There is however a compromise in choosing the window size: small size reduces the discrimination ability whereas large size reduces the capability of detecting region boundaries. Haralick et al. [6] introduced the method to compute statistics of cooccurrence matrices. The cooccurrence matrix is the matrix of relative frequencies of two graylevels separated by a given distance and at a given orientation. To characterize spatial texture, several matrices need to be computed for different distances and orientations. Taking into account the multiscale nature of wavelet transforms, the computation of the cooccurrence matrices must be performed at different resolutions while information from different angles can be integrated within the same filter. Multifractal analysis takes advantage of localization properties and provides a spatial density function of the cooccurrence textures. Statistics like entropy can then be computed in order to reflect some characteristics of the texture and to integrate local information in image segmentation. Local entropy can be directly calculated from the local coocurrence matrix (it is one of the 14 parameters defined by Haralick et al [6]). It measures the amount of uncertainty inherent to the probability distribution. In which regards to graylevel distribution, entropy is maximized for the uniform graylevel distribution. Regarding spatial distribution of pixels, entropy is maximized when pixels become statistically independent. We propose a method to estimate the local entropy of graylevels around every pixel. The standard way consists in defining a small window around the point, then computing the relative frequency fl of the observedPgraylevels and finally calculating the entropy as S = − fl log2 fl (in bits). However, a too small window throws a constant, maximal entropy because of the lack of sampling, while a too large window loses localization. Our approach consists in assigning a weight to the observed cases when calculating the frequencies fl , so that pixels further away from the base pixel will contribute less and less. We assign a 1/r2 weighting (r: distance to the central pixel), as the number of pixels at a distance r grows as 2πr. We limit the weighting to a 21 × 21 window and the bit depth to 8 bits (256 graylevels). The entropies for the original and reduced images, according to our method, are given in Fig. 4, from which we can make two interesting remarks. First, the pixels which locally maximize the entropy corresponds to those of the MSM, giving another interpretation of this set. It is more convenient to use the MSM as it is scale independently defined, which is required for an appropriate analysis of turbulent images. Second, entropy over the RMS is much more
ture) and the original one in order to find foci of temperature drop or increase - which are associated to precipitation. Moreover, since we are dealing with moving structures, it would be particularly relevant to exploit dynamic information too. New research directions should then include the use of information on motion to obtain segmentation based on spatio-temporal analysis.
Acknowledgments Figure 4. Entropies for the original signal (left) and reduced signal (right)
uniform: ideally it would be piecewise constant, which would confirm the role of the RMS as a uniform temperature version of the original image.
We are grateful to the Laboratoire de M´et´eorologie Dynamique (Ecole Polytechnique, France) for their data. J. Grazzini is partially founded by a grant from the Regional Council of Ile-de-France (agreement no. E.1358).
References 5. Conclusion and future work In this paper we have presented a multiscale method for image segmentation using multifractal analysis. Multifractal images can be decomposed into a collection of different fractal sets, each one conveying a certain amount of information. One of those fractal components, which is called the Most Singular Manifold (MSM), is shown to be the most informative for this type of images. The MSM describes somewhat temperature transitions in atmosphere and thus it is related to convective activity in clouds. Classical methods based on texture extraction, boundary detection, etc do not work so efficiently when applied to this kind of data because of the multiscale properties characteristic to turbulent flows. They are usually defined over finite size windows, which can only describe the behaviour of the image at a fixed resolution. Multifractal segmentation of images is a scale invariant decomposition which could only be retrieved in classical methods when the zero limit of different resolutions is taken. In order to compare the two approaches we have shown how the MSM is related to texture information contained in local entropy (computed out of a cooccurrence matrix). We defined a method to estimate local entropy which generalizes window managing to a more scale invariant scheme, and we verified that the local maxima of the so obtained entropy are closely related to the MSM. As entropy measures information, the result means that the MSM contains the (locally) most informative points in the image. It is so not so surprising that image can be reconstructed (via a linear kernel) knowing the gradient of graylevels over the MSM. As a part of future research, we intend to apply the model to meterological satellite images to detect and characterize rainfalls in convective clouds. Our approach will be to compare the reduced signal (with the most uniform temperature distribution compatible with the multiscale struc-
[1] Y. Arnaud, M. Desbois and J. Maizi, Automatic tracking and characterization of african convective systems on MeteoSat pictures, J. Appl. Meteor., vol. 31, pp. 443-493, 1992. [2] A. Arneodo, Wavelet analysis of fractals: from the mathematical concepts to experimental reality, In G. Erlebacher et al eds., Wavelets. Theory and Applications, p. 349, Oxford University Press, ICASE/LaRC Series in Computational Science and Engineering, Oxford, 1996. [3] I. Daubechies, Ten Lectures on Wavelets, Capital City Press, CBMS-NSF Series in Appl. Math., 1992. [4] J.M. Du Buf, M. Kardan and M. Spann, Texture feature performance for image segmentation, Patt. Recogn., vol. 23, no. 3/4, pp. 291-309, 1990. [5] U. Frisch, Turbulence, Cambridge Univ. Press, Cambridge MA, 1995. [6] R.M. Haralick, K. Shanmugam and I. Dinstein, Textural features for image classification, IEEE Trans. Syst., Man., Cybern., vol. SMC-3, pp. 610-621, 1974. [7] N.R. Pal and S.K. Pal, A review on image segmentation techniques, Patt. Recogn., vol. 26, pp. 1277-1294, 1993. [8] C. Papin, P. Bouth´emy, E. M´emin and G. Rochard, Tracking and characterization of highly deformable cloud structures, ECCV, pp. 428-442, 2000. [9] T. Randen and J.H. Husoy, Filtering for texture classification: a comparative study, IEEE Trans. on PAMI, vol. 21, no. 4, pp. 219-310, 1999. [10] J. Strand and T. Taxt, Local frequency features for texture classification, Patt. Recogn., vol. 27, no. 10, pp. 1397-1406, 1994. [11] A. Turiel and A. del Pozo, Reconstructing images from their most singular fractal set, IEEE Trans. on Im. Proc., vol. 11, 2001. [12] A. Turiel and N. Parga, The multi-fractal structure of contrast changes in natural images: from sharp edges to softer textures, Neural Comp., vol. 12, pp. 763-793, 2000. [13] A.L. Yuille, J. Coughlan, S.C. Zhu and Y. Wu, Order parameters for minimax entropy distributions: when does high level knowledge help?, CVPR, pp. 558-565, 2000.