Craig G. Nevill-Manning, Komal S. Sethi, Thomas D. Wu and Douglas L. Brutlag. Biochemistry Department, Stanford University, Stanford, CA 94305-5307.
ENUMERATING AND RANKING DISCRETE MOTIFS Craig G. Nevill-Manning, Komal S. Sethi, Thomas D. Wu and Douglas L. Brutlag Biochemistry Department, Stanford University, Stanford, CA 94305-5307 {cnevill, sethi, thomas.wu, brutlag}@stanford.edu Abstract Discrete motifs that discriminate functional classes of proteins are useful for classifying new sequences, capturing structural constraints, and identifying protein subclasses. Despite the fact that the space of such motifs can grow exponentially with sequence length and number, we show that in practice it usually does not, and we describe a technique that infers motifs from aligned protein sequences by exhaustively searching this space. Our method generates sequence motifs over a wide range of recall and precision, and chooses a representative motif based on a score that we derive from both statistical and information-theoretic frameworks. Finally, we show that the selected motifs perform well in practice, classifying unseen sequences with extremely high precision, and infer protein subclasses that correspond to known biochemical classes.
1 Introduction Sequence motifs allow functional inferences to be made on the basis of homology, and provide clues to important structural constraints. In the past, motifs have been found by a hit-or-miss process of heuristically pruning the space of motifs. We have discovered that, surprisingly, the motifs can usually be enumerated exhaustively. This paper describes the development of EM OTIF , a system that is capable of enumerating the entire space of motifs from a sequence alignment and choosing the motif that maximizes a scoring function based on both statistics and information theory. E M O T I F is an extension of the S EQ CLASS system described by Wu and Brutlag (1995), and is available at http://motif.stanford.edu/emotif As input, EMOTIF expects a multiple alignment such as those from the BLOCKS database (Henikoff and Henikoff, 1991), which typically contains sequences from active sites where sequence homology stems from functional constraints. As output, EM OTIF generates a graphical display of possible motifs in the style of PROSITE (Bairoch, 1991). The motifs discussed here take the form of allowable amino acids for certain positions in a subsequence. Rather than permitting an arbitrary set of amino acids in each position, we prescribe a small number of sets that correspond to some biochemical property, such as charge or size. This constrains the space of motifs, and ensures that the motifs have biochemical interpretations.
The small number of amino acid sets imposes a simplicity bias on the motifs, and helps avoid the danger of overfitting an alignment, which we believe is present in manually compiled motifs such as PROSITE. The problem of identifying appropriate sets is examined in Wu and Brutlag (1996). As is common in inference of this type, there is a tradeoff between accounting for positive examples in the training set and excluding negative examples in a large test set. A motif that is too specific fails to cover sufficient sequences from the input, but one that is too general will produce too many false hits when used to classify new sequences. When making this tradeoff, EM OTIF can identify functional subclasses of sequences, and we describe a case study where the subclasses correspond to known biological roles. Our work is related to work by Brazma et al. (1996), which identifies PROSITE-style motifs from unaligned sequences. They use an information-theoretic argument for choosing motifs, but admit that the search that they perform is a polynomial heuristic for a problem that is NP hard. The MEME system described by Bailey and Elkan (1995) finds probabilistic motifs in unaligned sequences. MEME performs alignment and motif identification simultaneously, where the motifs are expressed as distributions of symbols in consecutive positions of a sequence. There are therefore a large number of parameters to estimate from a dataset that is sometimes small, and there is some danger of overfitting. The PIMA system by Smith and Smith (1992) uses amino acid groups to constrain motifs in a multiple alignment framework. In our work, we show that the search space can be constrained and restructured to permit exhaustive enumeration and scoring of all possible discrete motifs for a given family. Section 2 explains the process of motif formation as well as the fundamental tradeoff of coverage and specificity that finding a motif entails. Section 3 describes a new algorithm that is capable, in many practical situations, of enumerating a space that can grow exponentially with the number and length of sequences. Section 4 describes how, given the universe of motifs, one can be chosen that trades off coverage against specificity in an optimal way, and provides derivations from a statistical and an information theoretic perspective. Section 5 presents and discusses results, including identification of functional subclasses and prediction of function of novel sequences.
2 Example: The Universe of Tubulin Motifs
a
This section describes the process of exploring the universe of motifs for a multiple alignment using sets of related amino acids. The sets that will be used throughout the paper are shown in Figure 1 along with their chemical properties. Figure 2a lists 34 aligned sequences from α and β subunits of tubulin, and Figure 2b lists the amino acids that occur in each column. Some columns contain only one amino acid: for example, the first column contains only methionines. These columns are highly conserved. Other columns contain related amino acids; for example, the second column contains phenylalanine and tyrosine, which both have aromatic side chains. Still other columns contain unrelated groups of amino acids; for instance, the third column contains six amino acids that exhibit little chemical similarity. One might use this summary directly to detect new tubulins. For a new sequence to match, it would have to have in each position an amino acid that appears in the corresponding column of Figure 2b. However, the resulting motif would be overly specific. For example, given the unrelatedness of the amino acids in column 3, it seems likely that the amino acid in this position is functionally unimportant, and that the particular amino acids that occurred in the sequences are a result of random chance. To reflect this, the motif should allow any amino acid in this position. Figure 2c shows a generalized motif, where the six amino acids in the third position have been replaced with a period, which stands for any amino acid. Similarly, when all amino acids in a column share some property, we can infer that related amino acids with that property also belong. For instance, the motif in Figure 2c adds tryptophan in the second position, based on the inference that the amino acid in this position must have an aromatic side chain. When all amino acids in a position can be described equally well by more than one property, the most specific property is chosen. Otherwise, all positions might legally be represented by a period, producing a motif that would match any sequence. Finally, when a single unique amino acid occurs in a column, one can infer that that particular amino acid is critical to the function of the protein, so the motif requires its presence. In such a position, the generalized motif of Figure 2c is identical to Figure 2b. AG ST KR FWY HKR ILV ILMV EDNQ AGPST .
Figure 1:
MFRRKAFLHWYTGEGMDEMEFTEAESNMNDPVAEYQQY MFGKRAFVHHYVGEGMEENEFTDARQDLYELEVDYANL MFKKRAFVHWYVGEGMEEGEFTEARENIAVLERDFEEV MFKRKAFLHWYTGEGMDEMEFTEAESNMNDLVSEYQQY MFKRKAFLHWYTGEGMDEMEFTEVRANMNDLVAEYQQY MFKRKAFLHWYTSEGMDELEFSEAESNMNDLVSEYQQY MFKRKGFLHWYTGEGMEPVEFSEAQSDLEDLILEYQQY MFRRKAFLHWFTGEGMDEMEFTEAESNMNDLVSEYQQY MFRRKAFLHWYTGEGMDEMEFSEAEGNTNDLVSEYQQY MFRRKAFLHWYTGEGMDEMEFTEAESNMNDLMSEYQQY MFRRKAFLHWYTGEGMDEMEFTEAESNMNDLVAEYQQY MFRRKAFLHWYTGEGMDEMEFTEAESNMNDLVHEYQQY MFRRKAFLHWYTGEGMDEMEFTEAESNMNDLVSEYQQY MFRRKAFLHWYTGEGMDEMEFTEAESNMNELVSEYQQY MFRRKAFLHWYTLEGMEELEFTEAESNMNDLVYEYQQY MFRRKAFLHWYTNEGMDITEFAEAESNMNDLVSEYQQY MFRRKAFLHWYTSEGMDEMEFTEAESNMNDLVSEYQQY MFRRKRFLHWYTGEGMDEMEFTEAESNMNDLVSEYQQY MFRRNAFLHWYTGEGMDEMEFTEAESNMNDLVSEYQQY MFRRQAFLHWYTSEGMDEMEFTEAESNMNDLVSEYQQY MFSRKAFLHWYTGEGMEEGDFAEADNNVSDLLSEYQQY MFVKRAFVHWYVGEGMEEGEFAEARDDLLALEKDYESV MYAKRAFVHWYVGEGMEEGEFAEAREDLAALEKDYEEV MYAKRAFVHWYVGEGMEEGEFSEAREDIAALEKDYEEV MYAKRAFVHWYVGEGMEEGEFSEAREDLAALEKDFEEV MYAKRAFVHWYVGEGMEEGEFSEAREDLAALEKDYEEV MYAKRAFVHWYVGEGMEEGEFSEAREDMAALEKDYEEV MYAKRAFVHWYVGEGMEEGEFSEVREDLAALEKDYEEV MYAKRAFVHWYVGEGMEEGEFTEAREDLAALEKDYEEV MYAKRAFVHWYVGEGMEEGEFTEAREDLAALERDYIEV MYAKRAFVHWYVGEGMEEVEFSEAREDLAALEKDYEEV MYAKRAFVHWYVSEGMEEGEFAEAREDLAALEKDYDEV MYSKRAFVHWYVGEGMEEGEFSEAREDLAALEKDYEEV MYSKRAFVHWYVGEGMEEGEFSEAREDLAALERDYEEV
b
M FG KK AF VH HF VG EG MD EN EF AE AR QN VA AL VK EF QQ L YK R R R L WY T S E P G D SD V E E D L L D P L S D Y A S V R NG L IM T D IS E EY EE Y V Q N L A MN V IA IN A V N TE L S T S Y V
c
M F. K. .F VH .F .. EG MQ .. QF PQ .. .Q .. .. .. QF .. . Y R L Y N N AN N NY W I W E E GE E EW D D SD D D T
d
M F. K. .F VH .F .. EG MQ .. QF PQ .. .Q .. .L .. QF .. . Y R L Y N N AN N NY W I W E E GE E EW D D SD D D T
➀
➃
➂ ➁
Figure 2: Building a motif. (a) aligned sequences, (b) amino acids that appear in each column, (c) generalized motif using chemical properties, (d) motif after removing first sequence. One problem with this approach is that it is sensitive to noise. In Figure 2a, the first sequence has a phenylalanine in the eighth position from the right, as shown by annotation ➀. Every other sequence has a leucine in this position. If the first sequence were deleted, the period in this position of the motif could be replaced by the specific amino acid leucine, making the overall motif much more specific. A more specific motif is less likely to match a random sequence, so the possibility of incorrectly identifying a sequence as belonging to this functional group is reduced. A more specific motif reduces the number of false positives that would be expected if the motif were to classify new sequences. Therefore, when motifs are constrained by physicochemical properties, there is a fundamental tradeoff between the true positives (the matching sequences in the alignment) and the false positives that the motif is likely to match in a large database. Furthermore, the appropriate property
small small hydroxyl basic aromatics basic small hydrophobic medium hydrophobic acidic/amid small polar all amino acids
Some examples of sets of amino acids and their common properties
2
of motifs. For ten sequences, there are only 210 or 1024 possible subsets, and for each subset there is a single motif that corresponds to the most specific amino acid or group in each position. Thus the space of motifs is independent of the length of the sequences and the number of amino acid groups. Of course, the number of subsets grows exponentially with the number of sequences, so for the 34 sequences in Figure 2a, there are 234 or 1010 subsets. Wu and Brutlag dealt with this situation by performing a beam search, including or excluding new sequences and keeping a limited number of subsets at each stage that generate the highest-scoring intermediate motifs. This approach performed well, but we have found that in practice it can miss the highest-ranking motifs in the end. Crucial to our new techniques is the observation that, in practice, the space of motifs and the space of subsets are highly redundant. That is, many motifs select the same subset of sequences, and many subsets specify the same motif. For example, in the case of tubulin subunits, there are 10 56 motifs, and 1048 subsets, yet only 39,000 motifs that select distinct subsets. How can this be? First, recall that for a given subset, EMOTIF calculates the most specific motif that covers the subset. EMOTIF looks for a motif that will generate few false positives, and therefore favors more specific motifs. So out of the many motifs that select a particular subset, EMOTIF records only one. For example, in the motif of Figure 2d, which covers all but the first sequence, replacing the methionine in column 1 with a period does not change the subset that it covers. In fact, a motif containing all periods except for the column with the leucine in it will also cover the same subset. So many motifs can cover the same subset, but only the most specific one will be considered. Similarly, many subsets can specify the same most specific motif. For example, removing the last sequence from consideration specifies the same motif as before. It differs from the second-last sequence only in the sixth position from the right, where it has an arginine instead of a lysine (annotation ➁). However, the fifth to last sequence also has an arginine in this position (annotation ➂), so the amino acids in this column do not change as a result of removing the last sequence, and the motif remains the same. A motif selects a subset of sequences, and a subset of sequences specifies a most specific motif, using the process described in Section 2. We are interested only in the most specific motif that selects a given subset. We will call this a canonical motif. A canonical motif for a subset of sequences is the most specific motif for that subset. A canonical motif can be found from an arbitrary motif by identifying the subset of sequences that it selects, then finding the most specific motif for that subset. The space of canonical motifs is still potentially exponential: if there are many sets of amino acids, then each subset could be described more specifically, and there will be many more canonical motifs. At the extreme, there could be 2 20 sets representing every combination of amino
specificity p(M)
0.1
10-50
48
Figure 3:
sequences covered 159 Sensitivity and precision of 6,000 motifs, indicating subclasses covered
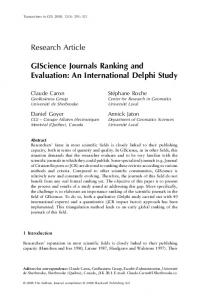
description at each position must be chosen; these choices create a universe of possible motifs. E M OTIF is able to search and evaluate this universe exhaustively. Figure 3 shows the space of motifs explored by E M OTIF for all 159 tubulin subunits. Each point corresponds to a motif; its coordinates represent the true positives on the horizontal axis, and the expected false positives on the vertical axis. 1 The ideal motif would appear at the bottom right of this graph—a highly specific motif that matches all the input sequences. Because there is no motif in this region, the task is to identify the ‘best motif’, by trading off the true positives against the expected false positives. The dashed line is essentially a Pareto-optimal curve. No motif on this line can be made more specific without sacrificing coverage, or can be increased in coverage without becoming less specific. E M OTIF can search and rank the universe of motifs efficiently. The tubulin example required approximately 30 seconds on a Silicon Graphics Indigo 2 workstation with an R10000 CPU . The next two sections describe technically how this process works.
3 Methods: Enumeration 3.1 Size of the space of motifs The space of motifs is very large. For a multiple sequence alignment with n columns and m sets of amino acids, there are (m+20)n motifs, because each position can specify a set or one of 20 specific amino acids. The sequences in Figure 2a are 38 amino acids long, so using 10 sets of amino acids gives 3038 or 1056 motifs. This space is clearly too large to search exhaustively. Wu and Brutlag (1995) addressed this problem by enumerating subsets of sequences, which for small numbers of sequences is much smaller than the space 1
We will explain the vertical scale in Section 4.
3
acids, and the motif would be identical to the amino acids in each column as in Figure 2b. In this case, the motifs again grow exponentially with the length of the sequences. Alternatively, if the sequences were unrelated, so that removing one sequence always changed the most specific motif, the number of motifs would grow exponentially with the number of sequences. However, when the number of amino acid sets (or equivalently, chemical properties) is limited and the sequences are reasonably homologous, we have found that the space of canonical motifs is reduced in size considerably. In addition to eliminating redundant motifs, we further constrain the space of motifs by considering only motifs that select some minimum number of sequences. If we desire merely to exclude a small number of sequences that contain errors, then it is reasonable to consider only motifs that exclude, say, 10% of sequences from consideration. This dramatically reduces the number of motifs that need to be searched. We will show in Section 3.2 how motifs can be enumerated from highest coverage to lowest coverage, so it possible to implement this restriction efficiently. A more conservative restriction, and one that we prefer, is to allow the possibility that the set of sequences contains functional subclasses, and set the threshold at, say, 30%. In this scenario, up to three subclasses could be identified from the set—at least one class must be represented by at least one third of the sequences—and setting the threshold at 30% also allows for errors. These subclasses will be discussed further in Section 5. We have argued that the space of canonical motifs may be much smaller than the exponential space of arbitrary motifs, but it remains to be shown that the smaller space is tractable in practice (since its size is determined by the structure of the data) and that the motifs can be enumerated efficiently. The next section describes an efficient enumeration algorithm, and in Section 5 we discuss real-world performance.
position 1 2
f
vlim
22
3 ... . ag 4
m
34
. 34
y 12 10
fyw 12
8
st a s pagst ...
...
...
Figure 4: part of a search tree of motifs indicated by the superscript y12. For simplicity, the subtrees from f and fwy are omitted. In the subset of sequences that y selects, the only symbols that occur in the third position are s and a, so the motif here could specify s, a, ag, st, pagst or period. The groups s, a, and pagst cover the same subsets as st, ag and period respectively, so the first three are used in preference to the less specific groups. The s branch selects only two sequences, which is below the 30% threshold, so this motif and the subtree under it are pruned from the search. Note that the branching factor of the search tree is determined by the number of possible groups at a position in some subset, and is often much less than the theoretical maximum of 30. The depth of a branch is limited by the minimum number of sequences that must be covered. Despite a drastic reduction in the number of motifs visited, this traversal of the tree of motifs nevertheless visits some motifs that are not canonical. This is due to the frequent correlation of positions in homologous sequences. For example, specifying r in the fifth position selects the same subset of sequences as selecting v in the seventh position, and d in the fifth position from the right, as illustrated by annotation ➃ in Figure 2a. The canonical motif—the most specific motif for that subset—contains both e and v in their respective positions. Both motifs as well as the canonical motif will be visited in the search tree, but because they give rise to the same canonical motif, the subtree starting at that motif need only be visited once. To ensure that subtrees of previously visited canonical motifs are not explored, EMOTIF must record motifs for efficient lookup. As discussed in the previous section, canonical motifs have a one-to-one correspondence to subsets of sequences, so it is possible to index motifs by these subsets. A subset can be represented by a binary string with one bit per sequence, which is then stored and queried in a hash table. The entire algorithm is summarized in Figure 5. Its heart is the recursive procedure form_motifs, which considers possible groups in a particular column. If it encounters a new canonical motif, it calls itself recursively with the next column and the subset as arguments, in order to explore the subtree of the motif.
3.2 Enumeration algorithm EMOTIF proceeds through the space of motifs position by position: in the first position, it considers all amino acids and sets of amino acids that match some subset of the sequences. Each of the possibilities for position 1 produces a subset of sequences, and these subsets are passed to the next level, which evaluates the possibilities for position 2, and so on for all positions in the alignment. Part of this tree of motifs is shown in Figure 4, assuming the sets in Figure 1 and a 30% minimum coverage (10 sequences). In Figure 2a, the possibilities in column one are m, vlim, and period. These appear on the first row of Figure 4. Because the specific amino acid m covers the same subset as the other two possibilities, only the most specific possibility, m, is considered in this position. In the second position, shown on the second row of Figure 4, the possibilities are f, y, or fwy. Choosing y produces a subset of 12 sequences, as
4
4 Methods: Ranking
gives the expected number of false positives when classifying sequences from that database. The next two sections describe alternative approaches to choosing the best motif.
So far we have described a way to enumerate all canonical motifs, each of which selects a certain subset of sequences. The task is now to choose one motif that is most likely to make a good probe for a protein with this structure. As mentioned in Section 2, EM OTIF attempts to identify a motif that maximizes the number of positive examples covered and minimizes the number of sequences likely to be matched by chance. Because it is unlikely that one motif can accomplish these simultaneously, it is necessary to trade one quantity off against the other. This section describes two approaches to this tradeoff: a maximization of statistical significance, and a minimization of entropy. Derivations using both these approaches yield very similar results, and the measure that we use approximates both. Before we proceed to describe the tradeoff, we must explain the vertical axis of Figure 3. To compute the probability that a motif will match a random sequence, we first assume that sampling short amino acid sequences from a large database is equivalent to drawing sequences of independently drawn symbols from the distribution of amino acids in the database. That is, if glutamine accounts for 7% of the amino acids in the database, then it has a 7% chance of appearing in a particular position in our random sequences. Given this distribution, it is simple to calculate the chance that a random sequence matches a given motif: it is the product of probabilities that a random amino acid matches each position in the motif. If a position has a period, the probability is 100% for that position. If a position has a specific amino acid, the probability is the probability of that amino acid in the database distribution. If a position specifies a group of amino acids, the probability for that location is the sum of the probabilities of the amino acids in the distribution. The probability for a motif is therefore
4.1 Statistical approach The statistical approach identifies the motif that is least likely to have matched k0 sequences by chance. Given that a motif M matches a random sequence with probability p(M), it would be expected to match p(M)⋅N sequences out of a set of N sequences. Matching a sequence is a binomial event, so the probability of matching at least k0 sequences is: n
k
n−k
(2)
k=k0
Because a motif is typically chosen to match the k0 sequences, which are far from random, p(M)⋅N is usually very close to zero, and the probability of matching k0 sequences or more is vanishingly small. This probability is somewhat artificial, but since the purpose of this measure is to provide a ranking of motifs, the absolute value is less important than the value relative to other motifs. For most motifs, p(M) 0.001 is reasonable when searching sequence databases containing millions of symbols, as these motifs are likely to return thousands of false hits. This level ensures that the second term in the sum is smaller than the first term by a factor of 1000, so the approximation is very close.
4.2 Description length approach
l −1
p( M ) = ∏ ∑ p( a)
n
∑ k p( M ) (1 − p( M ))
(1)
Alternatively, the problem of motif ranking can be approached as a minimum description length problem, which considers the most efficient way of storing or transmitting N amino acid sequences. This section describes how sequences can be transmitted efficiently without a motif, then shows how much saving can be achieved by using a motif. Because there are only 20 unique amino acids, each amino acid can be transmitted as a five-bit code. This is wasteful, however, because there are 32 five-bit codes, of which only 20 are used. When several symbols are being transmitted, it is possible to transmit a symbol in a nonintegral number of bits using arithmetic coding (Witten et al., 1987), so this could be reduced to log220, or 4.3 bits. This transmission uses the same number of bits for each amino acid, regardless of whether it is a common amino acid such as leucine, or a very uncommon one such as cysteine. An even more efficient way of sending a sequence is to use short codes for common symbols and long codes for uncommon symbols.
i = 0 a ∈gi
where M is a motif with l positions, gi is a set of amino acids at position i in M, and a is an amino acid in the group. It is this calculation that yields the vertical axis for Figures 3, 6, and 7. Multiplying by the size of a database
column, set) procedure form_motifs(c record most specific motif implied by set for all groups that match > 30% of column subset := elements of set that match group in column if subset hasn’t been visited before, record visit to subset column + 1, subset) form_motifs(c form_motifs(0, all )
Figure 5: The algorithm for enumerating motifs
5
cost –log2p(f). Now, p(f) has been scaled up by dividing by p(f) + p(w) + p(y) (which we will call p(fwy)). So transmitting f now costs –log2[p(f)/p(fwy)] = –(log 2p(f) – log2p(fwy)). The saving in transmission cost by using the motif is therefore –log2p(f) + (log2p(f) – log2p(fwy)) = –log2p(fwy). Over the whole sequence, the saving is
specificity p(M)
0.1
− 10-50
∑
positions
sequences covered 159 Shannon (1949) showed that the optimal code length for a symbol is –log 2p, where p is the probability that the symbol occurs. If we assume that the amino acids are drawn from the same distribution as an entire database, then the optimal code length for leucine should be – log2p(leucine) = –log2 p(0.09) = 3.5 bits, and the code length for cysteine = –log2p(0.017) = 5.9 bits. Overall, because there are more leucines than cysteines, the average code length will be less than log2 20 bits. The expected code length is 48
–
∑ p(a)log
2
log 2 ∑ p( a) a ∈A
which is the same as log2(p(M)), where p(M) is defined in (1) above. Since this does not depend on the composition of the sequence, the total saving over the k covered sequences just klog2(p(M)). Maximizing this saving is the same as minimizing p(M)k, which is the same measure that we derived from the statistical point of view. Figure 6 shows the same collection of motifs as in Figure 3, along with shading that represents the klogp score. The gradient has been discretized into bands for illustrative purposes. Note that because the vertical axis has a logarithmic scale representing logp, lines of equal score, such as the boundaries between bands, are hyperbolas. Darker points represent higher scores, so the knee in the graph at (1) scores slightly higher than the knee at (2), and is thus chosen as the motif for this collection of sequences.
p( a)
a ∈A
where A is the set of amino acids and p(a) is the actual probability of a occurring in the sequence. For the distribution in the SWISS-PROT database, the expected code-length is 4.2 bits. A motif can improve transmission efficiency by allowing the following scheme. First, the motif is transmitted, and the sequences that the motif matches are identified. These sequences will be encoded using the probability distribution implied by the motif, rather than the marginal distribution of the database. That is, if the motif specifies m in the first position, the distribution is 100% probability for m, and 0 probability of anything else. Because all of the covered sequences must have m in this position, only log2(100%) = 0 bits are required to transmit the first amino acid in each sequence. In the second position, the motif in Figure 2d narrows the possibilities to only fwy. All other probabilities are to zero for this column, and the probabilities for f, y and w are scaled to add to one. The sequences that are not matched by the motif are transmitted using the marginal distribution as before. The motif that provides the greatest saving is chosen as the best motif. So how much does a motif save? There is no saving on the sequences not matched by the motif— they are encoded as before. To calculate the saving on a matching sequence, consider a sequence that has f in the second position. Without the motif, transmitting f would
5 Evaluation In the introduction, we claimed that motifs are useful for classifying new sequences, and for identifying subclasses. We will first examine the predictive accuracy of EMOTIF versus the manually-compiled PROSITE motifs, and then discuss subclasses that follow naturally from clustering of sequences.
5.1 Predictive accuracy A motif’s usefulness when classifying new sequences depends on the context in which it will be used. Since EM OTIF enumerates the entire universe of motifs, it can rank them differently depending on the particular task. Some tasks may require motifs that are highly specific, whereas other tasks may require motifs that are sensitive. Given a desired level of specificity or sensitivity, however, the best motif should lie along the Pareto-optimal curve found by EMOTIF. In this experiment, we suppose EM OTIF is used to classify new protein sequences that are generated by largescale sequencing projects. In this environment, thousands of sequences, hundreds of amino acids long appear daily, and there are thousands of motifs that a sequence may
6
a
examples. We are content to accept a lower sensitivity on the assumption that less precise motifs can be employed in a second pass if the work involved in weeding out false positives is acceptable. To test predictive accuracy against motifs in the PROSITE database, we took all 410 motifs from PROSITE release 6.10 (February 1991), retrieved the sequences specified in that gold standard, and aligned them according to the PROSITE motif. For each multiple alignment, EMOTIF generated one motif, using the ranking described in Section 4 to choose among the motifs generated as in Section 3. We then extracted sequences that had appeared since 1991, and used both motifs to classify them. Because this data was not used in the formation of either the PROSITE or EMOTIF motifs, testing on this data gives an accurate indication of the predictive power of motifs on new sequences. As hoped, EM OTIF motifs had much higher precision than PROSITE, but with an accompanying drop in sensitivity. Over all 410 sets, the PROSITE motifs matched 6598 true positives, and generated 880 false positives, while EM OTIF matched 4619 true positives and 12 false positives. That is, the false positive rate dropped by a factor of 70, while the true positives dropped by a factor of only 1.4. Clearly, a scientist would be well advised to look at EMOTIF matches first, and progress to the other 40% of PROSITE later, bearing in mind the likely extra work in sorting out the false positives, which account for 43% of the remaining data.
specificity p(M)
0.1
10-50
48
sequences covered
159
b
specificity p(M)
0.1
On a motif by motif basis, EMO T I F has a lower precision than PROSITE in only 4 cases, each time with only one more false positive. Coverage drops in all but 100 motifs. Out of all the positive examples in the new sequences, PROSITE identifies 44% of them, while EMOTIF identifies 30%.
–47
10
27
sequences covered
83
c 0.1
specificity p(M)
PROSITE
EMOTIF
false positives
false negatives
6598 4619
880 12
9068 11047
5.2 Subclass identification Apart from prediction, EM OTIF ’s motifs can identify subclasses of motifs. Figure 3 shows the clouds of motifs labeled according to the classes of sequences that they select. To explain the clouds, it is necessary to briefly describe the set of tubulin subunit sequences. Microtubules, a class of cytoskeletal elements, are constructed from a helical arrangement of alternating α and β subunits. A third kind of tubulin subunit is the γ subunit, which is found at the microtubule organizing center. The specific cloud at the lower left matches exclusively β tubulin while the less specific motifs in the next cloud to the upper left covers both α and β subunits. The cloud at the upper left covers α, β and γ subunits, but these motifs are too general to be used for classification.
10-30
9 sequences covered Figure 7: repetitive application of EMOTIF
true positives
29
match, so it is important to keep the rate of false positives low. Even a 0.1% probability of a motif generating a false positive will give rise to thousands of spurious hits. We therefore aim for conservative motifs that make false positives unlikely. Higher precision comes at a price, however—more specific motifs are usually less sensitive, and incorrectly classify some new sequences as negative
7
Each motif can be interpreted as specifying a cluster of sequences, where specificity measures the homogeneity of the cluster. A homogeneous cluster from the lower left of Figure 7a (indicated by an arrow) matches the β tubulins. Taking the remaining sequences and applying EMOTIF to them gives the graph in Figure 7a. The best motif here (again indicated by an arrow) covers just α subunits. Applying EMOTIF again to the remainder gives the graph in Figure 7c, where the best motif matches just γ tubulins. The disjunction of these motifs matches three kinds of tubulins, while maintaining high specificity relative to a single motif that covered the same set. Furthermore, if the subclasses were biologically unknown, this process might provide some insights about function.
3580. Brazma, A., Jonassen, I., Ukkonen, E. and Vilo, J. (1996) “Discovering patterns and subfamilies in biosequences,” in D.J. States et al. (Eds.) Proc. Fourth International Conference on Intelligent Systems for Molecular Biology, 34–43. Menlo Park, CA: AAAI press. Henikoff, S. And Henikoff, J.G. (1991) “Automated assembly of protein blocks for database searching” Nucleic Acids Res., 19, 6565–6572. Shannon, C.E. (1948) “A mathematical theory of communication,” Bell System Technical Journal, 27, 398-403. Smith, R. F. and Smith, T.F. (1992) “Pattern-induced multi-sequence alignment (PIMA) algorithm employing secondary structure-dependent gap penalties for use in comparative protein modelling”, Protein Eng, 5(1), 35–41. Witten, I.H., Neal, R., and Cleary, J.G. (1987) “Arithmetic coding for data compression” Communications of the Association for Computing Machinery, 30 (6) 520-540, June. Reprinted in C Gazette 2 (3) 4-25, December, 1987. Wu, T.D. and Brutlag, D.L. (1995) “Identification of protein motifs using conserved amino acid properties and partitioning motifs,” in C. Rawlings et al. (Eds.) Proc. Third International Conference on Intelligent Systems for Molecular Biology, 402-410. Menlo Park, CA: AAAI press. Wu, T.D. and Brutlag, D.L. (1996) “Discovering empirically conserved amino acid substitution groups in databases of protein families,” in D.J. States et al. (Eds.) Proc. Fourth International Conference on Intelligent Systems for Molecular Biology, 230-240. Menlo Park, CA: AAAI press.
6 Conclusions We have extended S EQ CLASS (Wu and Brutlag, 1995) in five ways. First, by using the concept of a canonical motif, and by observing that there are typically a much smaller number of such motifs than the exponential worst-case bounds suggest, EM OTIF is capable of enumerating all motifs, obviating arbitrary pruning of the search space. Second, we have derived a ranking function for motifs based on both statistical and information-theoretic arguments, lending confidence to the final motif that EM OTIF produces. Third, EMOTIF generates a Paretooptimal set of motifs, which can be used with arbitrary ranking functions to generate optimal motifs for specific tasks. Fourth, we have evaluated the predictive performance of EMOTIF against a large corpus of manuallyderived PROSITE motifs, using a test set of sequences discovered after the PROSITE motifs were formed. In these tests, EMOTIF demonstrates vastly increased accuracy with only a comparatively small decrease in sensitivity. Finally, we have shown how the space of motifs can be used to identify clusters of sequences that correspond to protein subclasses by iterative application of EMOTIF .
Acknowledgments This work was supported by grant NLM R01 LM 05716-01 from the National Library of Medicine, and by SmithKline Beecham Pharmaceuticals. The authors thank Jeanette Schmidt for valuable discussions.
References Bailey, T.L. and Elkan, C. (1995), “Unsupervised learning of multiple motifs in biopolymers using EM”, Machine Learning 21, pp. 51–80. Bairoch, A. (1991) “PROSITE : A dictionary of sites and patterns in proteins.” Nucl. Acids Res., 19, 2241–2245. Bairoch, A. (1994) “The SWISS-PROT protein sequence data bank: current status.” Nucl. Acids Res., 22, 3578–
8