Cytometry Part B (Clinical Cytometry) 70B:29–38 (2005)
Technical Notes
Enumeration of Peripheral Lymphocyte Subsets Using 6 vs. 4 Color Staining: A Clinical Evaluation of a New Flowcytometer Claude Lambert,* Iobagiu Cristina, and Genin Christian Immunology Laboratory, University Hospital of St Etienne, France
Technological advances in instruments allow the evaluation of many lymphocyte subsets in one step. The aim of this study was to evaluate the new FACSCanto flowcytometer in routine conditions, using a 6 color combination, single platform, whole blood, lysis, no wash protocol. Methods: Two systems were simultaneously compared on 67 blood samples and external quality controls, using CD3,CD4, CD8, CD19, CD16/56, and CD45 in one tube TRUCOUNT beadsTM (BD Biosciences) or two tubes (TetraChromeTM and FlowcountTM, Beckman-Coulter and DakoCytomation). Results: The day-to-day instrument detection but automatic compensations were stable. Manual compensation settings were satisfactory using available facilities. Commercial and UK NEQAS quality control results were acceptable. The intra-experiment reproducibility was good (coefficient of variation (CV) 0.87) and absolutes values were very close (slopes > 0.89). The gating strategy, fluorochrome choice, and compensation setting are discussed. A few improvements are expected (sample loader, data management, auto-gating, acquisition parameters, sample mixing, absolute values calculation, etc). In conclusions, despite its complexity, 6 color staining is a reliable, stable, and highly informative technique for lymphocyte subset monitoring but remains to be optimized. q 2005 International Society for Analytical Cytology
Key terms: T cell subsets; 6 color flowcytometry; quality assurance; routine analysis; immune monitoring
Evaluating the cognate immune response is usually restricted to the CD4þ and CD8þ T(CD3) cells count in routine practices (1). Because the use of CD45 is recommended (2–4) to improve leukocyte identification (5,6), analyzing more subsets with the 4 colors available requires a second combination including CD3, CD19, and CD56 (7), unless mixing antibodies with improbable coexpression (8). This increases cost and time consumption. Furthermore, recently described unconventional T cell subsets (9–19) are not available for clinical evaluation. In routine practice, processes are reduced to a one-step procedure using whole blood, premixed antibodies, internal standard, red blood cell lysis, and no wash significantly impairs the quality and reproducibility of labeling. Standardization of instrument settings and gating strategy have been achieved for 4 color systems as assessed by independent (UK NEQAS Assessment Schemes for Leukocytes Immuno-phenotyping (20–23)) or commercial (Interlaboratory Quality Assurance Program; Beckman-Coulter (24)) international quality control surveys.
q 2005 International Society for Analytical Cytology
The recently available 5/6 color systems give much more information in one single tube test but have not yet been optimized, standardized, and validated in routine conditions (25). The aim of this study was to evaluate the new FACSCanto in routine conditions, for T, B, and NK lymphocytes evaluation, using a 6 color labeling, lysing, no wash, and single platform procedure. PATIENTS AND METHODS The FACScanto (BD Biosciences, San Jose, CA) instrument stability was analyzed daily using 7-color SetUpTM Beads (BD Biosciences). *Correspondence to: Dr. Claude Lambert, Immunology Laboratory, Hoˆpital Bellevue, CHU St Etienne, F 42055 St Etienne Cedex 2, France. E-mail:
[email protected] Received 24 August 2004; Accepted 20 June 2005 Published online 13 December 2005 Wiley InterScience (www. interscience.wiley.com). DOI: 10.1002/cyto.b.20072
30
LAMBERT ET AL.
The exactitude and stability of cell count was tested using international quality controls purchased from UK NEQAS LI (Sheffield, UK) and Immuno-TrolTM (BeckmanCoulter Fullerton, CA). The day-to-day reproducibility, sample stability, and count accuracy were evaluated using fresh blood from routine practice (21F/46M aged from 16 to 79 (50 6 14.7)). Patients came from HIV (n ¼ 22), renal transplantation (n ¼ 42), pediatric (16 year old), or dermatology (n ¼ 2) departments. Lymphocytes were immunolabeled using a combination of CD3-fluorescein isothiocyanate (FITC, IgG1, clone sk7), CD16-phycoerythrin (PE, IgG1, Clone B73.1), CD56PE (IgG1, Clone NCAM 16.2), CD45-peridin chlorophyl protein (PerCP, IgG1, clone 2D1), CD4-PE-Cyanin7 (PECy7, IgG1, clone SK3), CD19-allophycocyanin (APC, IgG1, clone SJ25C1), and CD8-APC-Cyanin7 (APC-Cy7, IgG1, clone SK1) and TRUCOUNT beadsTM (BD Biosciences), according to manufacturer’s recommendations. From 2 to 10 mL of each antibody were distributed in Trucount tubes. Then, an exact volume (i.e. 50 mL) of (EDTA added) fresh peripheral blood (within 4 h after withdrawal) was added, gently mixed, and incubated for 20 min at room temperature in the dark. The lysis and fixation were obtained by adding 500 mL of FACSLysing solutionTM (BD Biosciences). Samples were analyzed within 1 h on a FACScanto (BD Biosciences). The new system was compared with our reference system by analyzing simultaneously the same samples using CD3-PE-Cyanin 5 (PE-Cy5, clone UCHT1), CD4-PEtexas red (PETR, clone SFCI12T4D11), CD8a-PE (clone SFCI21thyD3), and CD45-FITC (clone B3821F4A) (TetraChromeTM, Beckman-Coulter) and CD16-FITC (IgG1, clone DJ130c, DakoCytomation, Copenhagen, Denmark), CD56-PE (IgG1, clone N901, Beckman-Coulter), CD19 PE-TR (clone 89B Beckman-Coulter) and CD3 PE-Cy5 (clone UCHT1, DakoCytomation), 10–20 mL, on 100 mL of blood in the same conditions. Lysis and fixation was performed using ImmunoprepTM on T-Q prepTM (Beckman-Coulter) before adding FlowcountTM beads (Beckman-Coulter) and analysis on EPICS XL flowcytometer (Beckman-Coulter). Instrument setting on FacsCanto were performed using fresh blood in nine tubes (unlabeled, six single labeled, six isotype controls and the mixed antibodies), with Facslyse/no wash procedure using FACS DivaTM calculation facilities (BD Biosciences). Detection and compensation stability were tested daily using SetUpTM beads and FACSCantoTM Software (BD Biosciences). On Epics XL system, compensations were recalculated weekly, using a standardized procedure (Cyto-compTM, Beckman-Coulter). Dot plots were analyzed using FACS DivaTM (BD Biosciences) or Coulter Epics System IITM (Beckman-Coulter) softwares, respectively, using similar gating: CD45 vs. Side scatter identification, except for B and NK cells on XL system where a (Forward/Side scatter). On XL system (TetraoneTM), lymphocytes were further selected on FS/SS excluding dead lymphocytes, which number could be significant in delayed analyses. T and B cells were selected on CD3þ or CD19þ/SS lymphocytes. CD4þ and CD8þ were
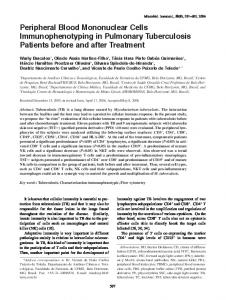
analyzed on CD3þ and NK (CD16/CD56) on CD3-lymphocytes. On Epics XL, all the gates were mathematically defined by the software. Absolute values were calculated manually from FACSCanto (10,000 lymphocytes events) and automatically on Epics XL (minimum of 7,500 lymphocytes and 1,000 bead events, maximum 300 s analysis). Statistical analysis was performed using paired or unpaired student’s t test, linear regressions, and BlandAltman plot on Excel (Microsoft, USA) and expressed as mean 6 1SD. Coefficient of variations (CVs) were calculated as 1SD/mean. RESULTS The mean waiting time for the sample analysis was 3 min (i.e. 27 min for tube number 10), sufficient to allow cell sedimentation. Because samples are not properly vortexed just before acquisition, less than 10 samples were analyzed in each run. Stability of the Instrument Analysis of standard beads differed significantly from the manufacturer target values (first data on Fig. 1a) but were highly stable over a period of 3 months (CVs from 0.50 to 0.90% for the blue laser and 1.4 to 1.9% for the red laser) after exclusion of four aberrant values because of transient fluidic problems. Results were not influenced by operators. Six Color Compensation Setting The automatic compensation settings available on FACScanto software appeared not stable on daily setting of SetUpTM Beads (Fig. 1b) over 3 months (CV from 2.4 to 22%) and occasional aberrant settings occurred. Furthermore, unexpected compensations were required (i.e. between two lasers; Table 1). Lymphocyte 6 Parameter Protocol Setting Sample analyses with automatic compensation settings were not satisfactory. Manual compensations were set up using DIVA software facilities, but this was difficult because the FACSlysis/no wash procedure gave big debris and poor signal-over-noise ratios, making lymphocytes difficult to select on a FS/SS dot plot. Alternative procedures, such as lyse-and-wash or anti-IgG coated beads devoted to compensation settings (i.e. CompBeadsTM, BD Biosciences), were not acceptable for lyse/ no wash protocols. Final settings gave good definition of leukocytes (Fig. 2a), B cells (Fig. 2b), CD3þ T cell subsets (Fig. 2c), and NK cells (Fig. 2d). To simplify and to secure the antibody distribution, premixing of antibodies for 50 samples was found to be stable for a few days without any reagent interference when compared with antibodies distributed individually in the tube (results not shown) and were subsequently used.
31
LYMPHOCYTE MONITORING WITH 6 COLOR FLOWCYTOMETRY
FIG. 1. Standardized 7 color setup beads (BD Biosciences) were analyzed everyday for 3 months using FACSCanto Software. One out of three results is plotted, showing highly stable results except on fluidic instability events that were repaired. Automatic compensations analyzed everyday for 3 months were not very stable for unexplained reasons. [Color figure can be viewed in the online issue, which is available at www.interscience.wiley.com.]
Exactitude Using International Quality Controls The analysis of ImmunoTrol (lot 758734) results were good for T cells and poor for B and NK cells when compared with
the XL results and target values provided by the manufacturer (Table 2). Overall, the FACSCanto absolute values were higher than Epics XL values as reported in the NEQAS survey.
Table 1 Compensation Matrix: Mean of Compensations Automatically Calculated Using 7 Color Setup Beads and FACSCanto Software, Over a Period of 3 Months FITC FITC PE PerCP PerCP Cy5.5 PE-Cy7 APC APC-Cy7
18.8 6 0.44 2.4 6 0.30 2.4 6 0.30 0.27 6 0.02 0.01 0.0
PE
PerCP
PerCP Cy5.5
0.96 6 0.16
0 0.07 6 0.05
0 0
14.7 14.7 1.4 0.09 0.01
6 6 6 6 6
1.2 1.2 0.11 0.08 0.02
8.7 6 0.52 6.8 6 0.82 0
21.2 6 1.3 3.9 6 0.8 2.9 6 0.27
PE-Cy7 0.13 1.6 4.5 4.5
6 6 6 6
0.02 0.14 0.37 0.37
0.05 6 0.03 2.4 6 0.24
APC
APC-Cy7
0 0 0.9 6 0.10 0.9 6 0.10 0.16 6 0.02
0 0 6 6 6 6
0.5 0.5 5.6 21.1
0.14 0.14 0.75 3.6
2.8 6 0.61
The highest corrections were FITC on PE; PR on PerCP; PerCP on PE-Cy7 and APC; PerCP-Cy5.5 on PE-Cy7 and even APC and APC-Cy7; and APC-Cy7 on APC. Results were not much stable with high standard deviations (in bold), especially for PE on PerCP; PerCP on PE-Cy7, APC and APC-Cy7; PE-Cy7 on APC-Cy7, APC on APC-Cy7 and APC-Cy7 on PE-Cy7 and APC.
32
LAMBERT ET AL.
Similarly, two (number 154 and 155) NEQAS sample analyzes were graded satisfactory (within 2 standard deviations) even if lower than Trucount mean values (FACSCalibur) and closer to the Flowcount (Epics XL) mean values (Table 3). B cell data were in line with the rest, but NK cell data were much lower than what was reported on all systems. The global data had a large intercenter variability (global CV > 20%). Reproducibility of 6 Color Lymphocyte Analysis Because sample preparation steps are crucial for absolute value determination, the reproducibility of the system was tested on 5 repeats, on the same day, by the same operator. A poor reproducibility was obtained on the two (154 and 155) NEQAS samples (Table 3; Fig. 3a) possibly because of difficulties to gate leukocyte populations after stabilization process of the samples. Results on fresh samples were better (Fig. 3b), especially after improving operator-dependant factors (specially by proper sample mixing, wiping the tip, reverse pipetting, and using a calibrated, fixed volume, electronic pipette). The CVs dropped from 12 to 3% and were correct for B and NK even in one severe CD4þ lymphopenia (3 cells/mL, CV ¼ 17.9%; patient 6). The importance of managing operator-dependant parameters was confirmed by analyzing one fresh sample by six different operators (one biologist, two residents, two technicians, and one student technician) in triplicates. The results show good reproducibilities: CD4þ T (CV from 1.6 to 9.7%), CD8þ T (0.7 to 8.1%), B (0.5 to 6.3%), and NK (1.2 to 8.3%) cells (Fig. 3c). Three operators had CVs below 2% for CD4þ T and B cells. The reproducibility over the time was good on NEQAS samples one day after the first analysis (Fig. 3a). On a longer term, Immuno-Trol (lot 758734) daily analysis by different operators (26 repeats over a 8-week period; Fig. 4) was highly stable (CD4þ T cells CV ¼ 4.5%; CD8þ T cells CV ¼ 8.8%) excluding one value (performed by a neophyte operator). Results were comparable to our previous data (Flowcount system, 25 repeats: CVs 8.6% for CD4þ T cells and 9.3% for CD8þ T cells). The B and NK cell counts had poor reproducibility (CV: 21 and 11.1%, respectively; tested on Trucount only). Stability of Samples Because samples may not always be analyzed within 4 h of withdrawal, we analyzed the stability of samples kept at 48C over 6 consecutive days. The cell numbers on day 0 (973 and 660 CD4þ T cells/mL and 774 and