May 13, 1996 - Indicators sustainable development general systems assessment. Download to read the full article text. Export citation .RIS Papers Reference ...
Environmental Modeling and Assessment 1 (1996) 101-117
101
Environmental and sustainability indicators and the concept of situational indicators. A systems approach Gilberto C. Gallopin Centro lnternacional de Agricuitura Tropical ( CIAT), A.A. 6713, Call, Colombia E-mail: g.gallopin(~cgnet.com Received 11 January 1996; revised 13 May 1996
Through a systems approach indicators are shown to have the nature of variables, adopting different values or states, while other associated terms allude to special meanings assigned to specific values of the indicators. Practical implications are discussed. The concept of situational indicators of sustainability is introduced, representing a non-numericul function of both "pressures" or "driving forces" and "state" variables. A cost-effective mniti-tiered approach to situational indicators is proposed. The concept of situational indicators is shown to be a particular case of indicators of systems behavior. A general systems formulation of the problem of sustainability highlights the importance of indicators of systems behavior and the central role of models in their definition. Keywords: Indicators, sustainable development, general systems, assessment.
1 Introduction Demand for definition and utilization of environmental indicators and indicators of sustainability for national and international decision-making is growing rapidly. One of the reasons is the commitment to foster sustainable development made by the governments at the Earth Summit of 1992 in Rio de Janeiro. The need to monitor progress and to assess the effectiveness and impact of policies is going to increase rather than decrease in the next years. Many international organizations are working on the subject including intergovernmental ones such as the United Nations Commission on Sustainable Development (UNCSD), the United Nations Environmental Program (UNEP), and the Organization for Economic Cooperation and Development (OECD), international banks such as the World Bank, international NGOs such as the World Resources Institute, international scientific organizations such as the Scientific Committee on Problems of the Environment (SCOPE), and some international research centers, such as the Centro Internacional de Agricultura Tropical (CIAT). At the same time, many national and subnational efforts are being made to develop indicators relevant at different subnational scales. It is already clear that national and international economic, political and financial decisions will be made (and in some cases have already been made) on the basis of those indicators. An international political process to reach consensus and define a common framework on indicators of sustainable development, led by the UNCSD, is currently gaining momentum. 9 Baltzer Science Publishers BV
Initially at least, most environmental and sustainability indicators wiU be constructed using the information that is readily available, or can be made available at a reasonable cost. This means that indicators are unavoidably biased, at least in two senses: availability of information is much greater in the industrialized countries that in the developing countries, and a large portion of the information routinely collected and reported belongs to the economic and social realms, implying that environmental factors are under-represented. The cost of gathering and processing additional relevant information may become a constraint in many countries and subnational institutions (not only the poorest ones). This makes it all the more important to avoid any unnecessary narrowing of options when defining potential indicators, and particularly when trying to identify a common set of indicators for international action. This paper attempts to show that prevailing thinking on environmental and sustainable development indicators is unnecessarily restrictive, carrying the risk that relevant alternatives will be foreclosed by too narrow a definition ofthe concept of indicator. Another aspect is that current definitions of indicators and the use of terminology in this area are particularly confusing [4]. Some clarity and consensus is required about the definition of what an indicator is, as well as in the definition of related concepts such as threshold, index, target, and standard. This consensus cannot be just based on political agreement; logical and epistemological soundness is also necessary. This requires analyzing the fundamental nature of the concept of indicator, and separating the semantic from the syntactic and the pragmatic aspects. In this
102
G. C. Gallopln / Environmental and sustainability indicators
paper, a systems approach to the definition of indicators is developed, and the concept of situational indicators is defined and shown to be a particular case of the notion of indicators of system's sustainability.
2 What are indicators?
Different authors define indicators differently (and in a number of cases the same authors define indicators in different, sometimes contradictory ways). The problem arises not only within the specifics of the environmental issues, but it reflects ambiguities and contradictions regarding the fundamental meaning of the concept of indicator in general. As pointed out by Adriaanse [1], indicator derives from the Latin verb indicare, whose meanings include: to point out, to indicate, to announce, to give notice of, to determine and to estimate. Obviously, this refers to the function or purpose, but not the nature, of an indicator. It is also clear that those meanings are not synonymous. Some specific definitions of indicators in the literature include: a variable "hypothetically linked to the variable studied which itself cannot be directly observed" [I0]; a "measure that summarizes information relevant to a particular phenomenon, or a reasonable proxy for such a measure" [31]; "a parameter, or a value derived from parameters, which points to/ provides information about/describes the state of a phenomenon / environment / area with a significance extending beyond that directly associated with a parameter value" (OECD [34], which also defines "parameter" as "a property that is measured or observed"); "a measure of system behavior in terms of meaningful and perceptible attributes" [27, p. 106]. A wider survey of publications on environmental indicators shows even more meanings assigned to the concept. An indicator has been defined as a variable [10;27, p. 53], a parameter [4,34], a measure [15;27, p. 106;31 ;40, p. 80]; a statisticalmeasure [41]; aproxy for a measure [31], a value [4,34], a meter or measuring instrument (implied by Adriaanse [1, p. 7] in his example of the clock and the thermometer as indicators); a fraction comparing a quantity (the numerator) with a scientifically or arbitrarily chosen measure (the denominator) [1]; an index (implied by Hammond et al. [26, p. 8] when they call the W R I ' s green-house index an indicator); a subindex or component of an index ([35, p. 8]; implied by Adriaanse [1], and by Hammond et al. [26, p. 16]); "something" [26]; a piece o f information [4]; a single quantity derived from one variable and used to reflect some attribute [35, p. 8]; an empirical model of reality [26]; a sign [30]. Part of the confusion and contradictions may be attributed to different use of terminology in different disciplines. As Ott [35, p. 8] points out, in mathematics the term "variable" usually refers to some attribute of
interest which takes on different values while in the environmental professions the word parameter has come into common usage as a substitute for "environmental variable". However, this still leaves us with a wide assortment of terms such as variable, measure, quantity, value, index, fraction, etc., all of which cannot logically be applied to the same referent (at least not in the same context). Of course, one could say that anything that fulfills the functions subsumed under indicare is an indicator. However, besides the operational and communicational difficulties between different researchers and different users, we will still need some way of determining what is not an indicator. Recent efforts on environmental and sustainable development indicators have concentrated on developing concrete indicators, as well as frameworks (such as the Pressure-State-Response Approach [1,33], and in trying to approach some convergence in the international arena. In the exploratory phase, ambiguity could have served a purpose by keeping options open to alternative explanations. However, as I hope to show later in this paper, this process also risks to narrow the search by foreclosing potentially important options. The examples above also suggest that there is a need to develop a more unified, generic and rigorous definition of indicators. It is clear that, in its most general sense, an indicator is a sign. In semiotics (the general theory of signs), a sign is defined as "something which stands to somebody for something in some respect or capacity" (Marcus [30], citing the father of Semiotics, Charles Sanders Peirce). The concept of indicator, as something that points out, or stands for, something else, is clearly a particular form of the concept of sign. One significant result of Marcus' semiotic analysis of indicators is the legitimacy and possibility of qualitative indicators (absent in all prevailing definitions of environmental or sustainability indicators). Given that this paper concentrates on the concept of indicator as relevant to sustainable development and environmental quality, that is, indicators that can be used to assess how complex ecosystems and socio-ecological systems (systems including social, economic and ecological subsystems [23]) are responding, a system approach seems more appropriate and operational than a broader semiotic or than a purely mathematical approach. This is what I will attempt to develop below.
3 Indicators and general systems
This section is intended to provide some of the basic conceptual elements upon which the discussion on the nature of indicators and some of the practical implications of the general systems theoretical analysis will be developed.
G. C. Gallopin / Environmental and Ju~tainability indicators
A system is an abstraction defined by an observer/ investigator upon a portion of the world (sometimes [29] called an "object"). Given that any part of the real world has an unlimited number of properties, each of which could be of interest according to some viewpoint, any investigation must limit its scope to a selected number of attributes (qualities, characteristics, properties) which best represent the studied aspects of the object and are considered adequate for the purposes of the investigation. Each attribute is always associated with a set of possible appearances (manifestations). For instance, if the attribute is the relative humidity at a certain place in the Earth, the set of appearances consists of all possible values of relative humidity (defined in some specific way), in the range from 0% to 100%; if the attribute considered is the color of a traffic fight, the appearances are red, yellow, and green. In each observation, the observed attribute takes on a particular appearance; to be able to determine changes in the appearance of the attribute (or the absence of changes) multiple observations of the attribute are needed, and some property must be used to distinguish between each of the observations. The basic kinds of distingnishing properties are time, space, and population; those could be combined. Thus, one could measure a given attribute at different times, at different locations (defined in the three-dimensional Euclidean or any other space), and in diferent individuals or subpopulations of some population. At its most basic level, a system is defined as a set of attributes, a set of distinguishing properties, and a set of appearances for each attribute and distinguishing property. The term "system", even at this most primitive level, is thus always viewed as an abstraction - or an image - of some aspects of the object and not as a real thing. Further specification of a system implies assigning a variable to each attribute and to each distinguishing property selected. A variable is then an operational representation of an attribute of the system; in other words, it is our image of an attribute defined in terms of a specific measurement or observation procedure. Each variable has a name or label distinguishing it from all other variables under consideration, and is associated with a particular set of entities through which it manifests itself [29]. These entities are usually referred to as states (or values) of the variable; the whole set of possible states is called a state set (note that the meaning of value in this case is different from the axiological one implied, e.g., in "value judgement"). The definition of a variable as an image of an attribute of the system implies assigning elements of the set of appearances of the attribute to values of the state set of the variable. The operation of assignation is somethnes called an observation channel [29]. Generally, an
103
observation channel consists of a physical device (usually called a measuring instrument or meter) and a procedure describing its use. The procedure is a set of instructions which specify how to use the instrument under various conditions. The term "measuring instrument" can be given a broad interpretation. In some areas such as psychology, ethology, the social sciences, the investigator him/herself functions as the instrument (making observations). In some cases, questionnaires or tests are used to measure attributes such as opinions, attitudes or abilities of people. Any measuring instrument must be able to interact with the measured attributes and must convert the interaction into some form which directly represents states of the corresponding variable (e.g., a pointer on a scale, digital display, graphical record, or a written description). Further specification of the system implies obtaining data, actual measurements or observations of the values of the variables at different times, locations, populations, or combinations ofthese.
4 Semantic status o f indicators
On the basis of the above discussion it seems natural to define indicators as having the nature of variables (not "values"). The particular pragmatic interpretation of a variable as indicator is usually made on the basis that such a variable conveys information on the condition and/or trend of an attribute (or attributes) of the system considered, information that is important for the purposes of decision-making at some level. At a given level of aggregation or of perception (such as local, national, regional, or global), indicators can be defined as individual variables or as variables that are a function of other variables. The function may be as simple as a ratio (including the concept of index number relative to some base value), an index (a single number which is a simple function of two or more variables, usually a summation of individual variables, a multiplication, or a maximum operation [35]), or as complex as the outcome of a largo simulation model. Thus, as recognized by Tunstall [42], indicators can range from the simplest variable (a simple measure of dissolved oxygen in freshwater ecosystems can be a good indicator of one of the conditions needed to support aquatic life) to complex, aggregated functions. A proxy in the context of indicators can be defined as a variable assumed to be correlated (or otherwise linked) to some attribute which is not directly observable (or, for some reason- cost, etc. - is not directly observed or measured). Any indicator can adopt different values or states. Some of these values are given special significance, and are often allocated a subjective value judgement. They include the terms thresholds, standards, norms, targets, reference values and benchmarks.
104
G. C. Gallopin / Environmental and sustainability indicators
While each of those terms can have different meanings, they are not interchangeable. In the context of sustainability indicators, standards and n o r m s are rather similar, referring in their fundamental aspect to any value or state established as desirable by authority or societal consensus ("a means of determining what a thing should be" [32]). Sometimes, standard is also used in a less normative sense, as in "something set up and established by authority as a rule for the measure of quantity, weight, extent, value, or quality" [32], as a technical reference value. In this sense, a standard becomes similar to a benchmark (defined as "something that serves as a standard by which others may be measured or judged", or as "a point of reference from which measurements may be made" [321). Targets, on the other hand, allude explicitly to intention, representing a specific value (or set of values) to be achieved. The target is set in the context of a decisionmaking process and is expected to be achievable. Progress towards the targets should be measurable or observable. Adriaanse [1] uses the term target and goal interchangeably, while Tunstall [41,42] and the World Bank [40] differentiate between goals and targets. In the general usage as well as in theories of organizations, goals are usually rather qualitative terms indicating a general direction rather than a specific state, the end towards which effort is directed (e.g., improving environmental quality, mitigating poverty). Finally, thresholds are of a more technical nature. They represent values or a set of values "above which something is true or will take place and below which it is not or will not" [32]. A threshold may be, e.g., the concentration of a pollutant above which health damages become measurable, or the erosion level above which soil degradation becomes irreversible. Besides the possible choice of proxies as indicators already discussed, various authors, in one way or another, emphasize that indicators have a significance besides their face value, or a significance extending beyond that what is directly obtained from observation [1,4,26,34,40,41]. Closely connected, but not identical is the statement that "a policy indicator must be regarded as an empirical model of a certain reality and not the reality itself" [1,26]. This is certainly true at the basic level; as discussed before, from a general systems theoretical approach a system and all of its components are abstractions of reality and not reality itself. At the most primary level, the attributes and distinguishing properties (and the variables defined upon them) chosen to represent a system are assumed to characterize the aspects of interest of the selected portion of reality (the object) according to a certain viewpoint. In this sense, any variable "indicates" an attribute, it is not the real attribute of a real object.
H o w closely the variable reflects the attribute, and how meaningful and relevant for decision-making is the chosen attribute, is a question related to the expertise and insight of the investigator, as well as the purpose and constraints of the investigation. In this context, any variable (and therefore any indicator, whether "descriptive" or "normative") has a significance besides its face value, or beyond what is directly obtained from observations. The significance of the variable, or of its values, arises from the interpretation made about them, assigning a meaning to the variables. Obviously, a variable that is associated to an attribute of fundamental interest for decision-making, or to a cluster of such attributes, or that simplifies or summarizes a number of important properties, is more useful as an indicator than a variable that is associated to a superficial or isolated characteristic of the studied system. But this represents a pragmatic 1, rather than a semantic 2 distinction.
5 Practical implications The different situations and purposes associated with the use of environment indicators or of indicators of sustainable development (availability of data in different countries, types of users, cost of collecting indicators, kinds of attributes represented- biophysical, economic, social, cultural), point to the convenience of avoiding the use of a conception of indicators that is unnecessarily restrictive. This does not deny the importance of political consensus on the types of indicators selected (even if only for reasons of comparability), but it emphasizes the value of keeping alternative options open. This is not only for scientific or theoretical reasons, but also for practical reasons. A set of practical implications, derived from the general systems theoretical enquiry into the fundamental nature and properties of indicators follows.
5.1 Feasibility o f non-numerical indicators Practically all definitions of environmental or sustainable development indicators rule out the possibility of qualitative indicators, by restricting the concept to numerical variables, either explicitly or implicitly [1,4,26,27,34,35,40,45]. Indeed, it is maintained that one of the essential functions of indicators is to quantify. However, as put by Ashby [2]: "'The worker with some training in mathematics can easily fall into the habit (or t
Involving the relationships of signs to things other than signs by which some use is ascribed to the signs. 2 Involving the relationship of signs to things other than signs by which a meaning is given to the signs (e.g., words, variables) but without reference to their use.
G. C. Galiopin/ Environmentaland~tainability indicators
trap) o f thinking that a 'variable" must mean a numerical scale with an additive metric. This assumption is quite unnecessarily restrictive, sometimes fatally so. The meteorologist has long worked with his five 'types of cloud; the veterinarian with the various "parasites of the pig', the hematologist with the four basic types of "bloodgroups'. Modern mathematics ... is quite able to handle such variables, which are often unavoidable in behavioral sciences. "" In principle, an indicator could be a qualitative (nominal) variable, a rank (ordinal) variable, or a quantitative variable. In general, the set of appearances of a selected attribute may or may not be presumed to have some relevant properties. Those are represented by some mathematical properties in the set of states or values of the variable defined upon the attribute. When no relevant properties are recognized in the set of appearances and therefore no mathematical property is recognized in the state set of the variable, the variable is a nominal scale variable. Variables such as blood type (with the state set composed of {A, B, O, AB}), and color of a trafficlight {green, yellow, red} arc obvious nominal variables. Sometimes, the presumed properties of the set of appearances of the attribute can be represented by the property of ordering in the state set of the variable. Those variables are called ordinal or ranking scale variables. Examples of ordinal variables are employee rank in a hierarchy, genealogic position (being a descendant of), and many subjective estimations of degree of risk. Finally, the property of having a measure of distance between pairs of elements of the set involved may be assumed. Variables whose state set is associated with a metric or distance are often called metric variables. (Metric variables may be measured or observed in an interval scale when the distances between any two values are of known size, but the zero value is arbitrary such as in the case of dates, temperature - or in a ratio scale when the distances between any two values are known and in addition there is a true zero point, such as in the case of weight, mass [5,36].) The concept of "indicator species" [6] has long been used in ecology, denoting a species or an ecological community so closely associated with particular environmental conditions that its presence is indicative of the existence of these conditions. For example, greasewood indicates saline soil; mosses often indicate acid soil; Tubifex worms indicate oxygen-poor and stagnant water unfit to drink. Changes in species composition, or the presence/absence of single species, can indicate changes in environmental conditions and often also the direction of the changes (improvement or degradation). These can be used not only locally, but sometimes regionally (e.g., in regional seas). Situational indicators, to be discussed later, are also instances of qualitative indicators. -
105
Qualitative indicators may be preferable to quantitative indicators in at least three different situations: (a) when quantitative information is not available; (b) when the attribute of interest is not inherently quantifiable (as is the case of many cultural or political attributes); and (c) when cost considerations become determinant. The search for relevant qualitative or rank indicators at the national, international and global levels should be part of the research agenda on indicators of sustainable development. 5.2 Indicators should be selected at different hierarchical levels of perception Sometimes it is assumed (or stated) that indicators must be built by aggregation of lower-level data or variables [26,35,40]. This position is most vividly illustrated by Hammond et al.'s "information pyramid" going up from 'Primary Data' to 'Analyzed Data' to 'Indicators' and topping with 'Indices'. For these, "indicators and highly aggregated indices top an information pyramid whose base is primary data derived from monitoring and data analysis" [26]. Ott [35] presents an excellent description and discussion of the theory and practice of aggregating environmental variables. While this approach is perfectly adequate and rather standard for building up national economic indicators, making it a general requirement is an unnecessary restriction that would eliminate from consideration potentially important indicators. Consistently with the conception of indicators as variables representing attributes of a system, different indicators may be directly defined as single variables at different levels of organization of the considered system (local, national, regional, global). Different kinds of indicators may be relevant at different scales (and less relevant or even meaningless at others [ 18]). Hierarchical systems theories show that different indicators of systems performance are usually required at different hierarchical levels of the system (as well as by different levels in the hierarchy of users), and aggregation across levels is not always possible nor meaningful [19]. For instance, an indicator of the number of national environmental protection laws passed is not obtained from the aggregation of the local (municipal, etc.) laws up to the national level. The indicator of the stratospheric ozone layer depletion was obtained directly from satellite observations at the global or regional (Arctic/ Antarctic) levels, not through the averaging of individual observations all over the globe. As the technology of remote sensing and geographical information systems (GIS) advances, more and more indicators will be generated directly at the scale of interest. A fruitful line of research could be developed around the question of which indicators are appropriate at dif-
106
G. C Gaiioptn / Environmental and sustainability indicators
ferent scales, and which of them can be obtained directly and in a cost-effective way at the scale of interest. 5.3 Indicators m a y be scalars or vectors
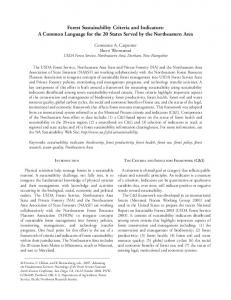
In abstract terms, a state is "any well-defined condition that can be recognized if it occurs again" [3, p. 25]. So far I have been alluding to the well-defined properties simply as the values that a variable can take. However, the term can be used at different levels, and so we can speak of states of individual variables, the state of a whole system [9], or the state of a subsystem of the system. In such a case, the state of the whole (or of the subsystem) is given by a list of the states taken, at that moment (or at that instance of the overall set of distinguishing properties), by each of the parts (or individual variables). Such a state is a vector, defined as a compound entity, having a definite number of components. It is by convenience written: (al, (22. . . . , an) which means that the first component has the value ah the second a2, and so on. A vector is a natural generalization of "variable" [3, p. 31]. A vector may adopt numerical values (e.g., the variable "position" for a ship cannot be described by a single number; "position" is a vector with two components, one for latitude and the other for longitude), but it may also adopt non-numerical values (e.g., a population census form represents a vector for each person - last name, first name, age,...). In the case of numerical variables, a vector is usually defined as an ordered n-tuple (sequence or ordered set) of numbers (al, a 2 , . . . ) and it represents a point in Cartesian space. By contrast, a scalar is a quantity defined only by its magnitude (i.e., its state or value is not compound). This marks a fundamental difference between environmental indices and "environmental prof'des". A number of indicators presented at the same time to give a picture of environmental conditions (but not aggregated together) is defined as an "environmental quality profile" by Ott [35, p. 8]; see figure 1 for an example. An environmental quality profile (or in general, an environmental profile) is a vector. By contrast, an index is a scalar (a single number generated by aggregation from two or more values). One of the earliest comprehensive environmental prof'des was proposed by Dansereau [12,13]. He uses a circular diagram (the "environmental quality roulette" or "environmental pie") divided into 32 sectors each corresponding to an environmental component. For each component, four levels are distinguished: deprivation, necessity, fulfillment, and surplus. A similar approach has been used by Buguicourt [8] in an assessment of the most pressing needs oftbe majority of the African population (figure 2). Note that in both approaches the individual variables can adopt values within an ordinal (rank) scale. A quantitative prof'de methodology is represented by the Dutch A M O E B A approach [39]. The individual
Figure I. Environmental quality prot'de in 1976 for the U.S. Environmental Protection Agency's Region X, which includes Alaska, Oregon, Washington and Idaho (redrawn from [35D. Note that in this case the variables can adopt values from a nominal/qualitative scale or an ordinal scale, according to interpretation.
variables represent the results of comparison between the current ecosystem state and the reference situation (an undisturbed area) for 32 plants and animal species in the Dutch part of the continental shelf (figure 3). Values higher than the reference are plotted outside the circle representing reference values, and values lower than the reference are plotted inside. An objective (or target) profile can be superimposed upon the current state. The difference between indices and profiles is also apparent from the viewpoint of the users. This is called the "classic dichotomy" of views towards indices: one viewpoint prefers the data in the most complete form possible (environmental profile) but is willing to accept the resulting complexity, while the other viewpoint prefers the data in as simple a form as possible (an index), but is willing to accept the distortion introduced in the simplification process [35]. It should be noted that the profile is by itself an indicator, a variable that is a vector. The individual component variables are ordered, often linearly or radially. Therefore, profiles provide information not only on the values of the individual variables included, but also a Gestalt view of the whole. This holistic function of profiles raises a research question related to human perception that has not been given much attention: that of what is the best structure of the profile in terms of apprehension of the total pattern. An advantage of conceiving the profiles as vector indicators is that the mathematical tools of abstract algebra and vector analysis can be applied to make holistic comparisons and inferences. One of the problems more relevant to decision- and
G. C. Galiopin I Environmental =ndsu~tainab ility indicators
1 No Problem
3 Problem of Some Importance
2 Minor Problem
4 Serious Problem
107
5 ExtremelyGrave Problem
Figure 2. Buguicourt's diagram of the basic needs problems in Africa (redrawn from [8]).
policy-making is that of selecting values out of a set of decision variables so as to maximize (or minimize) an objective (or set of objectives) subject to a set of constraints. Single-objective problems are dealt with by classical mathematical programming techniques. However, in the area of the environment and sustainable development multiple, often conflicting, objectives are common. A vector indicator suggests (or embodies) a set of objectives. The problem of optimizing the values of a (quantitative) vector indicator, as opposed to a scalar one, leads directly to the multi-objective problem. Many techniques have been developed for solving multi-objective
programming problems [11,16,25,43]. One approach, goal programming, seems particularly applicable to environmental and sustainability indicators. The procedure sets a target for each goal but, rather than forcing strict compliance, it seeks to minimize the deviations between the achievement of the goals and their target levels. In this way, trade-off among goals can be taken into account. Optimizing a vector indicator may imply that the achievement should be equal to or greater than the target for some of its dimensions, equal to or less than their targets for other dimensions, and as close as possible to their target for still other dimensions.
108
G.C. Gallopin/ Environmentalandsustainabiflty indicators
Habour Porpoise Common Suljl~--"l Sandwich Tam
Dolphin
Phaeocysti / Lettuce gas annel Wrack
r
Dunlin
I~ea Grasses
Oystercatcher Eider
Salt Marshes
Brant Goose
i Coskle beds (undisturbed)
Guillemot Wild Mussel beds Fulmar Petrel
Baltic Tellin
~
Herring
Lobster
h
Sand Gaper rimp n Dog Whelk
Plumose Anemone
Figure 3. The "Amoeba"system.The distancefromthe centerto the circlerepresentsthe referencenumbers.The amoeba-likefigurerepresents the currentnumbers(redrawnfrom[39]). While many of those approaches suffer from the weakness of asumption oflinearity, they can be very useful in operationalizing composite indicators. 5.4 The need to address interlinkages
Indicators are operational representations of attributes. The attributes (and the indicators) are chosen to describe the evolution of the system of interest and/or to assess performance in relation to some targets or goals. The choice of attributes is, of course, a critical step;
the ideal set of indicators is the minimal set that represents the phenomena of interest in a way that is both comprehensive and amenable to decision-making. Thus, desirable indicators are those that summarize or otherwise simplify relevant information, makes visible or perceptible phenomena of interest, and quantify, measure, and communicate relevant information. As I have discussed before, some of those properties are not universal requisites (i.e., qualitative indicators may be used in some situations), but a matter of convenience. In addition to those, some indicators may be used to evalu-
(7. C. Gaiioptn / Environmental and sustalnab llity indicators
ate a condition or phenomenon (e.g., those indicators of environmental quality as opposed to environmental condition). The major functions of indicators are (modified from [41,42]): 9 to assess conditions and trends; 9 to compare across places and situations; 9 to assess conditions and trends in relation to goals and targets; 9 to provide early warning information; 9 to anticipate future conditions and trends. Most of the indicators proposed (including both environmental indicators and indicators of sustainable development) represent specific attributes of interest, such as concentrations of chemicals in the water or atmosphere, emission levels, depletion rates of forests, land or other resources, proportion of protected areas, population density, public expenditure on health, proportion of people with access to drinking water, unemployment rate, rate of urbanization, GDP per capita, debt as a proportion of GDP, etc. [1,4,26,35,40,44]. There is no doubt that these kinds of indicators are absolutely necessary for policy-making at different levels. However, science has advanced to the point that we know that (a) socio-ecological systems do exhibit important interactions and synergies between their components, and Co) sometimes those interactions dominate the total behavior of the system, above and beyond the behavior of the component elements. Complex, interlinked problems, such as those associated with sustainable development require integrated approaches and solutions. There is a need to move beyond the usual, more or less exhaustive, lists of individual indicators to integrated or interlinked sets of indicators. This is particularly important regarding the uses of indicators for early warning and for forecasting (the issue of interlinked indicators should not be confused with that of indicators ofinterlinkages). The existence of nonlinear interactions between variables implies that in some cases, the relevant information about sustaina.bility or about environmental quality should be provided by a combination of values in a set of indicators, or by a complex composite indicator (not just a listing or summation). The "chemical time bomb" [37,38] is a good example of nonlinear interactions between variables or indicators (such as pH, heavy metal concentration in soils, heavy metal liberation, acid rain, and land management) resulting in the possibility of sudden occurrence of harmful effects caused by the mobilization of chemicals stored in soils and sediments. The identification of the interlinkages that are critical for sustainability is a clear element of the required future research agenda. A map of the major generic interlinkages between and within the social, economic and nat-
109
ural subsystems of a socio-ecological system is presented in Gallopln [201. Interlinkages in socio-ecological systems may be physical flows of matter or energy or causal influences that are not adequately described as material or energy flows. Linkages may exist among variables within a subsystem, among different subsystems (e.g., among the economy and the environment) and among whole systems (e.g., among countries). From another viewpoint, linkages may exist among systems or subsystems of roughly the same hierarchical or aggregation level (either internal or external to the considered socio-ecological system). Those can be referred to as "horizontal" linkages [20]. "Vertical" or interlevel linkages, on the other hand, are those existing between socio-ecological systems belonging to different levels of organization (such as local, regional, global) or between subsystems belonging to different levels of the system, if the latter is defined as a hierarchical system. The recognition of the existence of significant linkages in socio-ecological systems highlights the limitations of the usual procedures (often as simple as summation or averaging) for aggregating indicators into a single index. Those may be useful for assessing progress, but usually not for understanding, early warning, and forecasting. For the latter purposes, it is not enough to choose indicators having some correspondence (e.g. iso- or homo-morphism) with meaningful attributes of the object studied. In addition, it is necessary to ensure that some minimum correspondence exists between the functional interlinkages among the attributes and the procedure linking or aggregating the individual indicators. A set of indicators (variables) and a set of assumed relations among them constitute a model of the original system. This model may be only a blurry mental image about how indicators are interconnected causally, or it may be a highly formalized (analytical or simulation) mathematical model. The use of indicators to operationalize the concept of sustainable development and to anticipate the impact of policies and human actions on sustainability will require an increasing use of modeling approaches and frameworks to generate explanatory and predictive power. Given the still huge limitations in our understanding of the dynamics of complex socio-ecological systems, there is no universally accepted model or even theory of socio-ecological systems dynamics. Therefore, it would seem only prudent to use as one of the criteria for selecting indicators that they be usable by, and meaningful to, a wide range of models.
5.5 The needfor indicators offundamental whole system properties The systemic nature of many aspects of sustainable de-
110
G. C. Gailopin/ Environmental~mdsustainabifity indicators
velopment points to the importance of searching for fundamental whole-system attributes, for which appropriate indicators could be devised. These indicators would be holistic themselves, representing directly basic underlying properties at the total system level (not only elements, not only interlinkages). This will require more fundamental scientific research, both empirical and theoretical, on the behavior of complex socio-ecological systems, in order to identify the basic attributes, mechanisms, and necessary measurements. Systemic vulnerability and resilience, ecosystem health, socio-ecological self-reliance, etc., are examples of whole-system properties critical for sustainability. Research is needed on such subjects as what makes a socio-ecological system more robust or more vulnerable (besides the obvious factor of available resources), which are the sources of renewal (ecological, economic, social) in stressed systems, what is a good indicator of socio-ecological system health, where lie the thresholds ofirreversibility, what triggers systemic restructuration, etc.
I00
"(3
o
0 2 Acid
7 pH
12 Base
Figure 4. Water qualitypH subindexcurve(redrawn from Me Clelland (1974)in [35]).
5.6 The general concept o f indicator is not limited to the case o f a time-varying variable While it is clear that in most cases the main interest will be to assess changes over time (e.g., trends and future conditions), indicators used for cross-sectional studies and other types of synchronic comparisons have space (such as in the case of indicators of soil quality in a landscape) or population (such as static indicators for countries - total size mountain areas, etc.) rather than time, as a distinguishing property. These indicators are still variables, adopting different states or values not in time, but in space or population, and are very useful for some purposes, including policy-making. The term dynamics may be generalized to imply motion of the state of a system through social groups, cities, countries, geographical space, cultures, etc., or through combinations of these, as well as through time [9]. Therefore, the requirement that "indicators should show trends over time" [40, p. 76] is a convenient, but not a universal condition. 5. 7 Value judgements may enter indicators at different levels The term "value" has two alternative common meanings relevant to the discussion of indicators: the first is that of "relative worth, utility or importance" (the axiological definition associated to valuejugements). The second meaning essentially alludes to a state of a variable in the general systems contexts. The state (which can be a numerical quantity or non-numeric) is allocated through observation, measurement, calculation, inference or a priori designation. It is this sense that Adriaause [1, p. 7] seems to use when referring to the evaluation of a descriptive indicator (although he chooses a very restrie-
tire notion). As used here, evaluation in this sense is basically observation or measurement (in broad terms) and it may or may not imply a value judgement. Assigning values or states to the indicator "population density" or "sulphur dioxide concentration" does not embody a value judgement. It is only when those values are compared with a desired one such as a standard or a target that a value judgement is made. However, assigning values or states to a variable such as "esthetic quality" of a landscape necessarily implies making a direct value judgement; the variable itself denotes worth. In most cases the value judgement (in the sense of worth or utility) is associated to the state or value adopted by the indicator through a secondary process. This is very clear in all those cases ofindicatorsof environmental quality. The quality of the environment (or of a given environmental component) can be conceptualized as the value judgement attached to the state (or condition) of the environment, where state refers to the value (not necessarily numerical) adopted by the variables or components of the environment [17]. A good example is the water quality pH subindex curve (figure 4) obtained by.averaging ratings of quality given by a number of water quality experts as a function of certain pollutant and physico-chemical variables (Me Clelland (1974), in [35]; [14]). The value judgement in this case represents an intersubjective 3 evaluation (value of the subindex from 0 = worst to 100 = best) of the state or condition (pH) of the environment. 3
Combiningdifferentsubjectiveevaluationsof membersof a g r o u p , this case, of qualifiedexperts.
in
G. C. Galiopin / Environmental and sustainability indicators
This is a valuation function, allocating a value judgement to each state of the variable. In other cases, the value judgement is allocated through a political process, or directly by the decision-maker on the basis of policy goals. Ultimately, all indicators are used normatively, insofar as they are selected to fulfill the purpose of policy and, more generally, decision-making. The important point is whether the value judgement associated to the indicator is external to the indicator or is built-in. Here one could point to a second "classical dichotomy" of views towards indicators: one viewpoint preferring to have value judgements internalized, reducing decision making to quantitative comparisons of a single measure such as cost-benefit ratio, and the other viewpoint preferring to have the indicators laid out and to perform the evaluation of their condition (in terms of worth or utility) explicitly. In summary, value judgements can appear in indicators in the following ways: (a) Directly in the measuring or observation process (such as for indicators of esthetical value of a landscape, preferences, etc.). (b) Added to the observed or measured condition of an indicator (which can be a subindex) such as when a value of quality is assigned to each concentration of a pollutant, or the desired value (standard, target, etc.) is combined with the indicator to define a new indicator such as the ratio between the current and desired condition, or as the distance from the current condition and the target. (c) As relative weights in an aggregation function combining several indicators (or subindices); a weighted linear sum or a weighted product are common examples. The allocation of weighting coefficients to each indicator introduces a value judgement reflected in the value of the total indicator or index (however, the values of the weights cannot be recuperated from the knowledge of the value of the total index). Alternatively, value judgements may be kept confined to targets, norn~.s or standards, and the current condition (value or state) of the indicators (and their trajectory or changes through time or through the overall set of distinguishing properties) can be compared with them in order to evaluate performance. The distinction between "descriptive" and "policy performance" indicators [I] is therefore not an essential, but a pragmatic differentiation.
6 Situational indicators o f sustainabflity
The concept of situational indicators was introduced by
111
GaUopin [21,22] in the context of agroecosystem sustainability. Here the concept will be generalized to a broader set of issues. The analysis will also iUnstrate that nonnumerical indicators can be valuable, may be rigorously defined, and represent a class of indicators not obtained by aggregation (and actually may be used to disaggregate as needed). Recognizing that selecting and measuring indicators of sustainability at the levels of agroecological zones or landscape units may often be location specific (i.e., different indicators may be relevant for steep highlands than for flat prairies), and that measurements or observations imply a cost which could become limiting, the proposal was made to use an approach that increases cost-effectiveness through a process of successive approximations. It implies a multi-tiered approach, defining indicators of sustainabflity at three basic levels of analysis (coarse, medium and fine). In principle, the levels could be as few as two, or as many as judged necessary. At the coarsest level of analysis for a given region, landscape, agroecological zone, etc., different landscape units can be identified on the basis of natural characteristics and agricultural suitability, such as piedemont, high plains, fertile/infertile soils, etc. This information is often available or obtainable from secondary sources. A systematic analysis of current or past land management practices or production systems can be performed for the area. Careful comparisons, including a survey of extreme or advanced problematic situations, can lead to the identification of risk factors when a given management practice is applied to a defined landscape unit in the region considered. Conversely, on the basis of experimental trials, or comparisons with successful situations, opportunities for sustainable use can be identified. A matrix can be constructed as in figure 5, where each cell can adopt three values: (1) no problem expected, (2) danger (indicating a potential problem), and (3) opportunity (indicating an unused opportunity for improvement). Some cells may represent impossible combinations (e.g., heavy mechanized agriculture in steep highlands). The matrix is more useful when it is based on empirical evidence. Nevertheless, in some cases a theoretical matrix, based on hypothesized relations, could be useful. The first level of approximation may be based, methodologically, on remote sensing, geographical information systems, and ground trothing (verification). For those cells signaling the likelihood of problems or opportunities, sets of selected situation-specific indicators should be identified to be assessed at a finer resolution (e.g., using rapid rural appraisal, field surveys, local experts consultation, etc.) in order to check the actual existence of problems/opportunities and their nature and magnitude (figure 6). If necessary, indicators at still finer resolution levels may be selected and measured or monitored (e.g., through field measurements or experiments).
G.C. Gallopln / Environmental andsustainability indicators
112
Landscape II
Units Ill
~
Impossllolecombination [e.g. heavily mechanized ogdcultureon steep highlands) ~O------TNoproblem e~pected a pdorl ] Potentialprololemsexpected [~
Potenflalunuseclopporlunltles
Figure 5. Land-usesustainabilitymatrix (redrawn from [22]). As the detailed indicators are assessed or monitored only for the situations suggesting potential danger/ opportunities, the process of screening and diagnosing is made through successive approximations and goes only as deeply as is judged necessary. This is much more economical and cost-effective than massive routine monitoring of fine-grained indicators.
The term "situational indicator" applies to the coarse level discussed above, in which the indicative information is provided by the situation (in the sense of"position with respect to conditions or circumstances", "combination of circumstances at a certain moment", or "the way in which something is placed in relation to its surroundings" [32]. In other words, the relevant information is provided not by the landscape class, nor by the production system type, but by their combination (a certain production type on a certain landscape unit). A concrete example of the applicability of the situational indicators for the case of the Colombian savannas is presented in table 1. In this case, only presence or absence of problems is indicated; opportunities are not signaled. The information in the table is based on what is actually happening in different parts of the savannas. In the original formulation [21], it was stated that each cell in the matrix is a situational indicator. However, in light of the deeper analysis presented here, it is clear that the indicator is an abstract non-numerical variable that is a function of two non-numerical variables (landscape and production system). The abstract variable used as indicator could be called "degradation risk", "land-use sustainability indicator" or any other convenient name. Formally, the variable "landscape" can be denoted by I in the case of figure 5; its state set (set of possible values) can adopt only three values or states, L = {I, II, III}. In a real situation, the number of states may be much higher, but at least for the case of landscape types, it will be a finite number. Landscape is a nominal variable, with no mathematical property such as ordering or distance recognized in its state set. The distinguishing property for the variable "landscape" is space; landscape is not expected to
COARSE (C-~remote,a ~ n ~ etc.)
9 ~b~M
Figure 6. Land-usesustainabilitycube(redrawnfrom [22]).
G. C. Gallopfn /Em, lronmental a~ndsustainablllty indicators
113
Table 1 Existing or expected p r o b l e m s in the C o l o m b i a n s a v a n n a s for different combinations of agricultural practices a n d landscape (biophysical) elements. Source: Peter Jones (private communication). Agricultural practice
Landscape dements Piedemom
High plains
Dissected plains
Gallery forest
River flats
Extensive grazing
-
-
9
-
-
Sown p a s t u r e s
9 Weeds 9 Compaction
9 Erosion 9 Nutrient loss 9 Biodiversity loss
9 Erosion . Nutrient loss
Indirect a B
9 Nutrient loss 9 Compaction
Monocultures
9
9 Erosion 9 Compaction 9 Nutrient loss
Indirect A
Indirect B
9 Compaction 9 Nutrient loss
9 Soft structure 9 N u t r i e n t loss 9 Polution Irrigation
9 Erosion
9 Water availability
Indirect A
Indirect B
Ley systems
-
9 Erosion
Indirect A
Indirect B
Indirect effects: (A) = overgrazing, inappropriate cropping. (B) = biodiversity loss, logging.
change in time. In some situations, the property might If at least one element of A does not participate in the be a population (such as countries, or regions), or both mapping, the mapping is called incompletely specified. A mapping from/1 to B is denoted by R(A ~ B), by population and space. a -~ b applied for a that is an element of A and b that is The variable "production system" (p) can adopt four an element of B, by b = f ( a ) , or by f : A ~ B. states or values; that is, P = {A, B, C, D}. It is also a The concept of mapping can be generalized for nominal variable. families of sets (sets of sets). Let A = {Ah A2. . . . , A,} The distinguishing property for "production system" and B = {BI, B2, ..., Bin} be two families of sets. Then could be the same as that for "landscape" with the addithe mapping R(A --* B) is defined as: tion, in most cases, of time (given that production systems may change through the years). R(A -~ B) C {(a,b): every element a E xl~i