In: N.M. Avouris, B. Page (eds). Environmental Informatics – Methodology and Applications of Environmental Information Processing, Kluwer Academic, Dordrecht, 1995.
ENVIRONMENTAL MONITORING: MODELS, METHODS, AND SYSTEMS Oliver Günther Humboldt Universität zu Berlin Spandauer Str. 1, 10178 Berlin, Germany Email:
[email protected] Franz Josef Radermacher and Wolf-Fritz Riekert FAW (Research Institute for Applied Knowledge Processing) Ulm P.O.Box 2060, 89010 Ulm, Germany Email: {radermac|riekert}@faw.uni-ulm.de
ABSTRACT: Environmental monitoring is the continuous, automated observation of changes in the environment. Powerful models, methods, and systems that have been developed for the purpose of environmental monitoring are now leaving the laboratory setting, and some of them are already being applied. When they are applied in countries that have well established environmental authorities and a high population density, these applications are actually additional measures to protect the environment. However, the situation in less developed or less densely populated countries is quite different. For these countries, the new techniques of environmental monitoring can offer totally new opportunities for better environmental protection.
1 Environmental Monitoring and its Global Range 1.1 THE PRESENT SITUATION
The global environmental situation of the Earth is becoming increasingly problematic and critical. The outlook for our future is increasingly gloomy. The major reason for this pessimistic outlook is the exploding number of people. Since 1970 the world’s population has risen from 3.5 to 5.5 billion people. At the same time, the consumption per person has risen tremendously in the developed countries [STIF91]. Both trends historically have been regarded as something positive, and they have led to an ever-growing improvement of human living conditions, an effect that individuals can perceive directly. At the same time, the responsible institutions have had greater opportunities to develop and gain power. For these reasons, both the increase in the number of people and the increase in the consumption rates have generally been regarded as favorable. But now we have reached a turning point. Today, more than half of the world’s population is not yet capable of reproduction, which means that a kind of time bomb, of which we will have hardly any control, is developing within the global demographic structure [EHRL75, EHRL91, FAW92]. Furthermore, the consumption rates reached in
the developed countries are taken as a standard measure by the people in the developing world. Billions of people are striving to achieve this living-standard, which is communicated to them constantly, particularly via modern mass media. There is no doubt that the Earth will not be able to satisfy such increasing demands. We recognize that the growth of the world’s population and the increase in demands are probably the most significant effects of technological progress and should therefore be elaborated on in the general discussion of the effects of technological progress. However, we must not forget that this technological development was driven by the growth of population and by demands resulting from the pressure and the innovation potentials they induced. Today, we have reached the end of the age of “lighthearted” growth, but many of us have not yet come to realize this. A number of nonrenewable resources, such as the amount of cultivable land, is decreasing globally. Another example is the twenty-year Chinese government program 1980-2000 [OEHM92], according to which energy production will be enormously increased by coal combustion. It is very likely that these increases will over-ride the overall reductions in carbon dioxide output planned by the western countries. The crucial point is that the developed countries are not in a position to blame the other countries for such effects since they have created the highest degree of environmental degradation per person, not only at present but particularly in the last decades. Most of the activities causing environmental degradation take place in the developed northern hemisphere; thus, it is very hard to set any kind of restrictions on the developing countries. Against this background, one can see how alarming the situation is, and the real extent of the problems is generally not acknowledged. If we do not agree on and carry out drastic programs to reduce the number of people inhabitating our planet [HUMA92], for which, however, our mental readiness is not yet apparent, the problems can be solved only by transferring resources from the rich countries to the poorer countries on a very large scale in order to align living-standards globally at a lower level. 1.2 EFFECTS
Because of the developments described above, radical changes to the global situation and especially to the ecology are ahead. Air pollution, the greenhouse effect, and the noticeable impact of both on coastal areas, especially in the Third World, have already been mentioned. Densely populated areas, such as Bangladesh [SONT92] among others, are hit by such developments, and it is very likely that the number of people who die as a result will dramatically rise. The loss of agriculturally productive land has several causes: for example, excessive cultivation of the Sahel brought about its subsequent degeneration into steppe [WELT92]. The situation in tropical regions is also dramatic as deforestation is going on causing the rapid loss of one of the most valuable biological assets on our planet, that of an enormous genetic variety. Biotopes that have grown over the course of many centuries and that cannot be regenerated or reproduced within a short time are being destroyed although it is known that with deforestation land often loses much of its fertility very quickly, thus being of no use for any form of sustainable development afterwards.
-2-
This process of environmental degradation is closely linked to the development of mega-cities, a trend that can be seen in developing countries where metropolitan areas are spreading rampantly and forming the greatest conglomerates of humans on Earth [HUMA92]. The consequences of this process are sanitary and social conditions that seem completely intolerable from the western point of view. 1.3 SUSTAINABILITY OF DEVELOPMENT
Because of the effects of the developments described above, the responsible authorities and those organizations – both governmental and nongovernmental – that deal with this issue agreed on a political program at the Earth Summit in Rio, for which the term “sustainable development” was coined. The term is meant to describe the intention that all people should act in such a way to ensure that a development is possible that “meets the needs of the present without compromising the ability of future generations to meet their own needs” [WORL87]. The key concept of “sustainability” is certainly well-grounded ethically but the consequences and limitations that this claim bears for all of us are not yet fully understood nor elaborated. We will not reach the goal of sustainable development if the present growth of both the world’s population and the consumption rates continue or if the developing countries succeed in their claim to living conditions similiar to those in the developed part of the world without a drastic reduction in the global population numbers over some generations. Thus, sustainability calls for a decisive reduction in the growth rates of the global population. The twenty-year program of the Chinese government mentioned earlier is an example of consequences that can result from a rise of worldwide consumption. Certainly, it is not legitimate for us to argue against an improvement in the living conditions of billions of people. However, in such a complex situation the necessary stability of the global environmental situation cannot be guaranteed – even if we were to limit consumption in the industrial countries to an extent clearly much lower than today. We will succeed only if we manage to set up a dramatic program to slow down the growth of population numbers. To be politically feasibile in the long run, this goal requires reductions in the number of people in both the developed and the developing countries. 1.4 THE VALUE OF INFORMATION
A program for a truly sustainable development, in which a reduction in the number of people in industrialized as well as in developing countries is the core element (as mentioned in the preceding paragraph), is not politically feasible (at the moment). Indeed, for some it is not even worth discussing. This is partly because a great number of people do not have a clear idea of the severity of the global environmental threat. The reasons for this situation are manyfold. First of all, complex, interacting systems and nonlinear phenomena that contain hidden time dynamics are not easily understood by humans because we have not been equipped with such a skill in the course of our evolutionary history. As stated before, one of the particular problems of the dynamics of overpopulation is that growth has always been experienced as something reasonable, and as
-3-
offering new opportunities to develop and gain power. Only recently have there been signs that the situation is about to lose its balance for the simple reason that the Earth is about to become overloaded. It is extremely difficult for citizens and politicians to cast aside long-standing attitudes towards this issue, which touch on basic experiences, traditional "self-evident" facts, and even religious taboos. Moreover, it is extremely difficult to receive truly credible information on the global processes that are ahead, information that can be made available and understood by citizens on a broad scale. In fact, there is a great variety of approaches and also much controversy among experts in such fields as environmental modeling, environmental monitoring, and statistics with regard to the proper methodology and the adequate model to apply. Furthermore, even the amount of information is simply too big, so that sometimes one cannot see the wood for the trees. Some important global models are described in BREM89, where the seminal models of the Club of Rome [HERR76, MEAD72, MEAD74, MESA74] are thoroughly studied. The environmental databases on Earth also clearly show a certain degree of inconsistency, which is the reason why the international project “Harmonization of Environmental Measurement (HEM)” has been established. Germany strongly participates in this project that is coordinated by the United Nations Environmental Programme (UNEP) [KEUN91]. Furthermore, many of the politically responsible authorities involved in these processes – e.g., national or local authorities not only in the Third World but also in the developed countries – are sometimes not willing to make the necessary information available. Thus, everything depends on the particular local circumstances, on the ups and downs of politics, on the granting of funds, and so on. 1.5 ENVIRONMENTAL MONITORING
Today, the opportunity has fallen to us that we can try to get the necessary information on the overall situation by means of modern remote sensing methods. This information will be useful even if these remote sensing information sources do not provide as much detail as wanted. The advantage of this kind of environmental data supply is that information is obtained worldwide by a single standard, and at regular, short intervals, applying comparable measures. These aspects of regularity and comparability offer great potential because they provide the possibility of producing “snapshots” of the environmental situation at regular intervals. The relevant information can be obtained via satellite or – just as well or even better – via less expensive sensors, which could, for example, be mounted on ships and planes, thus collecting relevant sensor data in the course of the general operation of these means of transport. (The cultivation of wheat could, for example, be controlled by means of remote sensing methods; see [MYER83]). The regularity and global aspect of the data supply promise enormous benefits even if the information given is not as detailed as wanted. Using this data, we could, for instance, illustrate the effects of the expansion of the mega-cities over several years or decades by means of time-lapse comparisons, the reduction in the rain forest stand, the air pollution, desertification, desiccation of lakes, and many other environmental processes. (Examples of remote sensing approaches are described in the third part of this chapter.)
-4-
Since the supply of information and the transparency that comes out of it are the preconditions for a change at the political level, they carry considerable potential. Modern remote sensing techniques – in combination with suitable information management – are in the long run the only possible means towards effective environmental monitoring, both at a global and a local level, especially in the Third World. In the industrialized part of the world, for example, in the countries of the European Union, these remote sensing techniques are a valuable additional measure to traditional methods of environmental observation: • •
•
At the level of the European Union, for example, the cultivation of land, the state of the seas, and climate changes are being studied increasingly by means of remote sensing systems via satellites. In a growing number of countries and regions of the European Union, environmental information systems are being established to analyze environmental data obtained by traditional methods and sensing techniques. The information provided by these data is made available to the governmental organizations. One such system is described in more detail in section 2.2. Today, many local authorities, public utilities, and owners of plants apply remote sensing and information technology in order to control drainage systems, power stations, or incinerators.
1.6 OPTIMISTIC MODELING AND STANDARDIZED REFERENCE DATA
At FAW (Research Institute for Applied Knowledge Processing) in Ulm, Germany, these questions have been intensively studied, and a great number of contributions have been produced by integrating the processing of environmental data and environmental monitoring applying different sorts of sensors. What follows is a description and discussion of this work. FAW is particularly devoted to global issues. In particular, in cooperation with the Institute for Occupational and Social Medicine and the Central Institute for Biomedical Engineering at the University of Ulm, FAW has elaborated a concept for the World Health Organization (WHO) on how to approach the global issues desribed here and how to provide the needed transparency. The starting point for this approach is that very rough models can provide enough information in many cases, often even if nonlinear effects are involved. Rough optimistic modeling, that is, a kind of estimates [RADE92] that always makes the most favourable assumptions, on the basis of which the most optimistic impacts are derived, can be highly valuable because they can help redirect discussion. Instead of examining the adequacy of specialized models, rough optimistic modeling can give us a generally acknowledged certainty that specific predicted developments will actually take place, such as prognoses concerning the minimum growth of the mega-cities, population growth, and the availability of nonrenewable resources per person. This problem is addressed at FAW in the SCOPE project (Standard-Reference Data and Policy Assistance Systems for Global Health Evolution), which aims particularly at
-5-
the establishment of a network to link scientists all over the world who concentrate on such optimistic scenarios for various basic figures, e.g., population growth, gross national product, increase in the transfer of resources from the north to the south, and who make – based on corresponding optimistic models – optimistic predictions concerning many further derived figures, such as the size of the mega-cities or the rain forest stand [FLIE93]. The relevant figures and estimates for the next decades should be published annually and should in retrospect prove to be optimistic so that the community can experience a feeling of reliability of the prognoses made. For the calibration of statements, constant feedback and the information supply from remote sensing systems and worldwide monitoring play a decisive role. 2 Techniques for Environmental Monitoring As mentioned above, people usually have major difficulties in perceiving the kind of slow, gradual developments that are typical of environmental processes. Nevertheless, the general awareness of environmental issues has increased considerably in the past decade, especially in the western industrial countries. In this section, we will focus on the situation in the Federal Republic of Germany. In addition to numerous actions at the political level to improve the quality of the environment, one can observe that both industry and public administration are increasingly taking advantage of modern technology for the recognition and containment of environmental damage. Examples, among others, are the utilization of extensive measuring networks and the use of remote sensing technology for civilian purposes. Data about noise, soil, water, and air quality are captured periodically at many different locations, and these data create a solid base for efficient environmental management and monitoring. Data capture, however, is not the only task in this context. Time series of measurements and raw image data need to be aggregated and enriched by appropriate semantics before they can be used in environmental decision making. Additional information about the measuring process or the conditions of the probe-taking are especially valuable for this purpose. In addition, one needs to compare the information obtained with the current legal requirements and to design possible choices for the policy- and decision-making bodies. These kinds of complex analysis tasks are currently carried out by highly qualified experts, such as analytical chemists, geodesists, or ecologists. In many cases, the personnel and equipment available for this kind of work is nowhere near sufficient to process the ever-increasing volume of data. Modern information technology can make major contributions to making this task faster, safer, and more cost-effective. However, questions regarding the privacy and security of this process need to be taken into account early in the planning stage. In the German public sector, these kinds of activities are being pursued through a hierarchy of environmental information systems at the federal, state, and county level. These systems should not be thought of as all-purpose monolithical programs, but as flexible collections of organizational and software tools for the efficient processing of
-6-
environmental information. Besides supporting the administration in their day-to-day work, these systems also play a major role in providing the public with up-to-date information about the environment. Similar activities can be observed on the part of private industry. More and more companies are considering extensions to their internal information systems to capture the environmental costs and hazards related to their activities. This trend towards the “ecological balance sheet” has been reinforced by some recent legislation on environmental liability as well as more concise guidelines set by the European Union. In the following paragraphs of this section, a detailed overview of the information flow that is typical of environmental monitoring tasks is presented, followed by a survey on how environmental monitoring is used in the German public sector, using the Environmental Information System of the State of Baden-Württemberg as an example. Finally, several related research projects carried out at FAW in cooperation with the BadenWürttemberg Environmental Ministry and other partners from government and industry, are described. 2.1 INFORMATION FLOW
Most environmental applications of information technology display an information flow that bears a close resemblance to the data flow in classical business applications. We distinguish between four phases: data capture, data aggregation, data storage, and data analysis. The first phase, data capture, revolves around the collection of extraordinary amounts of raw data, such as measurement time series or imagery, in particular aerial photographs and remote sensing data. NASA estimates that in a few years we will receive up to 10 terabytes of image data per day [CAMP90]. It is obvious that such large amounts of data can only be processed by appropriate hardware and software tools based on stateof-the-art computer science research. In the second phase, data aggregation, the raw data are condensed and enriched in order to extract semantically meaningful entities. In the case of image data this includes, for example, the recognition of geometric primitives (such as lines and vertices) in an array of pixels, the comparison of the resulting geometric objects with available maps, and, finally, the identification of geographic objects – such as cities or rivers – on the picture. The information can then be represented in a much more compact format (in this case, a vector-based data format, as opposed to the original raster data). Measurement time series also need to be aggregated and possibly evaluated by means of some standard statistical procedures. The aggregated data are stored – possibly in some compressed format – in a file, a database, or a geographic information system (GIS). In this phase of data storage, it is important to choose a database design and suitable physical storage structures that will optimize the overall system performance. Because of the complexity and heterogeneity of environmental data, this often necessitates substantial extensions to classical database technology.
-7-
In the data analysis phase, the available information is used for decision support. This may require access to data that are geographically distributed, stored on heterogenous hardware, and organized along a wide variety of data models. The data analysis is typically based on complex statistical methods, scenarios, and simulation tools. Only the synthesis of the input data and these kinds of models allows us to judge the state of the environment and the potential of actions, both planned and already implemented. No doubt there are many parallels between this kind of sequential data processing and the data flow in traditional business applications, where data are collected, stored, and processed in order to provide efficient decision support for management. In environmental monitoring, however, we encounter a few very special requirements that make parts of the processing much more difficult. First, the amount of data to be processed is unusually large. As was mentioned, in the case of image data we expect several terabytes per day, a quantity that is about two orders of magnitude beyond what is currently typical for large high-transaction databases, such as are used in banking or airline reservation systems. These kinds of large data sets are causing major problems in both storage and processing. Second, much of the work to be done in this context is routine, including tasks such as the identification of common substances in chemical probes or the deletion of satellite imagery that contains too many clouds. Knowledge-based systems (also called expert systems) may provide some efficient support for this kind of routine work. In particular, these systems can be used interactively by less-skilled personnel to evaluate given data sets. Most data could then be processed semi- or fully-automatical, and only the difficult cases would be forwarded to a more qualified human expert. Another problem area, especially in the data analysis phase, is the extreme heterogeneity and distribution of the information required. As in many private companies, most public environmental agencies work with a collection of isolated special-purpose software systems rather than an integrated framework of tools. Collecting the required data from such a heterogenous installation is a major problem. At the physical level, powerful netware that privides safe transfer of large amounts of data from one location to another is required. The task involves both the question of simple connectivity and also the need for more sophisticated protocols to allow complex queries over the net. Ideally, the distribution should be completely transparent to the user, that is, local and non-local information should be accessible using the same command sequence. A useful paradigm for this kind of architecture is provided by the Local Area Networks (LANs) used, for example, for the networking of UNIX workstations. A more difficult task is the management of heterogeneous networks, where computers of different vendors, different sizes (PC – workstation – mainframe), and different operating systems are put together, using a variety of network technologies. Up to now, most of the work has been done on the special case at hand, but the search is beginning for more general solutions. The most difficult problem, however, concerns the semantic issues that often arise when data sets from different sources are joined and used together in some complex application. In addition to problems of at least partial redundance and related contradictions,
-8-
often the same things are differently named in different applications and, vice versa, that is, different things bear the same name. Some significant progress on these semantic issues is needed in order to improve database interoperability over the long term. Data models need to be extended to provide much more semantic information about the meaning of each piece of data. Inconsistencies must be detected and described in an appropriate language that is machine-readable and that can be used for the correct interpretation of user queries. This kind of semantic data is often called metadata [RADE91]. Data analysis techniques are not only useful for decision makers in environmental agencies or private companies. In environmental protection, the public demand for openness and transparency is unusually high, and this is increasingly reflected in legislation, especially at the European level. According to the recent EU recommendation on environmental information (which is modelled after the American Freedom of Information Act), almost all data stored at public agencies should be made available to any citizen on demand [COUN90]. The few exceptions refer to privacy issues, such as the protection of industrial secrets, which need to be shielded from public view by appropriate authorization mechanisms. In general, however, public records on private companies are not exempted from this ruling. Citizen inquiries will rarely refer only to raw data, which could be provided by most modern administrations fairly easily by means of a few database queries. A typical inquiry will ask rather for high-level information, which can be provided only by joining and aggregating the raw data as described above. To see how much additional work this can cause for the public administration, one needs only to remember that right now it is not unusual for public agencies to take several months to answer a parliamentary request for information. The skills needed for this kind of synthesis require highly trained personnel, which are typically hard to find and relatively expensive. As a result, there is a major demand for appropriate tools to manage and aggregate distributed information in a heterogenous network. In summary, environmental information management requires the most sophisticated computer technology available. Recent results from research in areas such as databases, artificial intelligence, computational geometry, computer graphics, and other subdisciplines of computer science are finding their way into commercial geographic and environmental information systems within just a few years. Such modern techniques as knowledge-based systems or object-oriented programming are received with great interest by users in environmental applications. In such a situation, it is increasingly important to keep both the technological limitations and possibilities in mind when designing a complex environmental information system. This can only be achieved by close cooperation between the areas of research and application, which is exactly what is being done through the cooperation between FAW, the State of Baden-Württemberg, and several private companies.
-9-
2.2 ENVIRONMENTAL MONITORING IN THE UIS BADEN-WÜRTTEMBERG
FAW’s most important partner in the area of environmental information systems is the Environmental Ministry of the State of Baden-Württemberg. Since its foundation in 1987, this ministry has been conducting a major project to design and implement an Environmental Information System for the entire state [MAYE93]. This large-scale project, called UIS, is concerned with a gradual integration of the variety of hardware and software currently used in Baden-Württemberg’s environmental administration. The project is also committed to using state-of-the-art information technology and keeping close contact with computer science research in order to employ the best information management solutions currently available. A first design of the complete system architecture was presented in 1990. Since then, the ministry has been working on more detailed design studies and on the prototypical implementation of several selected components. Each of these components belongs to one of three functional levels: 1. 2. 3.
analysis and presentation tools for management information purposes, base components for data capture and data analysis at the department level, infrastructure and hardware/software environments.
The management information tools at level 1 include strategically oriented systems for decision support at the executive level as well as integrated reporting and planning tools for middle management. In particular, the Executive Environmental Information System (UFIS) serves to collect information from the department level, aggregate it, and present it in an appropriate format [HENN93]. Typical users of this system include the highest-level management of the Environmental Ministry and the State Environmental Protection Agency. On the other hand, some reporting systems are geared mainly towards supporting day-to-day work at the middle management level. Examples include TULIS, the Technosphere and Air Information System [KOHM93], or ALBIS, the Information System on Species, Landscapes, and Biotopes [MUELL92]. With regard to environmental monitoring, these systems have the important function of fast recognition of unusual developments, even those that occur at a pace too slow for human perception. Finally, level 1 components include several planning and control systems such as RIPS, the Spatial Information and Planning System, which provides and controls access to spatial data by the public administration. The base components at level 2 serve mainly for data capture, storage, and some preliminary analysis at the department level. Examples include VIKOLUM, a network for air quality measurements, and KIWI, an information system for the water management agencies. The information managed by these systems serves two purposes. First, it is an important basis for efficient environmental monitoring at the local level. Second, it serves as input for the management information systems at level 1, which are connected to the base components through computer networks. Infrastructure (level 3) means, in particular, systems that are used not only by the environmental administration but by other government agencies as well. Examples include
- 10 -
the Measurement Series Management System (MEROS) of the State Environmental Protection Agency, the Official Topographic-Cartographic Information System (ATKIS), and the Official Cadastral Map (ALK) of the State Survey. 2.3 ENVIRONMENTAL MONITORING PROJECTS AT FAW ULM
At FAW Ulm we have conducted several projects on the capture and storage of environmental data. The goal of the ZEUS project (phases II and III) was the design and implementation of a method base for managing a groundwater measuring network. In the projects WANDA and RESEDA, we built two knowledge-based systems for capturing water measurement and remote sensing information. Both systems are designed as interactive desktop assistants. They have a user-friendly interface that allows users to evaluate the data input more thoroughly and efficiently. In addition to these projects, FAW is working on the architecture of future geographic information systems for effectively storing spatially and temporally related environmental information. In all of these research projects, FAW has cooperated closely with the State of Baden-Württemberg as well as several companies, including Digital Equipment, ESRI, Hewlett-Packard, IBM, Siemens, Siemens Nixdorf, and strässle. The objective of ZEUS (phases II and III) was the construction of a method base that supports the installation and management of a statewide network to measure groundwater quality [SOKO93]. The network allows the government to monitor the groundwater at a large number of different locations, covering a broad spectrum of land use and sources of toxic substances. The network also provides a convenient testbed for evaluating the efficiency of legal and other administrational actions. ZEUS makes available a large number of classification tools and (geo)statistical methods. Examples include algorithms to compute the hydraulics around any particular probing point or to estimate the protective function of the groundwater coverage. Before evaluating the hydrochemical data, the system performs a plausibility check involving data about land use in the region. Because most data in this context are associated with some location and a spatial extension, the methods are linked together under the roof of a commercial geographic information system. Non-spatial data are being held in a relational database, which has been extended by a versioning mechanism to minimize redundancies. A prototype of the system is currently undergoing testing at the State Environmental Protection Agency and the Geological State Office of Baden-Württemberg. Introduction into the field is planned for late 1994. Project WANDA (Water Analysis Data Advisor) has been concerned with the design and implementation of a knowledge-based system to support laboratory personnel in the interpretation of water analysis measurement data [SCHE93]. Based on one or more chromatograms, the system is able to identify and quantify a large number of specific substances. Until now, this interpretation process has been extremely time-consuming and has required the expertise of experienced analytical chemists. In this process, chemists typically introduce background information into the analysis, such as general experience,
- 11 -
or knowledge about the circumstances of the probe. In WANDA parts of this expertise are represented in a knowledge-based system that simulates the cognitive synthesis performed by the human expert. As is typical for an expert system approach, the knowledge acquisition phase was quite long and cumbersome. Even so, it is of course not possible to come even close to capturing the complete knowledge of an experienced chemist. The solution is to concentrate on some clearly defined subdomains that are most relevant to the task at hand. In addition to the measurements, WANDA takes the following data into account: • • • • •
information about the probe (location, time, local land use), knowledge about commonly used fertilizers, information about the measurement setup, general properties of relevant substances, and reference libraries of chromatographic measurements.
Most of the data are qualified by some kind of uncertainty measure. By combining the data (including their uncertainties) with the measurements, WANDA generates a list of candidate substances, which is again weighted according to certainty of prediction. Note that this list of candidates may contain substances that cannot even be detected by the chosen measurement methodology. Based on this list, chemists may then choose to try another type of analysis; that is, they receive some support for further analysis planning. In this project, the FAW cooperated closely with the State Environmental Protection Agency and the Department of Analytical and Environmental Chemistry of the University of Ulm. A prototype is currently undergoing testing at the Agency. Finally, the RESEDA project has been concerned with the evaluation of remote sensor data. This project will be discussed in detail in the following section. 3 Techniques for Remote Sensing of Environmental Features Remote sensing data, that is, digital satellite images and scanned aerial photographs, are important information sources for monitoring the environment. Airborne and spaceborne recording systems offer up-to-date and large-scale representations of the Earth’s surface. Radar and infrared sensors go beyond the limits of the visual part of the electromagnetic spectrum. Remote sensing usually is defined as measuring the physical properties of remote objects without being in contact with them. In the following we will use the term “remote sensing” in a restricted sense. The target of the observation is always the surface of the Earth. Electromagnetic radiation is measured in a form that can be interpreted as “image information.” Remote sensing data implicitly contain large amounts of information that is relevant to the state of the environment. Such features include surface temperatures, degree of vegetation, percentage of impervious area, or land coverage classes (e.g., various kinds of
- 12 -
cultivation, water bodies, and built-up areas), and how each changes over time. The derivation of this kind of information from the data sources, however, is not a trivial process, but requires complex analyzing techniques. Recently, advanced computer-based procedures have been developed for this purpose. All these procedures are based on the integration of three basic technologies, namely, image processing, geographic information systems, and knowledge-based systems. 3.1 REMOTE SENSING DATA
Digital image processing is the most important technique for processing remote sensing data. Satellite data or digitized aerial photographs, which are available in the form of raster image data, are input into the analysis process. Raster image data decompose the plane into a two-dimensional grid of picture elements known as pixels. Raster image data may consist of several layers of information, each of which is represented by a twodimensional matrix of numeric values. These numeric values may be interpreted as colors or gray values. Traditional black and white or color images are restricted to a number of one or three layers of information in the visual part of the spectrum. In contrast, remotely sensed environmental data usually are multispectral data that are also related to non-visual spectral bands, e.g., those from the infrared part of the spectrum. By definition, the collection of all these data that are related to a certain time and a certain geographic region is also called a scene. The possible manifestations of intensities from the particular information layers, which are also known as channels, span a feature space whose dimensionality is given by the number of existing information layers. Therefore, multispectral raster image data may be considered as a (mathematical) mapping that associates any pixel of a two-dimensional location space with an element of a multidimensional feature space. Two different types of remote sensing systems can be differentiated: active and passive systems. Active remote sensing systems independently produce electromagnetic radiation and measure its reflected part. Passive remote sensing systems, however, are dependent on foreign radiation. Radiation that can be detected by remote sensors may be divided into two categories depending on its origin: 1.
2.
Reflected radiation originally stems from the sun (e.g., light or infrared radiation) or from an emitter of an active remote sensing system (typically microwaves from a radar system). The sensor measures the part of this radiation that has been reflected by the Earth. Emitted radiation is radiation whose source is on the Earth’s surface. The most important examples for emitted radiation are heat, that is, thermal radiation from the infrared part of the spectrum, or light from sources on the Earth’s surface which, in particular, may be detected during the night.
It is important to know that electromagnetic radiation (whether reflected or emitted by the Earth) is subjected to various influences (e.g., atmospheric) on its way to the sensor
- 13 -
and that its intensity depends on many parameters which are independent from the data of actual interest, namely, the reflectance or emittance of the Earth’s surface. (See the Manual of Remote Sensing [COLW75] for a detailed discussion of these parameters.) Experience shows that, because of these influences on radiation, the same phenomenon looks different on two different satellite scenes or aerial photographs. In other words, remote sensing produces relative rather than absolute measures of reflectance and emittance. Therefore, a calibration is necessary for every new analysis in order to determine quantitative results. In the discussion that follows we will repeatedly refer to the Thematic Mapper (TM) sensor of the Landsat Earth observation satellites [FRED83]. This sensor has been especially designed for observation of vegetation states on the Earth’s surface; therefore, it is perfectly suited for remotely sensing environmental features of the Earth’s surface. The TM sensor is a passive system with seven different spectral channels, which produces image data consisting of seven layers of information. Landsat’s TM sensor scans the entire surface of the Earth within a period of 16 days. The image information recorded is aggregated into scenes consisting of 40 million pixels and is transmitted to the Earth. A Landsat scene stands for an area of about 180 × 180 km²; a single pixel corresponds to an area of 30 × 30 m². The seven channels of the Landsat TM sensor are sensitive to three visual and four infrared frequency bands. One of the infrared channels, channel 6, is sensitive to thermal emission. 3.2 PROCESSING METHODS
The goal of remote sensing in environmental monitoring is always to derive a certain piece of environmental information by using an appropriate analysis technique. Remotely sensed image data are input into the analysis process. Image processing systems provide operators to analyze the image data and to derive information relevant to the environment. This leads to the simple input-output model shown in figure 1.
Analysis
Environmental Information
Remote Sensing Data
Fig. 1: Simple functional model for the analysis of remote sensing data.
The traditional way of using remote sensing data is to visualize them as color composites. The most simple kind of visualization is to pass the information from dedicated remote sensor channels to the red, green, and blue signal of a video screen. A true-color image is produced if the sensor channels chosen are sensitive for the red, green, and blue part of the visual spectrum respectively; otherwise, the result is called a false-color image.
- 14 -
This way of using remote sensor data for producing images is also called iconic image processing. There are many iconic methods for processing remote sensing data, such as coordinate transforms, contrast-enhancement methods, and logical-arithmetical combinations of certain image layers. Iconic processing may lead to many meaningful results, such as “vegetation images,” “thermal images,” or “contrast-enhanced presentations of waterbodies”; all of them are visualizations that can yield valuable environmental information after being interpreted by an expert. The disadvantage of iconic processing is that it always remains on the surface of the phenomena observed. The results are only images that still require interpretation by a person. For consistent automation, it has been found necessary to process the remote sensing data as a source of symbolic information rather than as pictures. This leads to an image processing technique known as symbolic or knowledge-based image processing. Symbolic techniques aim at reconstructing the objects and facts that underlie the images. For this purpose, a transition is necessary from the numeric representation of the raster images to a symbolic description of all components shown on the images, including their attributes and relationships and, if necessary, an interpretation of their importance [NIEM87]. A process known as segmentation provides a transition from iconic processing towards symbolic processing. Individual pixels are classified according to their features and are combined into components with uniform features known as “segments.” Starting from the segments built corresponding to phenological criteria, the goal of symbolic processing is to derive and identify objects that correspond to the target categories of the user. Instead of processing single, numerically coded raster-form picture elements, symbolic processing deals with semantic objects which are important for understanding the image. These objects belong to an object class and possess various attributes. They are associated with one another by relationships (e.g., neighborhood) and can be aggregated to form complex objects. Most environmental objects can be identified better by the properties of their surface rather than by their shape. Since multispectral satellite data reflect the properties of the surface of environmental objects, symbolic information may be derived by using classification techniques which decompose the image into segments of uniform spectral signature. The intensities measured by the channels of a multispectral sensor form a multidimensional feature space. If the pixels from the location space are mapped into the feature space, regions of the same class (e.g., land-use class) will be typically concentrated in a cluster (fig. 2). A mathematical description of such a cluster can be given by a probability function, which is typically approximated by the density function of a Gaussian normal distribution. Additional geographic information (also known as ground truth) is needed in order to identify which cluster in feature space corresponds to a land-use class in question. An approach often used is based on an algorithm known as supervised classification. This algorithm requires training data, that is, data about regions of known land use. In the first phase of the algorithm, also known as training phase, the cluster parameters for every land-use class of interest are estimated from the training data. In the second phase, known as classification phase, every pixel from the location space is mapped to the feature
- 15 -
class 1
y channel k
class 2
channel j class 3 x
channel i
Location Space
Feature Space
Fig. 2: Land-use classes may be differentiated in feature space.
space. The class of the pixel is determined by identifying the cluster to which it belongs [SWAI73]. A problem with this technique is that, in general, there is no one-to-one correspondence between the spectral classes (which can be determined from the remote sensing data) and the land-use classes (in which users are interested). Different land-use classes may have the same spectral properties (spectral ambiguity). Regions of the same land-use class may have differing spectral properties (spectral variability). The task of harmonizing the object classes to be differentiated and the reflection classes that can actually be separated is a lengthy and difficult process, which becomes necessary for every new scene to be analyzed and is very demanding on the image analyst. The simple input-output model in figure 1 is not sufficient to demonstrate the essential components of a symbolic processing of image information. This becomes clear by investigating how remote sensing experts interpret images of the Earth’s surface. Apart from the imagery to be analyzed, the experts typically consult two additional knowledge sources: 1.
Existing geographic information about the region to be analyzed (e.g., originating from maps and tables). This information guides the expectations of the analysts when image data are processed.
2.
Knowledge about concepts and processes of remote sensing, image processing, and geo-sciences. This knowledge is important in controlling activities and decisions during the analysis.
The integration of these two types of knowledge sources into the analysis of remote sensing data leads to a knowledge-based functional model as shown in figure 3. The research project RESEDA, presented in the following section, aims at such a functional model.
- 16 -
Expert Knowledge
Analysis
Environmental Information
Remote Sensing Data
Geographic Information
Fig. 3: Knowledge-based functional model for the analysis of remote sensing data
3.3 THE RESEARCH PROJECT RESEDA
The research project RESEDA (Remote Sensor Data Analysis) was conducted by FAW from 1989 through 1992. The project was commissioned by the Environmental Ministry of Baden-Württemberg and by Siemens Nixdorf Informationssysteme AG, Munich. The objective of RESEDA was to develop knowledge-based methods for extracting environmental information from remote sensing data and to integrate these methods into a prototypical software system [GÜNT92a, GÜNT93]. In the course of the project, an integrated working environment for analyzing raster image data of the Earth’s surface was built to extend an image-processing system by the software technologies of geographic information systems and knowledge-based systems: •
•
Additional geographic information (geometric and tabular data) is integrated into the analysis by a geographic information system. The result of the analysis is geocoded environmental information, that is, geographic information that can be transferred into the geographic information system and can be fed back into future analyses, if necessary. The knowledge base of an expert system is used in order to store the necessary knowledge about the target of observation (i.e., the Earth’s surface and its properties) and about the image and geographic data-processing techniques to be applied.
- 17 -
RESEDA Assistant Expert System
Command Scripts
Data Analysis raster analysis data fusion
ra ve ster cto r
ve ras ctor ter
Satellite Data
Environmental Information
Ancillary Data
AAAA AAAA AAAA AAAA AAAA AAAA AAAA AAAA AAAA AAAA AAAA AAAA AAAA AAAA AAAA AAAA AAAA AAAA AAAA AAAA AAAA AAAA AAAA AAAA AAAAAAAAAAAAAAAA AAAA AAAA AAAA AAAA AAAA
Geographical Information System
Fig. 4: The RESEDA working environment
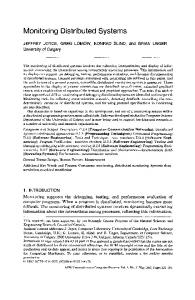
The RESEDA working environment illustrated in figure 4 has been developed in accordance with the knowledge-based functional model shown in figure 3. The components of the working environment are described in the following sections. 3.3.1 A Knowledge-Based Assisting System. The RESEDA Assistant is a knowledgebased assistance system that supports the user in planning and executing the dataprocessing steps necessary for a given analysis [RIEK91]. The RESEDA Assistant consists of a planning component connected with a data-processing system. The user specifies the available data and the desired information. From the specifications of the user, the planning component generates a menu of possible sequences of
- 18 -
data-processing steps, known as processing plans. From this menu, the user can choose a processing plan, which will then be executed by the data-processing system. The dataprocessing system includes an image-processing system and a geographic information system; it consists of components of Siemens Nixdorf’s SICAD product family [SIEM93] and of project-specific extensions. The global control strategy of the planning component is backward chaining. The system first asks for the desired information. This information typically is a piece of geographic information. The desired information may be described by the thematic feature of interest (i.e., which target classes or target attributes are to be recognized), its format (e.g., image, map, or tabular data), and by its accuracy (i.e., qualitative or quantitative results required). The system checks whether data with the desired properties are already available, e.g., image data or geographic information stored in a geographic database. If not available, the system tries to identify a computer-supported method that is suited to compute the desired information from other data. If these data are not present either, the system recursively tries to determine methods that are able to compute these data. The recursion stops when the system tries to determine data items that are explicitely labeled as primary data, that is, data that can immediately be used. A derivation of the requested information is found if these data are also available. During this process it is possible that multiple alternate methods will be identified at some recursion level. If this is the case, all of these methods will be subsequently investigated. This process finally results in a derivation tree that combines all possible computation methods. After computing the derivation tree, the assistant extracts processing plans and presents them to the user. The user may select a processing plan. This processing plan will be translated into a UNIX command procedure (also known as shell script) by a plan compiler. This shell script can be executed by the UNIX command interpreter (the shell) without the assistant expert system being active. The expert knowledge required for planning the data-processing sequences is represented in a knowledge base. Data objects and processing models are the most important units of this knowledge base. Data objects represent the various kinds of data that will be computed during a data analysis: examples are image data or geographic data, and also tabular data such as ground control point coordinates or statistical data. Data objects are knowledge base objects that, in addition to files of physical data, provide metainformation, that is, a description of the semantics of these data. Processing models are abstract descriptions of computer-supported methods. From these descriptions, the RESEDA Assistant determines which data can be computed from the existing data by using a method available to the system. Processing models describe the input and output data of the method as well as how to activate a computer program that implements this method. Constraints are defined on the attributes of the input and output data. These constraints are predicates which are to be fulfilled if the method is being applied. Constraints serve two purposes: on one hand, they can be used to check whether a processing model can be applied; on the other hand, missing attribute values can be computed by means of these constraints.
- 19 -
3.3.2 Fusion of Image Data and Geographic Information. The RESEDA working environment integrates an image-processing system and a geographic information system (GIS) thereby combining the remote sensing data with background information from a GIS. This process of combining different data sources is also called data fusion. The geographic background information that can be input into this data fusion includes the following: • • • • • •
strata, i.e., parts of the region to be analyzed in a uniform way; these parts can be defined according to environmental, cultural, or climatic criteria; training regions for a supervised classification; sampling data for calibrating regression functions, e.g., for estimating the parameters used to transform thermal infrared sensor data into surface temperature values; additional data to be included into the classification, e.g., a digital elevation model; the geometry of the geographic objects to be investigated [BURG92, JANS90]; additional evidence for the presence of a class, e.g., a classification result from the previous year [MIDD91].
The background information may be given in the form of raster data (i.e., digital elevation models or scanned topographic maps) or of vector data, particularly from the Authoritative Cadastral Map ALK or the Authoritative Topographic-Cartographic Information System ATKIS [ADV89] of the State Survey. A particular advantage of integrating the GIS is that the results of an analysis may be stored back into the GIS and can be reused in at least one of the two following ways: First, the results may be further analyzed by using the GIS and may be presented to the user in a cartographic or tabular form. Second, the results may serve as background information for future analyses and can be fed back into the processing system. A commercial database system may be used to manage and to store the background information and the results of the analysis. Data processing in RESEDA is typically raster-based. This is advantageous, because remote sensing data are always given in raster format and additional geographic data are either already rastered or may be rastered by using an appropriate conversion program. Often it is necessary to apply formulas or short program fragments on multiple layers of information on a pixel-by-pixel basis. Particularly in this way a fusion of raster data from various sources is possible, as, for example, during the analysis of satellite data using additional geographic information. Toward this end, a tool is required that allows the user to apply definable analysis functions on raster data. The UNIX tool awk used originally to allow definition of line-by-line operations on sequential data files, was adapted to pixel-bypixel operations on raster image data. Vector/raster and raster/vector conversion software [RIEK93] was developed to allow the integration of vector-oriented geographic databases. The classification of remote sensing data by integrating additional geographic information is a major research issue in RESEDA. In this context, the integration of geographic data during the classification process looks very promising. For this reason, the Bayes classificator, which is commonly used for supervised classification, was modified. As opposed to traditional classification programs which only possess a single output file
- 20 -
containing the most probable class in a pixel-by-pixel coding, the RESEDA classifier generates for any class a dedicated output file which denotes for any pixel the conditional probability of the case that it belongs to the respective class. These probabilities may then be combined with additional evidence from geographic data (e.g., corresponding to the method of Dempster and Schafer [SHAF76]). The calculations required for these methods can be performed using the user-defined raster data analysis functions described above. 3.3.3 Prototypical application. An important part of the work in the RESEDA project was related to a working area known as Prototypical Application. Here FAW cooperated with officials from environmental agencies in Baden-Württemberg. Concrete user requirements were derived to support the development of new methods, and the methods were verified in the course of practical applications. In addition, FAW explored the possible use of satellite-based observation of the Earth for environmental agencies in the State of Baden-Württemberg [MUTZ92]. Two selected examples for monitoring the environment are presented below; these were developed as part of the prototypical application activities. In accordance with the mission of the project, these examples were developed in the context of the Environmental Information System of Baden-Württemberg; their applicability, however, is not limited to the State territory. Figure 5 shows the application of the RESEDA system for monitoring the state of the environment in the Upper Rhine Area. A land-use classification was conducted for the water protection areas near the city of Offenburg. For this purpose, raster image data from the satellite sensor Landsat TM were combined with official vector data from the water protection areas. A supervised maximum likelihood classification was restricted to the water protection areas. The results were visualized on a color map. The background of the image was derived from the infrared TM 4 sensor channel. It was possible to differentiate several land-use classes of interest (particularly built-up area, forest, range land, corn, other agricultural usage, and water bodies) and to produce statistics on the percentage of these areas in water protection areas. The land-use classes built-up area, and corn are represented in dark grey and black, respectively, in figure 5. Such a procedure is particularly suited for monitoring certain areas with respect to dedicated land-use classes. The definition of training areas and the determination of the location of the areas to be observed are tasks which can be fulfilled by using geographical background information. A GIS can be used to include this background information into the classification. In a second example, multi-temporal satellite data and topographic map data were combined in order to detect environmental changes. Figure 6 was generated in the course of a forest monitoring application of the RESEDA system. The locations of the forests were derived from raster data representing a topographic map 1:50,000. Two land-use classifications were performed for September 1989 and May 1990, respectively. The result was projected onto the forest area and the differences were determined (shown in white in figure 6). These white spots stand for damage caused by the cyclones Wiebke and Vivian, which occurred in the time between the two dates. A procedure such as this can be used to monitor the increase or decrease of a particular land use over the years. Examples of changes that may be identified are deforestation, desertification of agricultural areas, expansion of residential or industrial areas, and desiccation of water bodies. For this
- 21 -
Fig. 5: Land use in water protection areas
purpose, the classification result of the previous year may serve as background information for the definition of training areas, and as a source of evidence for possible land-use changes. 3.4 RESULT
An integrated software environment for analyzing remote sensing data was implemented using commercial data-processing software and additional knowledge-based system components that were developed in the RESEDA project. The resulting working environment consists of an image-processing system, a geographical information system, and an expert system. Such a working environment allows the application of very complex data analyses and fusion techniques. Non-experts can be supported by a knowledge-based assisting system. The experience gained during the development of the RESEDA working envi-
- 22 -
Fig. 6: Forest monitoring using remote sensing
ronment, as well as parts of the software developed, were adopted by Siemens Nixdorf’s GIS development department [REIN92]. The decision to focus one part of the project on the prototypical application of the techniques under investigation was of crucial importance for the successful development of computer-based remote sensing techniques. By working on examples that are representative of environmental administration tasks, FAW elaborated the potential of the RESEDA system for deriving environmental information from satellite data, and verified the use of this system in cooperation with experts from environmental authorities. Although the methods developed were primarily designed for integration into the Environmental Information of System Baden-Württemberg, they are also applicable in the global context.
- 23 -
4
Conclusions and Outlook
Regular global environmental monitoring is a necessary prerequisite to preserving Earth’s natural resources. Modern techniques of environmental computer science can make an important contribution. Efficient models, methods, and systems for environmental monitoring are about to leave the arena of research and development; some have already been put into practice. There are more and more initiatives worldwide on this subject, although the financing is often difficult. In countries with a widely established environmental administration and a dense population, these techniques would add to the existing environmental protection practices, whereas in less developed or scarcely populated countries, new techniques of environmental computer science would provide totally new potentials for more effective environmental protection. This is particularly important for the developing countries, where the respective financial requirements for a thorough environmental monitoring can be solved, however, only with the help of the industrial nations and competent international organizations (e.g., United Nations, World Bank). The research projects described here aim at better and more reliable ways to gain extensive information over time on the state of our environment. Such information is particularly important given the current global situation and its rapid and, in some respect, threatening development. Reliable information, including derived prognoses, is a key prerequisite to planning useful action. Taking this into account, one aim is the establishment of socially agreed-upon models, based on worldwide environmental information, of the imminent global changes. Only after reaching this goal might there be a chance of tackling measures for the protection of humanity’s natural basis of living. “Sustainable development” can only become a real political option – and not only a slogan – if these measures are factually sound and politically achievable.
REFERENCES ADV89 BREM89 BURG92
CAMP90 COLW83 COUN90
Arbeitsgemeinschaft der Vermessungsverwaltungen der Länder der Bundesrepublik Deutschland (AdV): Amtliches Topographisch-Kartographisches Informationssystem ATKIS. Landesvermessungsamt NRW. Bonn, 1989 Bremer, S.A.: Computer Modeling in Global and International Relations: The State of the Art. Social Science Computer Review 7(4), 1989 Burger, R.; Mutz, M.: Enrichment of Governmental Surveying Data (ATKIS) by Fusion with Multispectral Space-Borne Sensor Data. Extended Abstract and Poster Presentation. In: Proc. EGIS’92, Third European Conference and Exhibition on Geographical Information Systems, Munich, Germany, March 23-26, 1992 Campbell, W.J.; Cromp, R.F.. Evolution of an Intelligent Information Fusion System. Photogrammetric Engineering and Remote Sensing 56(6):867-870, 1990 Colwell, R.N. (ed.): Manual Of Remote Sensing. Second Edition. American Society of Photogrammetry. Falls Church, Virginia, USA, 1983 Council of the European Communities: Council Directive (90/313/EEC) of 7 June 1990 on the freedom of access to information on the environment. Official Journal of the European Communities, L158:56-58, 23 July 1990.
- 24 -
EHRL75 Ehrlich, P.R.: Population Bomb. New rev. ed. (Orig.), Ballantine Books Inc., 1975 EHRL91 Ehrlich, P.R., Ehrlich A.: The Population Explosion. Touchstone Bks., Simon & Schuster Trade, 04/1991 FAW92 Forschungsinstitut für anwendungsorientierte Wissensverarbeitung (Ed.): Menschenbild und Überbevölkerung. Wissensverarbeitung und Gesellschaft, Vol. 4. Universitätsverlag Ulm GmbH, Ulm, 1992 FLIE93 Fliedner, T.M.; Radermacher, F.J.; Greiner, C.; Bayer, U.; Edrich, J.: Identifying research topics with critical significance for global trends concerning human health and the environment. Interim Report: Standard reference data and policy assistance systems for global health evolution. Günzburg/Donau: WHO Collaborating Center for Global Modeling of Health Perspectives of the International Institute for Scientific Cooperation, Schloß Reisensburg, 1993 FRED83 Freden, S.C.; Gordon Jr., F.: Landsat Satellites. In: COLW83, Vol. I, pp. 517-570 GÜNT91 Günther, O.; Kuhn, H.; Mayer-Föll, R.; Radermacher, F.J. (Eds.): Konzeption und Einsatz von Umweltinformationssystemen. Informatik-Fachberichte 301. SpringerVerlag, Berlin – Heidelberg – New York, 1991 GÜNT92a Günther, O.; Riekert, W.-F. (eds.): Wissensbasierte Methoden zur Fernerkundung der Umwelt. Wichmann-Verlag, Karlsruhe, 1992 GÜNT92b Günther, O.; Schulz, K.-P.; Seggelke, J. (eds.): Umweltanwendungen geographischer Informationssysteme. Wichmann-Verlag, Karlsruhe, 1992 GÜNT93 Günther, O.; Hess, G.; Mutz, M.; Riekert, W.-F.; Ruwwe, T.: RESEDA: A Knowledge-Based Advisory System for Remote Sensing. Journal of Applied Intelligence 3(4):317-341, 1993. HENN93 Henning, I.: “Von Sachdaten zur Führungsinformation” Das Umwelt-FührungsInformationssystem Baden-Württemberg. In: JAES93, pp. 349-358 HERR76 Herrera, A.O. et al.: Catastrophe or New Society? A Latin American World Model. International Development Research Center, Ottawa, 1976 HUM92 Human Development Report 1992, published for the United Nations Development Programme (UNDP). Oxford University Press, New York, 1992 JAES93 Jaeschke, A.; Kämpke, T.; Page, B.; Radermacher, F.J.: Informatik für den Umweltschutz. Springer-Verlag, Berlin – Heidelberg – New York, 1993 JANS90 Janssen, L.L.F.: GIS Supported Land Cover Classification of Satellite Images. In: Proceedings of the EGIS’90 Conference, Amsterdam, 1990 KEUN91 Keune, H.; Murray, A.B.; Benking, H.: Harmonization of Environmental Measurement. GeoJournal 23(3):249-255. Kluwer Academic Publishers, Dordrecht – Boston, 1991 KOHM93 Kohm, J.: Das Technosphäre- und Luft-Informationssystem als Instrument für die Entscheider in der Umweltschutzverwaltung. In: JAES93, pp. 369-380 MAYE93 Mayer-Föll, R.: Das Umweltinformationssystem Baden-Württemberg; Zielsetzung und Stand der Realisierung. In: JAES93, pp. 313-337 MEAD72 Meadows, D.L. et al.: The Limits to Growth. Universe Books, New York, 1972 MEAD74 Meadows, D.L. et al.: Dynamics of Growth in a Finite World. Wright-Allen Press, Cambridge, MA, 1974 MESA74 Mesarovic, M.; Pestel, E.: Mankind at the Turning Point. Hutchinson, London, 1974 MIDD91 Middelkoop, H.; Janssen, L.L.F.: Knowledge-Based Image Classification. In: GÜNT91, pp. 303-327 MINI90 Ministerium für Umwelt Baden-Württemberg, McKinsey and Company, Inc.: Konzeption des ressortübergreifenden Umweltinformationssystems (UIS) im Rahmen des Landessystemkonzepts Baden-Württemberg. Vol. 1-12, Stuttgart, 1987-1990.
- 25 -
MÜLL92 Müller, M.: Entwicklung des Arten-Landschafts-Biotopinformationssystems (ALBIS) als übergreifende Komponente des Umweltinformationssystems Baden-Württemberg. In: GÜNT92b, pp. 64-70 MÜLL93 Müller, M.: Entwicklung des Räumlichen Informations- und Planungssystems (RIPS) als übergreifende Komponente des Umweltinformationssystems Baden-Württemberg. In: JAES93, pp. 359-368 MUTZ92 Mutz, M.: GIS-unterstützte Auswertungen von Satellitendaten für die Zwecke der Umweltverwaltung des Landes Baden-Württemberg. In: GÜNT92a, pp. 91-110 MYER83 Myers, V.I.: Remote Sensing Applications in Agriculture. In: COLW83, Vol. II, pp. 2111-2228 NIEM87 Niemann, H; Bunke, H.: Künstliche Intelligenz in Bild- und Sprachanalyse. B.G. Teubner, Stuttgart, 1987. OEHM90 Oehme, W.: Energie und Umwelt – Die Herausforderung des nächsten Jahrhunderts. In: FAW92, pp. 159-177 PILL90 Pillmann, W.; Jaeschke, A. (eds.): Informatik für den Umweltschutz. InformatikFachberichte 256. Springer-Verlag, Berlin – Heidelberg – New York, 1990. RADE91 Radermacher, F.J.: The Importance of Metaknowledge for Environmental Information Systems. In: Günther, O.; Schek, H.-J. (eds.): Large Spatial Databases. Proceedings. LNCS 525, pp. 35-44, Springer-Verlag, Berlin – Heidelberg – New York, 1991 RADE92 Radermacher, F.J.: Identifying Research Topics with Critical Significance for Global Trends Concerning Environment and Human Health. In: Modeling Global Development Processes and their Relevance to Human Health. WHO-Workshop. FAW Ulm, 10.-12. Sept. 1992 REIN92 Reinhardt, W.; Speer, T.; Yang, H.: Combined Vector and Raster Data Processing for Environmental Applications Using SICAD. Geo-Informations-Systeme 5(2):24-32. Wichmann-Verlag, Karlsruhe, 1992. RIEK91 Riekert, W.-F.: Providing Declarative Access to a Processing System for Satellite Image Data. In: Boley, H.; Richter, M.M. (eds.): Processing Declarative Knowledge. LNCS 567. Springer-Verlag, Berlin – Heidelberg – New York, 1991 RIEK93 Riekert, W.-F.: Extracting Area Objects from Raster Image Data. IEEE Computer Graphics and Applications 13(2):68-73. IEEE Computer Society, Los Alamitos, CA, 1993 SCHE93 Scheuer, K.: Knowledge-based Interpretation of Gas Chromatographic Data. Chemometrics and Intelligent Laboratory Systems 19:201-216, Elsevier Science Publishers B.V., Amsterdam, 1993. SHAF76 Shafer, G.: A Mathematical Theory of Evidence. University Press, Princeton, 1976 SIEM93 SICAD-open. Siemens Nixdorf Informationssysteme AG, München, 1993 STIF91 Stiftung Entwicklung und Frieden: Globale Trends, Daten zur Weltentwicklung. Düsseldorf, 1991 SOKO93 Sokol, G.: The Research Project ZEUS: A Method Base for Groundwater Quality Network Design. 1994 ESRI User Conference. Proceedings. Environmental Systems Research Institute, Inc. (ESRI), Redlands, CA, 1994 SONT92 Sontheimer, M.: Die Erde ist voll. In: FAW92, pp. 69-84 SWAI73 Swain, P.H.; Davis, S.M. (eds.): Remote Sensing: The Quantitative Approach. McGraw-Hill, New York – Toronto, 1978 WELT92 Weltentwicklungsbericht 1992, Entwicklung und Umwelt. Weltbank. Washington, D.C., 1992 WORL87 World Commission on Environment and Development: Our Common Future. Oxford University Press, New York, 1987
- 26 -
Authors: Oliver Günther received his Ph.D. in Computer Science from the University of California at Berkeley in 1987. From 1989 until 1993, he headed the Environmental Information Systems Division of FAW (Research Institute for Applied Knowledge Processing) in Ulm, Germany. Since 1993, he has been Professor and Director of the Institute of Information Systems at Humboldt University in Berlin. He serves as a consultant to various government agencies and industrial companies on issues relating to information systems and environmental data management. Franz Josef Radermacher is the Scientific Director and Chairman of the Board of FAW (Research Institute for Applied Knowledge Processing) in Ulm, Germany, and also Professor of Computer Science at the University of Ulm. FAW aims at the mastery of complex systems in application fields such as computer integrated manufacturing, enterprise integration / decision support systems, environmental information systems, assisting systems / traffic management, communication systems / industrial software production, autonomous systems / mechatronics. FAW’s current sponsors are the State of BadenWürttemberg and the industrial companies Daimler Benz AG, Digital Equipment GmbH, Hewlett-Packard GmbH, IBM Germany GmbH, Robert Bosch GmbH, Siemens Nixdorf Informationssysteme GmbH, and strässle Informationssysteme GmbH. Wolf-Fritz Riekert is a Senior Scientist at FAW (Research Institute for Applied Knowledge Processing) in Ulm, Germany, where he heads the Environmental Information Systems Division. He received his degree in mathematics from the University of Stuttgart in 1976. After working for some time as a software consultant, he completed his doctorate on knowledge-based human-computer interaction at the University of Stuttgart in 1986. Since 1987, he has managed several projects on programming systems, image processing systems, geographic information systems, and object-oriented databases for Siemens, Siemens Nixdorf, and the Environmental Ministry of Baden Württemberg. One of these projects was RESEDA (Remote Sensor Data Analysis), which was conducted at FAW Ulm.
- 27 -