Carew et al. Frontiers in Zoology 2013, 10:45 http://www.frontiersinzoology.com/content/10/1/45
RESEARCH
Open Access
Environmental monitoring using next generation sequencing: rapid identification of macroinvertebrate bioindicator species Melissa E Carew1*, Vincent J Pettigrove1, Leon Metzeling2 and Ary A Hoffmann1,3
Abstract Introduction: Invertebrate communities are central to many environmental monitoring programs. In freshwater ecosystems, aquatic macroinvertebrates are collected, identified and then used to infer ecosystem condition. Yet the key step of species identification is often not taken, as it requires a high level of taxonomic expertise, which is lacking in most organizations, or species cannot be identified as they are morphologically cryptic or represent little known groups. Identifying species using DNA sequences can overcome many of these issues; with the power of next generation sequencing (NGS), using DNA sequences for routine monitoring becomes feasible. Results: In this study, we test if NGS can be used to identify species from field-collected samples in an important bioindicator group, the Chironomidae. We show that Cytochrome oxidase I (COI) and Cytochrome B (CytB) sequences provide accurate DNA barcodes for chironomid species. We then develop a NGS analysis pipeline to identifying species using megablast searches of high quality sequences generated using 454 pyrosequencing against comprehensive reference libraries of Sanger-sequenced voucher specimens. We find that 454 generated COI sequences successfully identified up to 96% of species in samples, but this increased up to 99% when combined with CytB sequences. Accurate identification depends on having at least five sequences for a species; below this level species not expected in samples were detected. Incorrect incorporation of some multiplex identifiers (MID’s) used to tag samples was a likely cause, and most errors could be detected when using MID tags on forward and reverse primers. We also found a strong quantitative relationship between the number of 454 sequences and individuals showing that it may be possible to estimate the abundance of species from 454 pyrosequencing data. Conclusions: Next generation sequencing using two genes was successful for identifying chironomid species. However, when detecting species from 454 pyrosequencing data sets it was critical to include known individuals for quality control and to establish thresholds for detecting species. The NGS approach developed here can lead to routine species-level diagnostic monitoring of aquatic ecosystems. Keywords: Invertebrates, Barcoding, Bioassessment, 454 pyrosequencing, Chironomidae
Introduction Invertebrates represent a key indicator group for monitoring environmental change in many different ecosystems e.g. [1-4]. Invertebrate communities are useful for assessing ecosystem health, as they are common and widespread, with high species diversity and varying sensitivity to environmental disturbances [5]. While considerable effort has * Correspondence:
[email protected] 1 Department of Zoology, Victorian Centre for Aquatic Pollution Identification and Management (CAPIM), The University of Melbourne, Victoria 3010, Australia Full list of author information is available at the end of the article
gone into developing protocols that utilize invertebrate communities for environmental monitoring, particularly for monitoring freshwater ecosystems [6], a major challenge has been identification to the ‘species’ level. Few species are easily recognized. For most a high level of taxonomic expertise is required, which is more difficult when traditional keys or other reference material is of variable quality or lacking. As a result, identification error rates are significantly higher than for species than family level identifications, impacting quality assurance [7,8]. Furthermore, some specimens cannot be identified beyond higher taxonomic levels as they are morphologically immature, cryptic or
© 2013 Carew et al.; licensee BioMed Central Ltd. This is an Open Access article distributed under the terms of the Creative Commons Attribution License (http://creativecommons.org/licenses/by/2.0), which permits unrestricted use, distribution, and reproduction in any medium, provided the original work is properly cited.
Carew et al. Frontiers in Zoology 2013, 10:45 http://www.frontiersinzoology.com/content/10/1/45
represent little known groups [9]. As a result, cruder levels of identification are often used for monitoring. Even though identification at higher taxonomic levels, such as families, can be effective at broader regional or catchment scales to examine the magnitude of impacts or to classify sites, it can miss impacts or changes at smaller scales [10]. It is also less likely to be diagnostic of the specific factors impacting an ecosystem, as genera and species within the same families vary in their responses to pollutants and environmental characteristics [11-13]. For this reason, there has been a move towards generating species and genus level responses to pollutants in some regions [14-17]. However, for diagnostic monitoring that uses the responses of species or genera to be more widely adopted, species identification needs to be more cost effective, rapid and accurate. DNA sequencing, including ‘DNA barcoding’, can overcome the issues associated with morphological identification and can offer an alternative for making routine species level identifications. DNA sequences can be easily obtained, analysed and interpreted and, with few exceptions, are highly accurate for identifying invertebrate species [18-23]. DNA sequencing certain gene regions has proven useful for understanding species diversity in many taxonomically difficult or poorly studies groups e.g. [24-27] and is often included as part of integrated taxonomic studies e.g. [28-32]. DNA-based species identification can detect more species with greater accuracy than traditional morphological methods for environmental monitoring [8]. However, until recently it has not been feasible to use sequencing for routine monitoring. Even with automated extraction, PCR and sequencing, species would need to be individually sorted which is both laborious and expensive [9,33]. Next generation sequencing (NGS) has potential to be used for routine environmental monitoring as, in a single instrument run, multiple species in many samples can be simultaneously sequenced, reducing the time and cost involved in sample processing [9,33]. Currently, 454 pyrosequencing has been the most widely applied NGS technique for identifying species, as it produces the longer sequences needed for accurate identification compared to other NGS platforms [34]. Most studies employing 454 pyrosequencing in environmental monitoring have focused on method development and testing specific taxonomic groups or environmental samples, such as those from estuarine, marine or rainforest habitats e.g. [33,35-39]. However, continued effort is needed to test NGS to establish if one or more barcoding sequences are adequate for identifying species, and also to determine the detection limits for species in mixed samples along with potential error rates. Furthermore, there is a need for simple analysis pipelines to deal with NGS data that use new bioinformatic tools and software [33,40].
Page 2 of 15
Over the past decade, we have been examining pollution responses and testing DNA sequences for species identification in the Chironomidae [12,13,41-44]. Chironomids are a speciose group consisting of taxa that vary in their responses to pollution and other environmental characteristics, and they are an important biological indicator group for monitoring, assessing and classifying aquatic environments [45-47]. They are particularly useful as indicators of aquatic pollution in urban areas, because they can dominate benthic urban macroinvertebrate fauna in these areas, representing up > 50% of the aquatic insect species collected in benthic surveys [46,48-50]. In field surveys and field based microcosm experiments, chironomid species are diagnostic of particular types of pollution and environmental characteristics [13,41,43,44,51-53]. Through validating field surveys with field based microcosm experiments, we have begun to characterise the distribution of many local chironomid species and their sensitivity to sediment pollution and other environmental characteristics. While taxonomic keys for chironomid identification are available e.g. [54,55], many genera consist of morphologically cryptic species and many species remain undescribed. Where species level identification is possible, it typically requires slide mounting and considerable taxonomic expertise. However, DNA sequences, primarily involving the mitochondrial Cytochrome oxidase I (COI) DNA barcode region, are effective for broadly identifying chironomid species [23,56-58]. In this study we develop 454 pyrosequencing for identifying chironomid species from field collected samples. We test whether 454 pyrosequencing of two gene regions commonly used for molecular species identification – mitochondrial COI and Cytochrome B (CytB) – can accurately reflect the composition of chironomid species at ten field sites. We first identify species from the sites individually then pool samples for 454 pyrosequencing. A simple pipeline is presented for running and analysing the data from such environmental samples.
Results Individual species identification
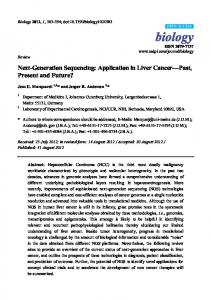
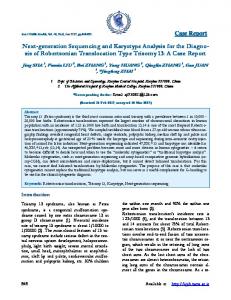
Identification of chironomid samples from the ten field sites indicated 46 chironomid species from three subfamilies (Table 1). Diversity of species ranged from 7 to 14 per site, identified from 32 to 167 individuals collected per site, with a total of 768 individuals collected overall. While 26 species could be identified, the remaining 20 species represented new or known species that could not be identified using only larval keys. These species are denoted as sp.‘x’. Neighbour joining trees for COI and CytB based on up to ten sequences per species for the shorter ‘454 sized’ amplicons showed all species formed distinct groups and these groups were supported by high bootstraps (Figure 1).
Species
Field sites BR08 n
(reads)
DB09 n
(reads)
GC09 n
(reads)
HW09 n
(reads)
Chironomus australis
100
(5318)
Chironomus cloacalis
18
(998)
LE09 n
MC09
ME09
RL09
SK09
UK09
(reads)
n
(reads)
n
(reads)
n
(reads)
n
(reads)
n
(reads)
1
(318)
0
(2)
18
(2370)
1
(394)
1
(8)
71
(5519)
11
(1580)
1
(79)
1
(23)
5
(511)
1
(253)
Chironominae
Chironomus duplex
6
(405)
3
(149)
Chironomus februarius
22
(1104)
6
(821)
57
(6197)
Chironomus tepperi
3
(166)
Cladopelma sp.1
0
(4)
3
(225)
20
(861)
6
(2327)
(1)
2
(82)
22
(780)
1
(298)
(4803)
1
(0)
3
(96)
1
(6)
8
(292)
1
(10)
6
(198)
1
(579)
1
(18)
2
(895)
Chironomus nepeanensis Chironomus oppositus
3
(35)
2
(603)
1
(934)
2
(815)
Chironomus pseudoppositus
2
(869)
Cladopelma sp.2 1
(16)
Dicrotendipes pseudoconjunctus
4
(999)
3
(100)
Dicrotendipes septemmaculatus
0
(1)
1
(17)
Cladotanytarsus australomancus Cladotanytarsus sp.C
1
14
(4239)
1
(1064)
(7) 6
(479)
21
(4724)
Dicrotendipes sp.4 Dicrotendipes sp.A
2
Kiefferulus cornishi 7
Kiefferulus intertinctus
(581)
(1877)
1
(686)
3
(1171)
1
(30)
Kiefferulus martini
2
(32)
1
(168)
1
(29)
4
(516)
4
(75)
1
(177)
4
(1737)
1
(236)
5
(1483)
1
(63)
1
(9)
Microchironomus forcipatus Parachironomus delinificus
1
(430)
Parachironomus sp.3
3
(324) 1
Paratanytarsus grimmii
(308)
1
(10)
3
(264)
Paratanytarsus sp.D Polypedilum convexum
1 3
Polypedilum sp.C
43
(2367)
(18) (7)
(7)
(913)
6
(905)
9
(401)
0
(2)
2
(929)
1
(284)
Page 3 of 15
Polypedilum sp.E 1
1 1
(332)
Polypedilum nubifer
Riethia stictoptera
32
Carew et al. Frontiers in Zoology 2013, 10:45 http://www.frontiersinzoology.com/content/10/1/45
Table 1 Species collected at field site as determined by individual identification and 454 pyrosequencing
Tanytarsus inextentus
1
(22)
1
(74)
1
(5)
Tanypodinae Ablabesmyia sp.2
1
(46)
Coelopynia sp.1
1
(26)
Paramerina sp.4 Procladius paludicola
11
(1702)
Procladius sp.1 Procladius sp.2
39
0
9
(349)
4
(1382)
(4609)
0
1
(18)
5
(664)
(1)
0
(1)
2
(95)
0
(2)
(4)
Procladius villosimanus
2
(285)
2
(1392)
2
(16)
1
(27)
2
(27)
30
(6660)
Orthocladiinae Botryocladius sp.1
1
(96)
Corynoneura scutellata Cricotopus albitarsis
4
(156)
1
(3)
19
(3930)
Cricotopus annuliventris Cricotopus sp.1 Cricotopus sp.2
4
(31)
6
Paralimnophyes sp.1
2
Paratrichocladius sp.1
1
1
(1009)
(69)
(6)
Paratrichocladius sp.2 Total number of individuals
1 69
Total number of reads Total number of species
78 8551
12
32 7299
10
167 9069
8
98 9063
11
(3)
Carew et al. Frontiers in Zoology 2013, 10:45 http://www.frontiersinzoology.com/content/10/1/45
Table 1 Species collected at field site as determined by individual identification and 454 pyrosequencing (Continued)
28 10543
13
51 9212
7
99 9101
11
50 9583
14
(211) 96 10236
9
9227 12
The number of individuals collected in this study at each field site (n) and the number of sequences (reads) from the 454 pyrosequencing experiments representing each species in parentheses. Differences in species detected by individual identification and by 454 pyrosequencing are bolded.
Page 4 of 15
Carew et al. Frontiers in Zoology 2013, 10:45 http://www.frontiersinzoology.com/content/10/1/45
a
100 99 100 100 58
100 100 100 93 100 100 100 100 100 100 100 100 100 100 100 100 60 100 100 100 100 100
62 100 100 100 100 99 100 100 100 100 100 89 100 100 100 100 100 100 51 100 100 100 100 100 52 100 100 84 100
0.10
0.08
0.06
0.04
0.02
Chironomus oppositus (10) Chironomus pseudoppositus (4) Chironomus tepperi (9) Chironomus duplex (10) Chironomus australis (10) Chironomus februarius (10) Chironomus cloacalis (10) Kiefferulus cornishi (7) Kiefferulus intertinctus (10) Kiefferulus martini (7) Parachironomus sp.3 (3) MIcrochironomus forcipatus (10) Cladopelma sp.1 (9) Parachironomus delinificus (5) Cladopelma sp.2 (8) Dicrotendipes psuedoconjunctus (10) Dicrotendipes sp.4 (7) Dicrotendipes sp.A (9) Polypedilum nubifer (10) Polypedilum sp.E (9) Polypedilum sp.C (10) Chironomus nepeanensis (2) Polypedilum convexum (2) Dicrotendipes septemmaculatus (6) Riethia stictoptera (10) Cladotanytarsus australomancus (10) Cladotanytarsus sp.C (5) Paratanytarsus grimmii (10) Paratanytarsus sp.D (4) Tanytarsus inextentus (10) Procladius villosimanus (10) Procladius sp.1 (7) Procladius sp.2 (5) Procladius paludicola (10) Ablabesmyia sp.2 (3) Coelopynia sp.1 (10) Paratrichocladius sp.1 (8) Paramerina sp.4 (2) Paratrichocladius sp.2 (8) Cricotopus annuliventris (3) Cricotopus sp.2 (10) Cricotopus sp.1 (10) Cricotopus albitarsis (10) Corynoneura scutellata (5) Botryocladius sp.1 (1) Paralimnophyes sp.1 (9)
0.00
Nucleotide K2P distance
Page 5 of 15
b
99 99 99 99 99 65 99
99 99 99 99 99 99 99 99 51 99 99 99 99 99 99 99 99 99 89 99 99 99 99 99 99 91 99 99 88 99
60
99
96 99 55 99 58
99 79 99 99 99
68 99 99 53 99 99 99
0.12
0.10
0.08
0.06
0.04
0.02
Chironomus oppositus (10) Chironomus pseudoppositus (4) Chironomus tepperi (8) Chironomus duplex (10) Chironomus australis (10) Chironomus nepeanensis(1) Chironomus februarius (10) Chironomus cloacalis (10) Kiefferulus intertinctus (4) Kiefferulus cornishi (5) Parachironomus delinificus (5) Dicrotendipes sp.A (6) Dicrotendipes septemmaculatus (3) Cladopelma sp.2 (5) Cladopelma sp.1 (6) Microchironomus forcipatus (5) Parachironomus sp.3 (3) Dicrotendipes sp.4 (4) Dicrotendipes pseudoconjunctus (10) Kiefferulus martini (5) Riethia stictoptera (10) Cladotanytarsus australomancus (10) Cladotanytarsus sp.C (1) Polypedilum convexum (2) Paratanytarsus sp.D (3) Polypedilum nubifer (8) Paratanytarsus grimmii (10) Tanytarsus inextentus (10) Polypedilum sp.E (5) Polypedilum sp.C (10) Procladius villosimanus (10) Procladius sp.1 (7) Procladius sp.2 (3) Procladius paludicola (10) Ceolopynia sp.1 (9) Ablabesmyia sp.2 (2) Paramerina sp.4 (4) Corynoneura scutellata (6) Paratrichocladius sp.1 (10) Paratrichocladius sp.2 (6) Paralimnophyes sp.1 (8) Botryocladius sp.1(1) Cricotopus annuliventris(1) Cricotopus albitarsis (7) Cricotopus sp.1 (10) Cricotopus sp.2 (10)
0.00
Nucleotide K2P distance
Figure 1 Bootstrapped Kirma-2-parameter trees examining the genetic distance between the species found in this study. Neighbour joining trees are based on the 46 chironomid species that occurred at the ten field sites for two gene regions a) COI b) CytB used in this study. Both trees are construct using the same regions used to identify species in the 454 pyrosequencing experiments (395 bps for COI and 343 bps for CytB) and show the level of intraspecific variation (represented by black triangles) based on sequences from up to ten individuals pre species (the number of individuals is given in parentheses) from our DNA reference libraries.
Mean intraspecific nucleotide variation within species ranged from 0–4.2% for COI and 0–4.4% for CytB, while mean inter-specific variation ranged from 7–34.1% for CytB and 8.7-34.1% for COI, also indicating that the 454 COI and CytB amplicons were suitable for separating species. GenBank accession numbers for these sequences are given in Additional file 1: Table S1. Species identification of control samples using 454 pyrosequencing
First, we investigated the quality of sequences generated in the 454 pyrosequencing experiment by examining the three control samples containing the two Chironomus februarius individuals (Cf1 and Cf2) and a Chironomus cloacalis (Cc1) individual in the two biological replicates (runs). Megablast searches of 454 sequences from these individuals against the Sanger generated sequences for the same individual showed >99% of sequences were >98% match to the Sanger generated sequences for COI in both biological replicates. Megablast matches were lower for
CytB where >89% of sequences showed a >98% match in the first biological replicate (run) and >93% in the second biological replicate (run). However, when a >97% match was considered for CytB, >98% and >99% of sequences matched the Sanger generated sequence for the same individual for the first and second biological replicate, respectively. Based on these results and the levels of intraand inter-specific diversity found in our DNA reference database, we identified a ‘species’ if a 454 sequence shared >97% match in megablast searches to a Sanger generated sequence in our DNA reference database. We then searched the control sequences against our entire DNA reference database. While nearly all sequences generated in the 454 pyrosequencing experiment provided 97% match to species the COI and CytB DNA reference database.
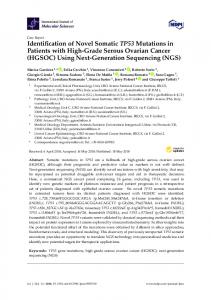
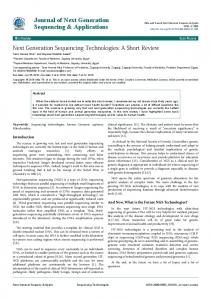
Figure 5 Experimental design and data analysis pipeline. The first half of the pipeline (in blue) shows the experimental set up, where species in samples were amplified individually (using morphology, PCR-RFLP and Sanger sequencing) and in bulk using 454 pyrosequencing. The second half of the pipeline (in orange) deals with the analysis of the sequences generated with 454 pyrosequencing.
These individuals were Sanger sequenced to generate a consensus sequence and used to assist assigning of sequences to species from the 454 pyrosequencing experiment and to examine the quality of the 454 pyrosequencing data. The 454 pyrosequencing experiment was completed as two duplicate quarter plate runs with each quarter containing a biological replicate. The biological replicates were initiated after the bulk DNA extraction step where we took two aliquots of each DNA extraction, which represented a site/ control. These were used for
PCR and 454 pyrosequencing. All steps for each biological replicate were performed independently. PCR conditions for 454 pyrosequencing
A two-step PCR process involving a universal tail design was used to obtain amplicons for 454 pyrosequencing. The first PCR involved independently amplifying the two mitochondrial genes from each genomic DNA sample. For this purpose a new PCR primer for each mitochondrial gene was designed to produce amplicons
Carew et al. Frontiers in Zoology 2013, 10:45 http://www.frontiersinzoology.com/content/10/1/45
Page 12 of 15
Table 4 Collection information for Chironomidae samples used in the 454-pyrosequencing experiment Site code
Site
Date
Latitude
Longitude
BR08
Barwon River at Pollocksford Rd, Stonehaven, Victoria, Australia
13-Oct-08
−38.15
144.19
DB09
Deep Creek at Bulla Rd, Bulla, Victoria, Australia
7-Oct-09
−37.63
144.80
GC09
Gardiners Creek at High St, Glen Iris, Victoria, Australia
13-Oct-09
−37.89
145.14
HW09
Highlands Wetland Estate, Cragieburn, Victoria, Australia
9-Oct-09
−37.59
144.90
LE09
Lynbrook Estate Wetlands at Lynbrook Boulevard, Lynbrook, Victoria, Australia
6-Oct-09
−38.06
145.25
MC09
Maribyrnong River at Caulder Hwy, Keilor, Victoria, Australia
7-Oct-09
−37.69
144.80
ME09
Brodies Lakes at Greenvale Reservoir Park, Greenvale, Victoria, Australia
12-Oct-09
−37.63
144.89
RL09
Red Leap Reserve, Mill Park, Victoria, Australia
9-Oct-09
−37.67
145.06
SK09
Shankland Wetland, Meadow Heights, Victoria, Australia
12-Oct-09
−37.65
144.91
UK09
Platypus Ponds, Sunbury, Victoria, Australia
7-Oct-09
−37.55
144.74
of optimal size (