Available online at www.sciencedirect.com
ScienceDirect Procedia - Social and Behavioral Sciences 160 (2014) 178 – 187
XI Congreso de Ingeniería del Transporte (CIT 2014)
Environmental performance of Brazilian container terminals: a data envelopment analysis approach Vanessa de Almeida Guimarãesa, Ilton Curty Leal Juniorb*, Pauli Adriano de Almada Garciab a
Universidade Federal do Rio de Janeiro, Centro de Tecnologia, Bloco H, Cidade Universitária, CEP 21.949-900, Rio de Janeiro, Brazil Universidade Federal Fluminense, Rua Nestor Rodrigues Perlingeiro, 783, Aterrado, Volta Redonda, 27213-145 Rio de Janeiro,Brazil
b
Abstract Despite being critical for economic development, port operations cause environmental impacts. Therefore, this article aims to evaluate the performance of Brazilian container terminals establishing a ranking based on ecoefficiency performance. Documental and bibliographic researches were carried out to gather the necessary data. So, a data envelopment analysis model was applied as a support tool to evaluate the ports’ performances. As result, four ports were considered benchmarks, which mean that they reached 100% as relative ecoefficiency. Besides, we determine how much each non-ecoefficient terminal must be improved and what they should do better in order to reach the ecoefficiency frontier. © 2014 The Authors. Published by Elsevier Ltd. This is an open access article under the CC BY-NC-ND license © 2014 The Authors. Published by Elsevier Ltd. (http://creativecommons.org/licenses/by-nc-nd/3.0/). Selection and peer-review underof responsibility Peer-review under responsibility CIT 2014. of CIT 2014. Keywords: ecoefficiency; performance assessment; data envelopment analysis; container terminal
1. Introduction Environmental issue is among the major world concerns and, then, it should be extended to transportation activities, which are considered one of the main sources of environmental influences. Approximately 62% of global consumption of oil derivatives was used in transportation sector in 2010 (IEA, 2012). In Brazil, 53% of the amount consumed was applied in the transportation sector (EPE, 2012a). The waterway mode represents 18.1% of cargo transported in the country (EPE 2012b) and, in 2010, were handled 6,822,657 Twenty Feet Equivalent Unit - TEUs
* Corresponding author. Tel.: 55 24 30768775 E-mail address:
[email protected]
1877-0428 © 2014 The Authors. Published by Elsevier Ltd. This is an open access article under the CC BY-NC-ND license (http://creativecommons.org/licenses/by-nc-nd/3.0/).
Peer-review under responsibility of CIT 2014. doi:10.1016/j.sbspro.2014.12.129
Vanessa de Almeida Guimarães et al. / Procedia - Social and Behavioral Sciences 160 (2014) 178 – 187
(ANTAQ, 2011), an amount 11.7% higher than in 2009. These data show how important the port activities are to national economy while reinforcing the concern about the large potential impacts of this activity (Cunha, 2006). Therefore, environmental impact assessment from port activities and operations is a necessary issue in a decision making process concerning ecoefficiency concept, which combine economic and environmental characteristics. Hence, this work was based on the concept of eco-efficiency, which combine different efficiency objectives (higher cargo handling with minimal use of resources) and reduction of environmental influences. Hence, this study aims to analyze the operations performance of container terminals, based on the eco-efficiency concept using a data envelopment analysis (DEA) approach. So, it were established the following specific objectives: (1) identify the environmental indicators associated to port environment, specifically in container terminal; (2) identify the relative performance of the terminals using DEA model with variable returns of scale (VRS model) and (3) determine how much the non-ecoefficient terminals should improve to reach the ecoefficient frontier. It should be observed that a port is composed of different kind of terminals and, consequently, its impact varies with the kind of the cargo handled. This work is restricted to evaluate container terminals. In addition, the evaluation was delimited only to the loading, unloading and handling activities that take place in the inner area of the container terminals listed in ANTAQ Statistical Yearbook (2011). Environmental influences arising from operations of ship or railway were not considerate. The importance of considering an operation that provides, simultaneously, customer satisfaction, reducing environmental influences, justifies the relevance of this research in the social, economic and environmental angle. Following this introduction, the article has been divided into four sections: (i) eco-efficiency in container terminals reviews (ii) methodological procedures, (iii) data analysis and discussion and (iv) final considerations. 2. Ecoefficiency in Container Terminals Operations of loading, unloading and handling in container terminals can cause environmental impacts (local, regional and global), affecting the quality of terrestrial, aquatic and atmospheric environments. Pollution of water and soil, for example, is mostly due to the disposal of wastewater (sewage, ballast water, waste water, gray water, oils) and to the generation of solid waste (scrap, tires, batteries, plastic, wood) that occurs during operation (Valois, 2009). Air pollution, in its turn, derives mainly from burning fossil fuels, which are the foremost source of energy used in transportation vehicles and handling equipment. Thus, there are high rates of air pollutants and greenhouse gases – GHG emissions, especially CO2 (Cunha, 2006; Valois, 2009; Guimarães and Leal Jr, 2013). Robles et al. (2012) also highlight the significant consumption of energy, water and materials arising from port activities. So, the adoption of eco-efficiency measures for the performance analysis of port terminals can bring them benefits, since this concept leads organizations to become, at the same time, more environmentally responsible and profitable for applying innovations in order to increase its competitiveness (WBCSD, 2000 and 2006). Eco-efficiency can then be understood as the ability to deliver goods and services that, at the same time: satisfies customers need; meets the attributes of quality and cost; achieves production and performance targets stipulated by organizations and promotes a progressive reduction of environmental influences. It is an approach that focuses on the proper use of materials and energy resources in order to reduce costs and/or improve profits (WBCSD, 2000 and 2006; Pereira, 2005; Mickwitz et al, 2006; Braungart et al, 2007; Leal Jr., 2010; EPA, 2011; Leal Jr. and D'Agosto, 2011; Leal Jr. et al, 2012; Guimarães and Leal Jr., 2013). Using concepts of eco-efficiency requires the application of specific measures based on the relative value of the product (or service) with environmental influences, represented by equation 1. As suggested by Leal Jr. and D'Agosto (2011), it is possible to use only one indicator for the value of service (as numerator), combining it with the most representative indicators of environmental influences considered. 継潔剣結血血件潔件結券潔検 噺
撃欠健憲結"剣血"建月結"喧堅剣穴憲潔建"剣堅"嫌結堅懸件潔結 継券懸件堅剣券兼結券建欠健"件券血健憲結券潔結嫌
(1)
Analyzing equation 1, one can see that an increase in the value of the product or service and/or a reduction in environmental influences reflect, positively, on the eco-efficiency measure and, hence, on corporate performance. It is capable to obtain a higher performance because it is a direct relationship between how much is produced
179
180
Vanessa de Almeida Guimarães et al. / Procedia - Social and Behavioral Sciences 160 (2014) 178 – 187
(represented by the value of the product or service) and resources used (represented by environmental influences). From these two aspects, one can work within a framework of performance evaluation proposed by Leal Jr and D'Agosto (2010) and adapted to the context of container terminals, as shown in Table 1. It was elaborated based on: Pereira (1983), Santana Filho (1984 and 1992), WBCSD (2000 and 2006), Ballou (2001), Chopra and Meindl (2003), Fleury and Wanke (2003), FHWA US DOT (2005), Martins et al. (2005), Bowersox and Closs (2007), Leal Jr (2010), Leal Jr. et al. (2012) and Leal Jr., D’Agosto and Garcia (2012). In order to better understand the implementation of actions aiming the improvement of the eco-efficiency in container terminals, Leal Junior and Guimarães (2013) did a bibliographic and a documentary surveys, selecting the international container terminals with highest handling rate (Noteboom 2004; Journal Of Commerce, 2012). The authors found that the main container terminals in the world do not have an effective policy for eco-efficiency: from the 60 ports surveyed, only 30% publish environmental reports and just four of them prepare full inventories reports of GGE emissions and air pollutants. Table 1: Aspects, attributes and indicators related to the ecoefficiency concept Aspects Attributes Indicators Unit Monetary value associated to the volume of the cargo handling US$ Monetary value Net revenue of the terminal US$ Number of containers handled TEUs Service Value(1) Service produced Volume handled m³ Quantity handled t Total energy consumption MJ Energy consumption Total consumption of renewable energy(2) MJ Number of accidents in container handling qty Safety Total cost of accidents US$ Emission of CO2 t Emission of water vapor t GHG emission Emission of methane t Emission of CFCs t Emission of hydrocarbons t Emission of aldehydes t Emission of CO t Atmospheric pollution Emission of N2O t Emission of acidifying gases (SOx, NOx) t Emission of particulates t Amount of oil disposed by handling equipments l Environmental Dispose of lubrificants l Influences Water and soil Chemical spills l pollution Solid waste generation t Generation of grey water / water ballast (ships) l Sewage generation l Total intensity of noise emitted by handling equipments Db Noise pollution Intensity of noise emitted by handling equipments Db Total intensity of noise emitted by vehicles that arrive to the port Db Amount of heat released MJ Thermal pollution Volume of overheated effluents discharged into the aquatic environment m³ Space occupied by container terminal in the ports km² Visual pollution Total area occupied by transportation system (internal and access) km² Water consumption in operation l Water consumption Volume of water reused l Quantity disposed from spare parts t Material consumption t Consumption/discharge of steel, plastic, wood and paper in operation Note: (1) Used to container handling service since there is not production of goods. (2) In Brazil, electric energy is considered a renewable source because it comes from hydroelectric power stations.
Regarding DEA applications, Cook & Seiford (2009), presented a “sketch of some of the major research thrusts in data envelopment analysis (DEA) over the three decades since the appearance of the seminal work of Charnes et al. (1978)”. Liu et al. (2013), highlights the use of data envelopment analysis for efficiency analysis and shows a strong upward trend in DEA applications presented in scientific publications.
Vanessa de Almeida Guimarães et al. / Procedia - Social and Behavioral Sciences 160 (2014) 178 – 187
Zhou, Ang and Poh (2008) present a survey of several studies using DEA to analyze issues related to energy efficiency (Abbott, 2006; Boyd and Pang, 2000; Chauhan et al, 2006; Onut and Soner, 2006) and environmental impacts, especially emission of air pollutants (Boyd and McClelland, 1999; Callens and Tyteca, 1999; Bevilacqua and Braglia, 2002; Boyd et al, 2002; Arcelus and Arocena, 2005; Barla and Perelman, 2005). Some studies listed by the authors still use this technique to evaluate both (OudeLansink and Bezlepkin, 2003; OudeLansink and Silva, 2003; Ramanathan, 2005). Lozano et al (2008) and Kuosmanen and Kortelainen (2007) also apply to DEA in papers whose purpose is to perform an assessment considering environmental aspects. Luptacik and Korhonen (2004), Hua, Bian and Liang (2005) and Kuosmanen and Kortelainen (2005), in their turn, deal specifically with the use of ecoefficiency measures for analysis using DEA. Zhang et al. (2008), for instance, make an analysis of Chinese industry using data envelopment analysis, based on eco-efficiency measures, adopting as inputs the indicator “use of energy and water”, “solid waste” and “emission of air pollutants”. Frota Neto et al (2007), use this technique to assess the eco-efficiency of a reverse logistics network in Germany, having three objectives: minimizing costs, minimizing the cumulative energy demand and waste minimization. On the other hand, Leal Jr, Garcia and D’Agosto (2012) use DEA to select the most appropriate transportation mode considering eco-efficiency measures. This demonstrates that it is possible to use the DEA to performance assessment based on this concept. 3. Methodological Procedures This work was based on literature and documental searches which allowed us to know and understand a selection of methods for performance assessment, their structure and variables used to measure eco-efficiency. Furthermore, it allowed the selection of an aggregation of data technique suitable to this study: DEA analysis. The selection of variables (attributes, indicators and measures) was based in Guimarães and Leal Jr (2013). The authors conducted a field survey (technical visits and interviews) in order to know the operating profile of Brazilian container terminal and to identify the most significant variables for eco-efficiency assessment of port operations. To prioritize them, questionnaires (based on table 1) were applied to experts in port activities, which were tabulated and statistically analyzed. Thus, we chose to work with the indicators presented in the paper of these authors, whose values are presented in detail in section 4. 3.1 Data envelopment analysis – DEA Data envelopment analysis (DEA) is a support decision making tool based on linear programming, which was developed by Charnes, Cooper and Rhodes in the 70s (Garcia, 2001; Leal Jr, Garcia and D'Agosto, 2012). This is a non-parametric approach based on mathematical programming, which allows us to measure and compare the relative efficiencies of homogeneous entities that are called decision-making units - DMUs (Decision Making Unit) (Charnes, Cooper and Rhodes, 1978; Silva Neves, 2000; Garcia, 2001; Angulo Meza et al, 2005;. Mariano, Rebellato and Almeida, 2006). DEA allows comparing some DMUs that perform similar tasks, but differ by the amount of inputs used and outputs produced (Angulo Meza et al., 2005). DMUs should have the same use of inputs and outputs and each of these may be in different units of measure. This means that there is no need to convert them into a standard unit of measurement (Angulo Meza and Lins, 1999; Li and Reeves, 1998 apud Garcia, 2001). According to the traditional approach, Casa Nova (2002 apud Mariano, Rebellato and Almeida, 2006) defines a curve of efficiency (or maximum productivity) that considers the optimal relation between inputs and outputs from the DMUs under analysis. This curve is defined as an efficiency frontier (Cooper, Seiford and Tone, 2007). Thus, DMUs considered efficient will be on the curve as long as the inefficient ones will be located below it. Moreover, the frontier provides the parameters needed to assess what an inefficient DMU should do to become efficient. As advantage of this technique, Garcia (2001) cites the fact that it considers the possibility of outliers being potential benchmarks to be studied by other DMUs (and not only deviations from the average behavior). Furthermore, to optimize each individual observation with the aim of determining a linear frontier of parts comprising a set of Pareto-Efficient DMUs (DMU not dominated by any other), is considered a gain over traditional
181
182
Vanessa de Almeida Guimarães et al. / Procedia - Social and Behavioral Sciences 160 (2014) 178 – 187
parametric approaches. But the main advantage of DEA is not to require any relationship, a priori, between the inputs and outputs of the study (Zhou, Ang and Poh, 2008). There are two classical DEA models commonly used: the model of constant returns to scale (CRS or CCR) developed by Charnes, Cooper and Rhodes (1978) and the model of variable returns to scale (VRS or BCC), developed by Bankers, Charnes and Cooper (1984). The CCR model assumes that the inputs and outputs are directly related and proportionate manner. While in BCC model this relationship does not occur in proportional and direct manner (Cooper, Seiford and Tone, 2007). Thus, the basic difference between them is that: in BCC model, the changes in inputs do not generate proportional changes in outputs. So, due to the considerable differences in the handling scale of the terminals analyzed, we adopted BCC model for this study. Besides, we applied the input standpoint, where outputs are fixed and the focus is in minimizing the inputs (Cooper, Seiford and Tone, 2007; Leal Junior, D’Agosto and Garcia, 2013). Containers handling were considered fixed, aiming at environmental impacts minimization. This approach was chosen so as to we can establish a ranking of terminals based on eco-efficiency measures from the environmental point of view. Technical efficiency (TE) is given by the relationship shown in equation 2, which is closely related to ecoefficiency equation (equation 1). Therefore, by applying DEA, the efficiency frontier will be considered an ecoefficiency frontier, in this study. 劇継 噺
頚憲建喧憲建 荊券喧憲建
(2)
According to Leal Jr, Garcia and D'Agosto (2012), Rhodes (1978) extended this concept considering a linear combination of multiple factors (to input and to output) in order to produce virtual measures of input and output as shown in equation 3. デ鎚珍 憲珍 検珍 (3) 追 デ沈退怠 懸沈 捲沈 Where: yj is the value of output j; uj is the weight associated to the output j; xi is the value of the input i and vi is the weight associated with input i. 劇継 噺
The method of resolution indicates which weights will be associated to each attribute. The composition of weights aims to maximize the eco-efficiency of a particular DMU, hence they are the decision variables. Equation 4 shows the BCC model oriented outputs. 追
警件券"継血待 噺 布 懸沈 捲沈待 髪 高待
Subject to:
沈退怠
鎚
追
布 憲珍 検珍待 噺 な 珍退怠
(4)
鎚
伐 布 懸沈 捲沈賃 髪 布 憲珍 検珍賃 伐 高待 判 ど 褐倦 沈退怠
珍退怠
懸沈 憲珍 半 ど 褐件 倹""̇º¸""高待 "̨ø̋̋"ƺ"œÆ̌º
Where 四 and 士 represent the multipliers and 耳宋 is the scale variable.
The variable u ensures that the restrictions of DMUs, the ones operating in a different scale from the DMU under consideration, do not limit your objective function. Using this variable, it became possible to evaluate the returns to scale in which the DMU is operating. If 高待 is greater than zero, it means that the company operates in decreasing returns to scale; if 高待 is less than zero, it means that are increasing returns to scale and if 高待 is equal to zero, there is constant returns to scale (Mariano and Rebellato Almeida, 2006).
183
Vanessa de Almeida Guimarães et al. / Procedia - Social and Behavioral Sciences 160 (2014) 178 – 187
According to Leal Jr, Garcia and D'Agosto (2012) and Cooper, Seiford and Tone (2007), the purpose of Equation 4 constraints is to provide a normalized answer, which means that the results of optimization are shown in [0, 1] interval. The closer to "1", the most eco-efficient DMU will be considered. Among the analyzed DMUs, the one which has an eco-efficiency equal to "1", will be understand in the eco-efficiency frontier. The dual model of output-oriented (equation 5) can be obtained from equation 4.
Subject to:
津
警欠捲"月待
捲珍待"貸 布 捲沈賃 砿賃 半 ど 褐件 賃退怠
津
(5)
伐月待 検珍待 髪 布 検珍賃 砿賃 半 ど 褐倹 賃退怠
津
布 砿賃 噺 な
賃退怠
砿賃 半 綱 褐倦
In the last constraint of equation 5, the unknowns were considered greater than or equal to 綱 (largest than zero), where 綱 is a value of a small magnitude, but nonzero. This is a non-Archimedean value and its purpose is to prevent the occurrence of weights equal to zero. It was done because if it is given a weight equal to zero to an input which the terminal is considered bad, it may change its position in the ranking. Besides, it could be on the frontier even if it does not reach the best combination of outputs / inputs. 4. Using DEA and Results Based on documentary and bibliographic research, we selected the container terminals that would be part of this research. Indicators were selected based on Guimarães and Leal Jr (2013), which were chosen from questionnaires survey and literature research (Estes and Kuespert, 1976; Pereira, 1983; Santana Filho, 1984 and 1992; WBCSD 2000 and 2006; Ballou, 2001; Chopra and Meindl, 2003; Fleury and Wanke, 2003; U.S. DOT FHWA, 2005; Martins et al, 2005; Bowersox and Closs, 2007; Leal Jr, 2010; Leal Jr. et al, 2012). Table 2: Indicator value (time frame – 2010) DMU
Output Service produced O1
Input Energy consumption
Material consumption
GHG emission
I4
I5
I1
I2
Containers
Total Energy
Nonrenewable energy
Total emissions Sewage Office suplies (CO2 emission consumption +CH4+N2O)
[CTN]
[MJx103]
[MJx103]
[l x103]
[t]
1,032,000
164,328
93,115
47,250
729,546 276,874 146,880 180,529 180,344
106,461 89,388 48,532 41,604 44,206
51,528 71,478 32,604 25,999 33,013
16,896 16,291 11,340 10,187 10,602
225,255
54,381
33,622
211,387
37,047
21,666
Terminal
Tecon Santos Libra Santos Tecondi Rodrimar Libra Rio Multirio Sepetiba Tecon Vila Velha
Soil and water pollution I3
Atmospheric pollution
Water consumption
I6
I7
Total emissions (PM+NOx+ SO2+CO+HC+MNHC)
Water consumped by workers
[t]
[t]
[l x 103]
80.70
18,158
193.99
100,237
28.86 27.82 19.37 17.40 18.11
10,421 14,377 6,135 4,688 35,348
109.75 181.74 77.12 54.24 353.76
35,844 34,561 24,057 21,611 22,493
9,431
16.11
6,393
77.42
20,007
7,257
12.40
4,102
53.21
15,396
184
Vanessa de Almeida Guimarães et al. / Procedia - Social and Behavioral Sciences 160 (2014) 178 – 187
Tecon Rio 656,358 87,496 56,107 15,233 26.02 10,185 130.28 32,316 Grande 631,859 55,974 35,200 6,804 11.62 6,592 74.73 14,434 TCP 184,213 44,393 33,238 6,048 10.33 6,626 82.41 12,830 Teconvi 42,085 23,493 13,308 1,587 2.71 2,662 35.98 3,367 TESC 251,417 49,234 28,746 8,883 15.17 5,357 58.34 18,844 Suape Tecon 232,530 34,545 23,848 7,560 12.91 4,326 47.87 16,038 Salvador 28,775 13,847 13,191 2,646 4.52 2,406 33.01 5,613 Convicon Notes: (i) Consumption of water and emission of sewer were calculated considering: 151.2 l/inhab.day (Sins, 2011) and 70 l/person.day (ABNT, 1993), respectively. (ii) IEAVAERJ (2011) methodology was applied to estimate the amount of pollutants and GHG emitted by road vehicles and LLC (2012) methodology to estimate the emissions of handling equipment. (iii) Total energy consumption was divided into renewable and nonrenewable. Consumption of electrical equipment and 4.7% of equipments and diesel vehicles consumption were considered renewable. Brazilian diesel has mixed 5% of biodiesel in its volume and biodiesel has a calorific value lower than diesel in energy terms: 4.7% of energy in one litter. Source: Guimarães and Leal Junior (2013)
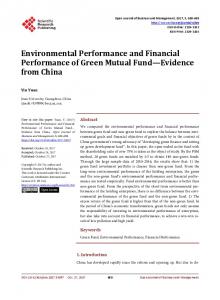
Table 2 shows the indicator values, calculated as presented in Guimarães and Leal Jr (2013). In order to make the analysis easier, the inputs were numbered up from I1 to I7 analyzed and the output "number of containers handled" was labeled as O1. In order to establish the ranking, a BCC DEA model was applied (equation 5), from the output standpoint. “Containers handling” was considered as output and the environmental influences shown in table 2 was used as input. Figure 1 presents the results, using a 綱 = 0.05 in equation 5, the non-Archimedean value.
Ranking de ecoeficiência 100 90 80 70 60 50 40 30 20 10 0
100 100 100 100 98.7 98.3 90.9
82.9
80.1
71.7 60.4 58.6
56.4 53.6 34.9
Figure 1: Ecoefficiency ranking of terminals As shown in Figure 1, TCP, Tecon Santos, TESC and Convicon terminals can be considered the benchmarks since they are in eco-efficiency frontier (relative level of eco-efficiency = 100%). It is noteworthy that the two formers have the largest container handling volumes among the terminals studied while the two latter ones have the smallest handling volumes. However, all of them compose the frontier, since the BCC model takes into account the return to scale. Libra Santos, Tecon Salvador, Vila Velha (all of them with relative eco-efficiency above 90%), Suape (with 82.9%) and Libra Rio (with 80.1%) can be considered near to the frontier. Tecon Rio Grande and Sepetiba Tecon, Teconvi, Multirio and Rodrimar have a median eco-efficiency ranging between 80% and 50%. Just Tecondi presented a lower level of eco-efficiency (less than 40%) and, therefore, is far from the frontier. The terminals can be classified in three categories according to their return to scale: (1) constant - the output increases (or decreases) in the same proportion that increases (or decreased) the input, (2) increasing - the output increases at a greater rate than the increase rate of the input and (3) decreasing - the output increases at a lower rate than the increase rate of the input. Table 3 shows terminals behavior according to returns to scale.
Vanessa de Almeida Guimarães et al. / Procedia - Social and Behavioral Sciences 160 (2014) 178 – 187
DEA BCC model allows measuring how much a terminal had better to improve in each indicator, in order to became a benchmark (to be on the frontier). Table 3 also shows the percentage of improvement required to each indicator, in each terminal. Table 3: Percentage of improvement required in order to get the frontier Percentage of indicators improvement (%) I2 I3 I4 I5 I6 I7 TESC Constant Benchmark Convicon Constant Benchmark TCP Constant Benchmark Tecon Santos Constant Benchmark Libra Santos Increasing 0 -22.6 -4.2 -1.3 -1.3 -9.6 -5.4 -1.3 Tecon Salvador Decreasing 0 -18.7 -13.5 -46.4 -46.4 -11.7 -1.6 -46.4 Vila Velha Decreasing 0 -19.5 -9 -52.1 -52.1 -9 -12.8 -52.1 Suape Decreasing 0 -40.3 -25.8 -52.9 -52.9 -26.2 -17 -52.9 Libra Rio Decreasing 0 -41.2 -28 -63.8 -63.8 -26.2 -19.8 -63.8 Tecon Rio Grande Increasing 0 -28.4 -30.9 -39.1 -39.1 -28.3 -37 -39.1 SepetibaTecon Decreasing 0 -47.7 -39.5 -58.8 -58.8 -40.8 -39.5 -58.8 Teconvi Decreasing 0 -41.4 -43.4 -41.4 -41.4 -47 -46.5 -41.4 Multirio Decreasing 0 -43.3 -43.4 -66 -66 -90.2 -87.7 -66 Rodrimar Decreasing 0 -53.1 -46.4 -70.3 -70.3 -47.2 -46.4 -70.3 Tecondi Decreasing 0 -65.1 -68.9 -73.3 -73.3 -71.3 -72.4 -73.3 Note: (1) Negative values represent a decrease. (2) Outputs were considered “zero” because from the output standpoint, only inputs vary. Terminal
Scale
O1
I1
Looking at Table 3, it is noticed that the further from the frontier, the highest the percentage of improvement required in the combination of the indicators is, emphasizing that terminal must make the proposed improvements in all inputs so that it can reach the frontier. I1, I2 and I6 indicators are those that require a lower percentage of improvement in, at least, three terminals. In the other hand, I3, I4 and I7 indicators are those that require the highest percentage of improvement in, at least, seven terminals. I5 indicator, in its turns, requires the lower improvements to Vila Velha and Tecon Rio Grande but the largest to Teconvi and Multirio. Libra Santos requires the highest improvements to I1 (22.6%) and the lowest to I3 and I4 (1.3%). Tecon Salvador needs just 1.6% of improvement in I6 but 46.6% in I3 and I7. Vila Velha and Suape require the biggest investments to reduce I3, I4 and I7 (approximately 52% in all of them) as Libra Rio, Tecon Rio Grande, Sepetiba Tecon, Rodrimar and Tecondi (63.8%, 39.1%, 58.8%, 70.3% and 73.3% respectively). Teconvi, in its turns, needs an average percentage of investments in all indicators (ranging from 41 to 47%) while Multirio improvements vary from 43.3%, in I1 and I2, to 90.2% in I5. In order to achieve the improvement percentages indicated in Table 3, these terminals managers can adopted some strategies, such as: (1) using of cleaner fuel sources - electricity, biofuels, introduction of B20; (2) improvements of equipment efficiency; (3) implementation of a preventive maintenance plan for vehicles and equipment; (4) reuse of water; (5) training of employees in order to reduce material, water and energy consumption and so on. Table 4 presents actions whose implementation would impact directly on improving indicators I 1, I2, I5 and I6. Indicators I1, I2, I5, I6 are related which means that making an improvement in one of them can generate an improvement in the others.
185
186
Vanessa de Almeida Guimarães et al. / Procedia - Social and Behavioral Sciences 160 (2014) 178 – 187
Table 4: Improvement strategies in port terminals Strategy Recommended Near to Medium Term Emission Reducing Technologies and Practices Productivity and efficiency improvement Operating Practices and Policies
Specific to each terminal, but generally efforts should streamline handling processes and scheduling, improve automation, reduce waiting-times and idling and reduce congestion in supply chain. Implementation of vessel service speed reductions for ocean-going vessels approaching and departing marine ports. Reduce engine idling. Improve energy management and efficiency for large powered equipment like rubber tired gantry Fuel Strategies Low sulphur diesel fuel and/or ultra-low sulphur diesel fuel. B20 biodiesel blend. In conjunction with diesel particulate devices, fuel borne catalysts as an aid to filter regeneration. Alternative Energy and Shore power for marine vessels Hybrid Technology Hybrid diesel electric engine systems for rubber tired gantry cranes, switch locomotives and other Strategies vehicles. Retrofit Strategies (for Diesel oxidation catalysts (requires diesel fuel containing less than 500 ppm sulphur). engine exhaust and Flow through filters (requires diesel fuel containing sulphur