Dec 2, 2013 - such as the online social network Twitter and the world-wide web, .... both directed binomial4 and power-law networks, whose in-degree and ...
arXiv:1303.0783v2 [physics.soc-ph] 2 Dec 2013
Epidemic threshold in directed networks Cong Li, Huijuan Wang and Piet Van Mieghem Faculty of Electrical Engineering, Mathematics and Computer Science, Delft University of Technology, Delft, The Netherlands Abstract Epidemics have so far been mostly studied in undirected networks. However, many real-world networks, such as the online social network Twitter and the world-wide web, on which information, emotion or malware spreads, are directed networks, composed of both unidirectional links and bidirectional links. We define the directionality ξ as the percentage of unidirectional links. The epidemic threshold τc for the susceptibleinfected-susceptible (SIS) epidemic is lower bounded by 1/λ1 in directed networks, where λ1 , also called the spectral radius, is the largest eigenvalue of the adjacency matrix. In this work, we propose two algorithms to generate directed networks with a given directionality ξ. The effect of ξ on the spectral radius λ1 , principal eigenvector x1 , spectral gap (λ1 − |λ2 |) and algebraic connectivity µN−1 is studied. Important findings are that the spectral radius λ1 decreases with the directionality ξ, whereas the spectral gap and the algebraic connectivity increase with the directionality ξ. The extent of the decrease of the spectral radius depends on both the degree distribution and the degree-degree correlation ρD . Hence, in directed networks, the epidemic threshold is larger and a random walk converges to its steady-state faster than that in undirected networks with the same degree distribution.
1
Introduction
Much effort has been devoted to understand epidemics on networks, mainly because of the increasing threats from cybercrime and the expected outbreak of new fatal viruses in populations. Epidemics have been studied on undirected networks for a long time and many authors (see [1, 2, 3, 4, 5, 6, 7]) addressed the existence of an epidemic threshold τc in the susceptible-infected-susceptible (SIS) epidemic process [8]. We consider the SIS epidemic process in an undirected network G(N, L), characterized by a symmetric adjacency matrix A consisting of elements aij that are either one or zero depending on whether node i is connected to j or not. Each node i has two possible states at time t: either Xi (t) = 0, meaning that the node is healthy and susceptible, or Xi (t) = 1, for an infected node. Initially, a certain percentage of nodes are randomly selected as infected. The infection from an infected node to each of its healthy neighbors and the curing of an infected node are assumed to be independent Poisson processes with rates β and δ, respectively. Every node i at time t is either infected, with probability vi (t) = Prob[Xi (t) = 1] or healthy (but susceptible) with probability 1 − vi (t). This is the general continuous-time description of the simplest type of a SIS epidemic process on a network. The epidemic threshold τc separates two different phases of the epidemic process on a network: if the effective infection rate τ , β/δ is above the threshold, the infection spreads and becomes persistent; if τ < τc , the infection dies out (1) exponentially fast. The epidemic threshold τc = λ11 of the N-intertwined Mean-field Approximation (NIMFA) [7, 9, 10, 11] of the SIS model lower bounds the real threshold, where λ1 is the largest eigenvalue of the adjacency matrix A, also called the spectral radius. Topologies of undirected networks have been mostly modeled by Erd˝ os and R´enyi1 [12, 13, 14] as binomial 1 An Erd˝ os-R´ enyi random graph can be generated from a set of N nodes by randomly assigning a link with probability p to each pair of nodes.
1
Table 1: Percentage of unidirectional links in real-world networks Real-world networks N Larcs Enron 69 , 244 276 , 143 Ljournal-2008 5 , 363, 260 79 , 023 , 142 Twitter-2010 41, 652, 230 1 , 468 , 365, 182 WordAssociation-2011 10 , 617 72, 172 cnr-2000 325, 557 3, 216, 152 in-2004 1, 382, 908 16, 917, 053 eu-2005 862, 664 1, 935, 140 uk-2007-05@100000 100, 000 3, 050, 615 uk-2007-05@1000000 1, 000, 000 41, 247, 159
ξ 84.29% 25.32% 64.29% 76.77% 70.33% 60.68% 67.80% 82.23% 79.71%
networks, by B´arabasi and Albert2 [15] as power-law networks, or by Watts and Strogatz3 [16] as small-world networks. More complicated static and dynamic models, such as the configuration model [17, 18, 19], are also proposed to approximate real-world networks. However, many real-world networks are directed networks, some examples are shown in Table 1. The dataset of the real-world networks is obtained from [20, 21] and the description of these networks is attached in the Appendix A. Two kinds of links, namely bidirectional links and unidirectional links, exist in directed networks. If node i is connected to node j (denoted by i → j) then j is also linked to i (denoted by j → i), one bidirectional link exists between nodes i and j; and if either i → j or j → i exists, but not both in between the node pair i and j, a unidirectional link exists. Here, we define the directionality as ξ = Lunidirectional /Larcs, where the number P P of arcs (the number of 1-elemets in the adjacency matrix) Larcs = i j aij = uT Au, (u is the all-one vector), can also be calculated by Larcs = Lunidirectional + 2Lbidirectional . A directed network with directionality ξ is denoted by G(ξ) . The network G(ξ=0) is a bidirectional network or an undirected network, whose adjacency matrix is symmetric, when ξ = 0. The network G(ξ=1) is a directed network without any bidirectional link, when ξ = 1. A high directionality is observed in Twitter, as shown in Table 1. A link runs from user A to user B if user A follows user B in Twitter, where user A is called the ”follower” of user B. The fact that user A ”follows” user B, does not necessarily mean that the reverse is also true. For example, a famous person could have millions of followers but he/she may not follow many others. This explains the high directionality ξ of Twitter. The virtual-community social networks, such as LiveJournal, have a low directionality (see Table 1), mainly because they aim to construct virtual connections in between real-life friends, and friendship relations are usually mutual. There has been an increasing interest in the study of directed networks. Topological properties of directed networks, such as the short loops, closure connectivity, degree, domination and communities on realistic directed networks have already been studied in [22, 23, 24, 25, 26, 27]. Garlaschelli and Loffredo [28] investigated the reciprocity [29] in directed networks, where the reciprocity is equal to 1 − ξ. Processes taking place on networks, such as synchronization, percolation and epidemic spread, have also been researched [28, 30, 31, 32, 33] in real directed networks. Percolation theory for directed networks with ξ = 1 was firstly developed by Newman et al. [19, 34]. Then, Bogu˜ na´ and Serrano [35] pointed out that even a small fraction of bidirectional links suffices to percolate the network. Moreover, Meyers et al. [36] used a generating function method to predict the epidemic threshold in directed networks with ξ < 1 and the size of the infected cluster. Recently, Van Mieghem and van (1) de Bovenkamp have proven that the NIMFA epidemic threshold τc = λ11 of the SIS epidemic process also holds 2 A B´ arabasi-Albert graph starts with m nodes. At every time step, we add a new node with m links that connect the new node to m different nodes already present in the graph. The probability that a new node will be connected to node i in step t is proportional to the degree di (t) of that node. This is referred to as preferential attachment. 3 A Watts-Strogatz small-world graph can be generated from a ring lattice with N nodes and k edges per node, by rewiring each link at random with probability p.
2
for directed networks [10]. Stimulated by the directed social networks with different directionalities, here, we (1) focus on the influence of the directionality ξ on the epidemic threshold τc = λ11 and other spectral properties. This paper is organized as follows. In Section 2, we propose two algorithms that could be applied to a bidirectional network to generate a directed network with an arbitrary given directionality ξ, by rewiring or resetting links. The in- and out- degree distribution of the generated directed network is the same as the degree distribution of the original bidirectional network. Chen and Olvera-Cravioto [37] proposed an algorithm to generate a directed network with a given in- and out-degree distribution, which is similar to the configuration model. However, their algorithm in [37] cannot generate a directed network with a given directionality ξ. In Section 3, we investigate the effect of the directionality ξ on the spectral radius λ1 , the principal eigenvector x1 (the eigenvector corresponding to λ1 ), the spectral gap λ1 − |λ2 | and the algebraic connectivity µN −1 in both directed binomial4 and power-law networks, whose in-degree and out-degree both follow a binomial (or power-law) distribution. Interestingly, we find that the spectral radius λ1 of networks G(ξ=0) is larger than that of directed networks G(ξ=1) when the degree distribution and the assortativity of these networks are the same. This means that the epidemic threshold τc in undirected networks is smaller than that in directed networks with the same degree distribution and assortativity. Furthermore, we explore the influence of the Pearson degree (1) correlation coefficient ρD (also called the assortativity) on the epidemic threshold τc in both directed binomial and directed power-law networks with different ξ, in Sec. 4. The ρD is the Pearson correlation coefficient of degrees [38] at either ends of a link and lies in the range [−1, 1]. Actually, there are four degree correlations, namely the in-degree and in-degree correlation, the in-degree and out-degree correlation, the out-degree and in-degree correlation and the out-degree and out-degree correlation, in directed networks. We consider directed networks where the in-degree and out-degree of each node are the same. In this case, the four degree correlations are equal to each other and can be all referred as the degree correlation (or the assortativity). The decrease of the spectral radius λ1 with ξ is large when the assortativity ρD is large in directed binomial networks, whereas the opposite is observed in directed power-law networks.
2
Algorithm Description
The networks mentioned in this paper are simple, without self-loops and multiple links from any node to any other node. Here, we propose two algorithms, In-degree and Out-degree Preserving Rewiring Algorithm (IOPRA) and Link resetting algorithm (LRA), which both can be applied to any network to generate a directed network with a given directionality ξ. In this study, we only apply these two algorithms to generate directed networks with the same in- and out- degree distribution. The difference is that IOPRA preserves the in- and out- degree of each node, while, LRA may change the in- and out-degree of any node. IOPRA is inspired by the degree preserving rewiring, which has been presented in [39, 40]. We firstly introduce the degree-preserving rewiring, which monotonously increases or decreases the assortativity ρD , while maintaining the node degrees unchanged, in undirected networks. Afterwards, we describe IOPRA and LRA in detail.
2.1
Degree-preserving rewiring
The degree-preserving rewiring [39] can either increase or decrease the assortativity of a bidirectional network: (a) the degree-preserving assortative rewiring: randomly select two links associated with four nodes and then rewire the two links such that the two nodes with the highest degree and the two lowest-degree nodes are connected, respectively. If any of the newly rewired links exists before rewiring, discard this step and a new pair of links is randomly selected; (b) the degree-preserving disassortative rewiring: randomly select two links associated with four nodes and then rewire the two links such that the highest-degree node and the lowest-degree 4 For
example, an Erd˝ os-R´ enyi random network is a binomial network with the Pearson degree correlation ρD = 0. A general binomial network could possibly have an assortativity ρD within a large range.
3
node are connected, and the remaining two nodes are also connected, as long as the newly rewired links do not exist before rewiring. Either rewiring step (a) or (b) can be repeated to monotonically increase or decrease the assortativity in a bidirectional network.
2.2
In-degree and out-degree preserving rewiring algorithm (IOPRA)
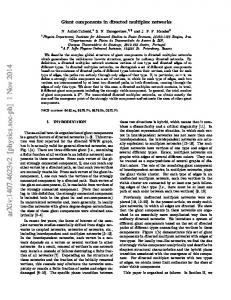
IOPRA can be applied to change the directionality of networks. We define our In-degree and Out-degree Preserving Rewiring Algorithm (IOPRA) as follows: randomly choose two unidirectional links with four end nodes, and rewire the two unidirectional links. In IOPRA, the head of one unidirectional link only can rewire with the head of the other unidirectional link, in order to maintain both the in-degree and out-degree of the four nodes unchanged (see Figure 1). We don’t rewire if such rewiring can introduce duplicated links from any node to any other. We discard the rewiring step if this rewiring step doesn’t change the directionality ξ towards the given directionality. In both cases, we randomly reelect a pair of unidirectional links associated four nodes. We illustrate the process of IOPRA changing the directionality in Algorithm 1 (see Appendix C). IOPRA actually changes the directionality ξ of a given network G without changing the in- and out-degree of each node. If the original network G is an undirected network, the in-degree sequence is exactly the same as the out-degree sequence in the directed network G(ξ) generated by IOPRA.
(a)
(b)
Figure 1: (Color online) In-degree and out-degree preserving rewiring IOPRA changes the directionality, as well as randomizing the connections of the original network, without changing the degree of any node. Hence, if the initial network is a random network, e.g. an Erd˝ os-R´enyi (ER) network or a scale-free network generated by the configuration model, where the connections are originally laid at random, IOPRA changes only the directionality ξ. However, if we apply IOPRA to a nonrandom network, e.g. a lattice, the resulting network has not only a different directionality but also a more randomized structure.
2.3
Link resetting algorithm (LRA)
We start with a bidirectional network G, and use the Link Resetting Algorithm (LRA) to change the directionality (see Algorithm 2 in Appendix C). We randomly choose a fraction ξ of the bidirectional link pairs from G. Then, we randomly choose only one unidirectional link from each bidirectional link, and randomly relocate the selected unidirectional links to a place without any link. In this work, we only apply LRA to ER networks. In this case, the in- and out-degree of the generated directed network follow the same binomial degree distribution as the original network. However, the in-degree and out-degree of any node in the generated network may differ from those in the original network G. When LRA is applied to other types of networks, such as the power-law networks, the original in- and out-degree distributions are destroyed, and tend to be binomial. In summary, two types of directed binomial networks can be generated: one is generated by IOPRA (called the IOPRA directed binomial networks), whose nodes have the same in-degree and out-degree; the other, created by LRA (called the LRA directed binomial networks), has the same in- and out- degree distribution, while allowing the in- and out- degree of any node to be different.
4
18.0
14.78
17.6
λ1
λ1
14.76 17.2
14.74 14.72 0.0
16.8
binomial directed network (N = 1000, p = 2lnN/N) 0.2
0.4
ξ
0.6
16.4
0.8
0.0
1.0
power-law directed network (N = 1000, m = 4) 0.2
0.4
0.6
0.8
1.0
0.6
0.8
1.0
(b)
(a)
16x10
ξ
-3
-78 -80
12
ρD
ρD
-82 8
-84 -86
4 0 0.0
binomial directed network (N = 1000, p = 2lnN/N)
-88 -90x10
0.2
0.4
ξ
0.6
0.8
1.0
-3
0.0
power-law directed network (N = 1000, m = 4) 0.2
(c)
0.4
ξ
(d)
Figure 2: Plot of the spectral radius versus the directionality in (a) and (b), as well as the assortativity versus the directionality in (c) and (d), in both directed binomial and power-law networks generated by IOPRA.
3 3.1
Spectral properties in directed networks Spectral radius of directed networks
The adjacency matrix of a directed network is an asymmetric matrix, whose spectral radius λ1 is still real by the Perron-Frobenius Theorem (see [41]). We generate directed networks, with the directionality ξ ranging from 0 to 1, by applying IOPRA to the ER (N = 1000, p = 2lnN/N ) and the BA (N = 1000, m = 4) networks gradually. An ER network is connected, if p > pc ≈ lnN/N for large N , where pc is the disconnectivity threshold. In this work, we choose p ≥ 2pc to be sure that the original networks are connected. The influence of the directionality ξ on the spectral radius λ1 and the assortativity ρD is studied in both directed power-law networks and directed binomial networks (see Figure 2). Apart from some wobbles, the spectral radius λ1 decreases almost linearly with the directionality ξ. The same phenomenon can also be observed in large, sparse directed networks (see Appendix D). Moreover, the assortativity ρD of the network fluctuates slightly around 0. We also have observed a similar phenomenon in large sparse networks. We observe that the tiny leaps of spectral radius λ1 happen when the assortativity ρD has a rise, which is understandable, because it has been shown in [39] that the spectral radius λ1 increases with the increase of the assortativity ρD . Figure 3 exemplifies that the spectral radius λ1 may increase instead of decreasing when the directionality increases due to the assortativity ρD . We will study the effect of the assortativity ρD on the decrease of the spectral radius λ1 with the directionality ξ in Section 4. With LRA, we generate directed binomial networks with directionality ξ from 0 to 1 with step 0.1. The assortativity ρD of all the directed binomial networks generated by LRA is around 0. Hence, the effect of the assortativity ρD can be ignored here. The spectral radius λ1 is calculated in directed networks with different directionality ξ. We performed all the simulations for 103 network realizations. The spectral radius λ1 is plotted as a function of the directionality ξ for directed binomial networks with p = 2lnN/N and p = 0.05 in Figure 5
10
10
1
9
2
1
8
3
2
7
8
3
6
4
9
7 6
4
5
5
λ1 = 2.7422 λ1 = 2.7567 Figure 3: (Color online) Example: the spectral radius increases with the directionality ξ, because of the increase of the assorativity (where ρD (Glef t ) = −0.6190, ξ(Glef t ) = 0.8333, and ρD (Gright ) = −0.5714, ξ(Gright ) = 0.9167). 51.0 14.8
E[λ1(G2lnN/N(N))]
14.6
50.8 50.6
14.4 50.4
14.2 50.2
14.0
E[λ1(G0.05(N))]
directed binomial networks (N = 1000, T = 1000) p = 2lnN/N p = 0.05 fitting curve λ1 = 14.85−1.07ξ fitting curve λ1 = 50.91−1.02ξ
50.0 13.8 0.0
0.2
0.4
0.6
ξ
0.8
49.8 1.0
Figure 4: (Color online) Average spectral radius as a function of the directionality for directed binomial networks generated by LRA with size N = 1000. Two values for the link density p are shown: p = 2lnN/N (red circles) and p = 0.05 (orange diamonds). 4. From the observation, the spectral radius λ1 is inversely proportional to the directionality ξ with the factor ≃ −1, which is independent from the link density p of the networks. This observation can be explained by the following proposition. Proposition 1 Let G(ξ=0) = Gp (N ) be a connected Erd˝ os-R´enyi (ER) random graph with a finite N , and (ξ) let G be a directed binomial network generated by LRA whose in- and out-degree follow the same binomial distribution as Gp (N ). The average spectral radius satisfies E[λ1 (G(ξ) )] ≃ E[λ1 (Gp (N ))] − ξ
(1)
Arguments: A directed binomial network G(ξ) generated by LRA with link density p, can be equivalently constructed by randomly adding 2pξ(N 2 ) unidirectional links to a bidirectional ER network Gp(1−ξ) (N ) with size N and link density p(1 − ξ). The average spectral radius [41, pp. 173, art. 137] of Gp(1−ξ) (N ) is 1 E[λ1 (Gp(1−ξ) (N ))] = (N − 2)p(1 − ξ) + 1 + O( √ ). N The principal eigenvector of an adjacency matrix A is denoted by x1 obeying the normalization xT1 x1 = 1. Let C denote the adjacency matrix of the resulting network after adding one unidirectional link to network G. The largest eigenvalue is increased due to the addition of the link (i → j) [41, pp. 236, Lemma 7] as λ1 (C) ≃ λ1 (A) + (x1 )i (x1 )j , 6
where the increase is strict if the adjacency matrix A is irreducible. Hence, the average increase of the spectral radius by adding m unidirectional links in random networks is obtained as E[λ1 (C) − λ1 (A)] ≃ mE[(x1 )i (x1 )j ]. The sum of the product of components in the principal eigenvector of Erd˝ os-R´enyi networks is approximated by a function of link density p (see Figure 5). The fitting function can be expressed as, N X N X 1 E (x1 )i (x1 )j = N − + O(1), p j=1 i=1 when the network is connected. Since xT1 x1 = 1 and since the expectation E[.] is a linear operator, we obtain E [(x1 )i (x1 )j ] =
N−
1 p
−1
N (N − 1)
+ O(
1 ), N2
(2)
when i 6= j. Directed binomial networks generated by LRA from ER with N and p, have the same E [(x1 )i (x1 )j ]. Hence, the average spectral radius of the directed network obtained by adding m = 2pξ(N 2 ) unidirectional links to the network Gp(1−ξ) (N ) can be approximated by E[λ1 (G(ξ) )] ≃ E[λ1 (Gp(1−ξ) (N ))] + 2 (N (N − 1)/2) pξE [(x1 )i (x1 )j ] . Using (2), 1 E[λ1 (G(ξ) )] ≃ (N − 2)p + 1 − ξ + O( √ ), N
ΣiΣj(x1)i(x1)j
which leads to (1). � Juh´asz [42] also pointed out that the largest eigenvalue λ1 (G(ξ=1) ) of a directed random network with link density p and size N is almost surely N p, when N is large. In ER random networks, the spectral radius E[λ1 (G(ξ=0) )] → N p + 1, when N is large (see [41, pp. 173, art. 137]). Both earlier results are consistent with Proposition 1, and support that the proportionality factor between the spectral radius λ1 and the directionality ξ is around −1.
975
950 ER networks (N = 1000, p = 2ln(N)/N : ln(N)/N : 20ln(N)/N ) The sum of product of components in principal eigenvector fitting curve: ysum = 1000-(1/p)±0.45
925 0.00
0.02
0.04
0.06
0.08
0.10
0.12
0.14
p Figure 5: (Color online) Sum of the product of components in the principal eigenvector as a function of the link density p in ER networks (N = 1000). Proposition 1 also reveals the effect of the size N on the relative largest decrease of the spectral radius (ξ=0) (ξ=1) ) 1 (G . We predict that Λ → 0 if N → ∞ for directed binomial networks, because the Λ = λ1 (G λ1 (G)−λ (ξ=0) )
decrease of the spectral radius (λ1 (G(ξ=0) ) − λ1 (G(ξ=1) )) is almost a constant value, whereas the spectral radius λ1 (G(ξ=0) ) of dense directed binomial networks increases with the size of the networks. This implies that the effect of the directionality ξ on the spectral radius is small in large dense binomial networks. 7
3.2
Principal eigenvector in directed networks
The principal eigenvector x1 was first proposed as a centrality metric by Bonacich [43] in 1987, to indicate the influence of each node. For example, the decrease of the spectral radius [44, 45] by removing nodes, can be characterized by the corresponding principal eigenvector components. In this section, we explore the principal eigenvector in directed networks. The principal eigenvector of the directed networks, with the directionality ξ from 0 to 1 with step 0.1, are calculated. Then, the components of the principal eigenvector are sorted in an ascending order. For each ξ, we simulate 103 network realizations and compute the average sorted principal eigenvector components. Figure 6 illustrates that the components of the principal eigenvector are more uniform in directed binomial networks: the principal eigenvector x1 → √uN as ξ → 1; moreover, the variance of components of the principal eigenvector linearly decreases with the directionality ξ in both directed binomial networks and the directed power-law networks (see Figure 7). The observation implies that when the directionality is larger, the influence of each node on the spectral radius is more similar. This experimental evidence suggests that increasing the directionality enables all nodes to contribute more similarly to the robustness against epidemic in directed networks. The decrease of the variance V ar[x1 ] in directed binomial networks by LRA is larger than that in directed binomial networks by IOPRA (see Figure 7(a)). The connections in LRA directed binomial networks are more random than that in IOPRA directed binomial networks, in the sense that LRA allows each node to have a different in- and out- degree, although the in- and out- degree distribution are the same in both LRA and IOPRA binomial networks. As a consequence, the principal eigenvector x1 is more uniform with a smaller V ar[x1 ] in LRA directed binomial networks than that in IOPRA directed binomial networks when the directionality is the same. Thus, nodes in LRA directed binomial networks have more equal contributions to the spectral radius than nodes in IOPRA directed binomial networks with the same directionality. Li et al. [46] have shown that both a large variance of the degree and a large assortativity ρD contribute to a large variance V ar[x1 ] of the components of the principal eigenvector x1 . Here, we point out further that a large directionality ξ leads to a small variance V ar[x1 ] of the components of x1 . 48x10
-3
44
(x1)n
40
binomial directed networks (N = 1000, p = 0.05) ξ = 0 : 0.1 : 1 (dark to pink) ξ=0
36 32
ξ=1
ξ=1
28 24
ξ=0
20 0
200
400
n
600
800
1000
Figure 6: (Color online) Change of the components of principal eigenvector from bidirectional networks to directed networks.
3.3
Spectral gap of directed networks
The difference (λ1 − λ2 ) between the largest eigenvalue λ1 and the second largest eigenvalue λ2 is called the spectral gap. All eigenvalues of the symmetric adjacency matrix of an undirected network are real. Here we focus on the directed networks, whose adjacency matrix is asymmetric. The eigenvalues of directed networks can be complex numbers (as exemplified in Figure 13 in Appendix B). In directed networks, the spectral gap is defined as λ1 − |λ2 |, where |λ2 | is the modulus of λ2 . The spectral gap λ1 − |λ2 | increases with the directionality ξ in both the directed binomial networks and the directed power-law networks (see Figure 8). As introduced in 8
Sec. 3.1, the spectral radius decreases with the directionality. Our observation implies that the second largest eigenvalue |λ2 | decreases with the directionality faster than the spectral radius. The larger the spectral gap is, the faster a random walk converges to its steady-state [41, pp. 64]. Thus, the dynamic process in a directed network reaches the steady-state faster than that in an undirected network with the same degree distribution. Figure 8 (a) implies that a dynamic process is slightly faster to reach the steady-state in IOPRA directed binomial networks than in LRA directed binomial networks. The existence of large spectral gap together with a uniform degree distribution results in higher structural sturdiness and robustness against node and link failures [47]. Hence, directed networks with high directionality ξ and a uniform degree distribution are more robust than undirected networks with large variance of degree.
3.4
Algebraic connectivity of directed networks
The Laplacian matrix [48] is defined as Q = 12 BB T , where the incidence matrix B is an N × L matrix with elements [41] 1 if link el = i → j bil = −1 if link el = j → i 0 otherwise.
¯ where ∆ = 1 (∆in + ∆out ), ∆in and ∆out are The Laplacian matrix can be equivalently expressed as Q = ∆− A, 2 diagonal matrices which contain the in-degree and out-degree of each node respectively, and A¯ = 12 (A + AT ). If the network is an undirected network, A¯ is the adjacency matrix A and ∆ = diag(d1 , d2 , · · · , dN ) is the degree matrix. The second smallest eigenvalue µN −1 of the Laplacian Q was named algebraic connectivity by Fiedler [49]. The Laplacian Q is always symmetric as defined. Hence, the algebraic connectivity of a directed and connected network is a positive real number. The algebraic connectivity, together with the spectral gap, quantifies the robustness and the network’s well-connectedness. The larger the algebraic connectivity is, the more difficult it is to cut the network into disconnected parts. Here, we study the influence of the directionality ξ on the algebraic connectivity µN −1 of directed networks. As illustrated in Figure 9, the algebraic connectivity increases with the directionality ξ in both the directed binomial networks and the directed power-law networks. This suggests that the directed networks with high directionality are more difficult to break into parts and synchronize faster. As the directionality increases, the number of none-zero elements of A¯ increases and the variance of the elements of A¯ decreases. This could be one possible reason why the network is better connected. Moreover, the algebraic connectivity µN −1 is greater in the LRA directed binomial networks than in the IOPRA binomial networks (see Figure 9(a)).
20x10
-6
-6
560x10
19.6x10
-6
16
540
19.2 19.0 18.8 0.0
12
0.2
0.4
ξ
0.6
0.8
Var[x1]
Var[x1]
Var[x1]
19.4
1.0
8 directed binomial networks
0.2
0.4
ξ
500 480
(N = 1000, p = 0.05) 4 0.0
520
0.6
0.8
460 0.0
1.0
(a)
directed power-law networks (N = 1000, m = 4) 0.2
0.4
ξ
0.6
0.8
1.0
(b)
Figure 7: (Color online) Plot of the variance of the principal eigenvector versus the directionality (a) in directed binomial networks (generated by LRA in yellow squares and by IOPRA in red triangles) and (b) in directed power-law networks by IOPRA (103 network realizations).
9
λ1 − |λ2|
43.0 42.0
11.0
directed binomial networks (N = 1000, p = 0.05) by IOPRA by LRA fitting curve λ1−|λ2| = 37.11 + 7.01ξ fitting curve λ1−|λ2| = 37.11 + 5.85ξ
10.0
λ1 − |λ2|
44.0
41.0 40.0
directed power-law networks (N = 1000, m = 4) fitting curve λ1−|λ2| = 6.06+5.39ξ
9.0 8.0
39.0
7.0
38.0 37.0 0.0
0.1
0.2
0.3
0.4
0.5
ξ
0.6
0.7
0.8
0.9
6.0 0.0
1.0
0.2
(a)
0.4
ξ
0.6
0.8
1.0
(b)
Figure 8: (Color online) Plot of the spectral gap as a function of the directionality (A) in directed binomial networks (generated by LRA in yellow square and by IOPRA in red triangle) and (B) in directed power-law networks (103 network realizations). 34.0
µN-1
32.0 31.0
2.50
directed binomial networks N = 1000, p = 0.05 by IOPRA by LRA fitting curve µN-1 = 27.47 + 0.86ξ fitting curve µN-1 = 27.47 + 6.38ξ
2.40
µN-1
33.0
30.0
directed power-law networks N = 1000, m = 4 fitting curve µN-1 = 2.02 + 0.49ξ
2.30 2.20
29.0
2.10
28.0 27.0 0.0
0.1
0.2
0.3
0.4
0.5
ξ
0.6
0.7
0.8
0.9
2.00 0.0
1.0
(a)
0.2
0.4
ξ
0.6
0.8
1.0
(b)
Figure 9: (Color online) Plot of the algebraic connectivity as a function of the directionality (A) in directed binomial networks (generated by LRA in yellow square and by IOPRA in red triangle) and (B) in directed power-law networks (103 network realizations). The algebraic connectivity µN −1 approaches the spectral gap λ1 − λ2 , as the network tends to be regular bidirectional networks [41, pp. 71], which suggests the spectral gap is related to the algebraic connectivity. Figures 8 and 9 show that both, the spectral gap and the algebraic connectivity, increase with the directionality ξ in directed networks, which is consistent with the relation between the algebraic connectivity and the spectral gap.
4
Effects of the assortativity on the spectral radius of directed networks
In the directed networks generated by applying IOPRA to ER or BA networks, the in- and in- degree correlation, the in- and out- degree correlation, the out- and in- degree correlation and the out- and out- degree correlation are the same. Thus, the four correlations are all referred as the degree correlation (or the assortativity). In Section 3, we have discussed how the spectral properties change with the directionality in directed networks, where the assortativity is always close to zero. Here, we study how the spectral radius λ1 changes with the directionality ξ when the assortativity ρD is the same, and how the change of the spectral radius λ1 with ξ is influenced by the assortativity in directed networks. Two approaches are applied to investigate this problem.
10
• Approach 1: First, we perform degree-preserving rewiring on ER networks (or BA networks) to obtain a set of bidirectional networks with assortativity ρD from −0.8 to 0.8 (or −0.3 to 0.3) with step 0.1. Second, we alter the directionality ξ of all bidirectional networks with each assortativity using IOPRA. The directionality ξ is changed from 0 to 1 with step 0.1. IOPRA randomizes network connections, and thus pushes the assortativity of the resulting directed network towards zero, if the original network has a non-zero assortativity. Figure 10 plots the simulation results of one binomial network realization and 102 binomial network realizations. The simulation of one realization is almost the same as the result of a large number of network realizations, which points to almost sure behavior [50]. The results in the directed power-law networks are shown in Figure 11. • Approach 2: First, we generate ER networks (or BA networks) G(ξ=0) whose directionality ξ = 0. Second, we apply IOPRA to ER (or BA) networks G(ξ=0) to generate directed binomial networks (or directed power-law networks) G(ξ=1) with directionality ξ = 1. Then, we change the assortativity of ER networks (or BA networks) G(ξ=0) and directed binomial networks (or directed power-law networks) G(ξ=1) by degree preserving rewiring and in- and out- degree preserving rewiring, respectively, without changing the directionality. Note that the in- and out- degree preserving rewiring can be applied not only to change the directionality, but also to change the assortativity. Figure 12 plots the spectral radius of the networks G(ξ=0) and G(ξ=1) as a function of the assortativity. The two approaches both change the assortativity and the directionality of the networks, while, the order of change is different: Approach 1 changes the assortativity firstly and then the directionality; Approach 2 is the opposite. Figures 10, 11 and 12, show that the spectral radius λ1 always decreases with the directionality ξ when the networks have the same degree distribution and the same assortativity ρD . Moreover, the degree distribution of the network also influences the change range of the spectral radius λ1 with ξ. The decrement of the spectral radius λ1 with ξ increases with the assortativity in directed binomial networks (see Figures 10 and 12 (a)). On the contrary, the decrement of the spectral radius λ1 with ξ goes down with the assortativity in directed power-law networks (see Figures 11 and 12 (b)). Furthermore, the decrease of the spectral radius in directed power-law networks is larger than that in directed binomial networks, when the assortativity is zero. Many real-world networks are directed power-law networks, where λ1 could possibly be tuned within a large range by controlling the directionality in real-world networks. Summarizing, the spectral radius λ1 decreases with the directionality ξ when the assortativity remains constant. In order to protect the network from virus spreading via increasing the epidemic threshold, while maintaining the degree distribution and the assortativity, increasing the directionality of networks is recommended. Meanwhile, the spectral gap and the algebraic connectivity are also increased, which means that the topological robustness is also enhanced in return.
binomial directed networks (N = 1000, p = 2lnN/N)
17.0
λ1
17.0
λ1
16.0
16.0
15.0
-0.8
binomial directed networks (N = 1000, p = 2lnN/N)
15.0
-0.4
0.0
ρD
0.4
0.8
-0.8
-0.4
0.0
ρD
0.4
0.8
(b) 102 network realizaitons
(a) one network realization
Figure 10: (Color online) Spectral radius as a function of the assortativity in directed binomial networks with ξ from 0 to 1 with step 0.1 is scatter plotted in different colorful (or grayscale) lines, from the gray (upper) line to the pink (lower) line. 11
28
power-law directed networks (N = 1000, m = 4)
λ1
24 20 16 12 -0.30
-0.20
-0.10
0.00
0.10
ρD
0.20
0.30
Figure 11: (Color online) Spectral radius as a function of the assortativity in directed power-law networks with ξ from 0 to 1 with step 0.1, is scatter plotted in different colorful (or grayscale) lines, from the gray (upper) line to the pink (lower) line. 32 binomial networks N = 1000, p = 2ln(N)/N
15.5
(ξ = 0)
λ1(G
28
(ξ = 1)
)
λ1(G
)
power-law networks N = 1000, m = 4 (ξ = 0)
λ1(G
)
λ1(G
(ξ = 1)
)
λ1
λ1
24 20
15.0
16 14.5 -0.6
-0.4
-0.2
0.0
ρD
0.2
0.4
12 -0.30
0.6
(a)
-0.20
-0.10
0.00
ρD
0.10
0.20
0.30
(b)
Figure 12: (Color online) Spectral radius as a function of the assoratativity (a) in directed binomial networks (N = 1000, p = 2lnN/N ) and (b) in directed power-law networks (N = 1000, m = 4) for 103 network realizations.
5
Conclusions
In this work, two algorithms to generate directed networks with a given directionality ξ are proposed. This allows us to study the influence of the directionality ξ on the spectral properties of networks. The spectral (1) radius λ1 , which is the inverse of the SIS NIMFA epidemic threshold τc , is studied in directed networks. A universal observation is that, the spectral radius decreases with the directionality when the degree distribution and the assortativity of the network is preserved. We may, thus, increase the epidemic threshold to suppress the virus spread via increasing the directionality of the network. The possible range to increase the epidemic threshold is relatively large in directed binomial networks with a high assortativity and directed power-law networks with a low assortativity. The variance of the components of the principal eigenvector decreases with the directionality, which indicates that the influence of each node on the spectral radius is similar in networks with a high directionality. Moreover, the spectral gap and the algebraic connectivity increase with the directionality, implying that an increase of the directionality enhances the connectivity of the network. Furthermore, we observe that the spectral gap increases faster with the directionality in IOPRA than in LRA directed binomial networks, on the contrary, the algebraic connectivity increases with the directionality faster in LRA than in IOPRA directed binomial networks. This observation may be due to the fact that the in- and out- degree of each node could be different in LRA directed binomial networks, while, are exactly the same in IOPRA directed binomial networks. The influence of the difference between in- and out- degree of nodes on spectral properties for directed power-law networks remains an open question. Acknowledgements 12
This work has been partially supported by the European Commission within the framework of the CONGAS project FP7-ICT-2011-8-317672 and the China Scholarship Council (CSC).
References [1] N. T. J. Bailey, The Mathematical Theory of Infectious Diseases and its Applications, 2nd edition, Charlin Griffin & Company, London,1975. [2] A. Barrat, M. Bartelemy, and A. Vespignani, Dynamical Processes on Complex Networks, Cambridge University Press, Cambridge, U.K., 2008. [3] C. Castellano and R. Pastor-Satorras, Threshold for Epidemic Spreading in Networks, Physical Review Letters 105, 218701, 2010. [4] D. J. Daley, J. Gani and J. J. M. Gani, Epidemic modelling: an introduction, volume 15, Cambridge University Press, 2001. [5] J. O. Kephart and S. R. White, Directed-graph epidemiological models of computer viruses, Proceedings of the 1991 IEEE Computer Society Symposium on Research in Security and Privacy, IEEE Computer Society, Los Alamitos, CA, pages 343-359, 1991. [6] R. Pastor-Satorras and A. Vespignani, Epidemic dynamics and endemic states in complex networks, Physical Review E 63, 066117, 2001. [7] P. Van Mieghem, J. S. Omic and R. E. Kooij, Virus Spread in Networks, IEEE/ACM Transaction on Networking 17(1): 1-14, February, 2009. [8] R. M. Anderson and R. M. May, Infectious diseases of humans: dynamics and control, Oxford Univ. Press, Oxford, U.K.,1991. [9] P. Van Mieghem, Epidemic Phase Transition of the SIS-type in Networks, Europhysics Letters (EPL) 97: 48004, February, 2012. [10] P. Van Mieghem and R. van de Bovenkamp, Non-Markovian infection spread dramatically alters the SIS epidemic threshold in networks, Physical Review Letters 110: 108701, 2013. [11] Y. Wang, D. Chakrabarti, C. Wang and C. Faloutsos, Epidemic spreading in real networks: An eigenvalue viewpoint, In Reliable Distributed Systems, Proceedings, 22nd International Symposium on (pp. 25-34), IEEE Computer Society Press, Los Alamitos, CA, 2003. [12] P. Erd˝ os and A. R´enyi, On Random Graphs, I., Publ. Math (Debrecen) 6: 290-297, 1959. [13] E. N. Gilbert, Random Graphs, Annals of Mathematical Statistics 30 (4): 1141–1144, 1959. [14] P. Erd˝ os and A. R´enyi, On the evolution of random graphs, Publications of the Mathematical Institute of the Hungarian Academy of Sciences 5: 17–61, 1960. [15] A. -L. Barab´ asiand R. Albert, Emergency of Scaling in Random Networks, Science 286: 509-512, 1999. [16] D. J. Watts and S. H. Strogatz, Collective dynamics of “small-world” networks, Nature 393: 440-442, 1998. [17] B. Bollob´ as, A probabilistic proof of an asymptotic formula for the number of labelled regular graphs, European Journal of Combinatorics 1(4): 311-316, 1980.
13
[18] M. Molloy and B.Reed, A critical point for random graphs with a given degree sequence, Random structures & algorithms, 6(2-3):161-180, 1995. [19] M. E. J. Newman, S. H. Strogatz, and D. J. Watts, Random graphs with arbitrary degree distributions and their applications, Physical Review E 64, 026118, 2001. [20] P. Boldi and S. Vigna, The WebGraph Framework I: Compression Techniques, Proc. of the Thirteenth International World Wide Web Conference (WWW 2004), pp. 595-601, Manhattan, USA, ACM Press, 2004. [21] P. Boldi, M. Rosa, M. Santini and S. Vigna, Layered Label Propagation: A MultiResolution CoordinateFree Ordering for Compressing Social Networks, Proceedings of the 20th international conference on World Wide Web, ACM Press, 2011. [22] G. Bianconi, N. Gulbahce and A. E. Motter, Local Structure of Directed Networks, Physical Review Letters 100, 118701, 2008. [23] G. Robins, P. Pattison and P. Wang, Closure, connectivity and degree distributions: Exponential random graph (p*) models for directed social networks, Social Networks 31: 105–117, 2009. [24] Y. Kim, S. Son and H. Jeong, Finding communities in directed networks, Physical Review E 81, 016103, 2010. [25] R. van den Brink and R. P. Gilles, Measuring domination in directed networks, Social Networks 22: 141-157, 2000. [26] R. Albert and A.-L. Barab´ asi, Statistical mechanics of complex networks, Rev. Mod. Phys. 74 (1): 47, 2002. [27] M. E. J. Newman, The structure and function of complex networks, SIAM Rev. 45(2), 167-256, 2003. [28] D. Garlaschelli and M. I. Loffredo, Patterns of Link Reciprocity in Directed Networks, Physical Review Letters 93, 268701, 2004. [29] M. E. J. Newman, Networks: An Introduction, Oxford University Press, Oxford, U.K., March 2010. [30] S. M. Park and B. J. Kim, Dynamic behaviors in directed networks, Physical Review E 74, 026114, 2006. [31] N. Schwartz, R. Cohen, D. ben-Avraham, A. -L. Barab´ asi, and S. Havlin, Percolation in directed scale-free networks, Physical Review E 66, 015104, 2002. [32] S. N. Dorogovtsev and J. F. F. Mendes, Evolution of networks, Adv. Phys. 51(4), 1079-1187, 2002. [33] M. E. J. Newman, S. Forrest, and J. Balthrop, Email networks and the spread of computer viruses, Physical Review E 66, 035101, 2002. [34] D. S. Callaway, M. E. J. Newman, S. H. Strogatz, and D. J. Watts, Network Robustness and Fragility: Percolation on Random Graphs, Physical Review Letters 85: 5468, 2000. ´ Serrano, Generalized percolation in random directed networks, Physical Review E [35] M. Bogu˜ na´ and M. A. 72, 016106, 2005. [36] L. A. Meyersa, M. E. J. Newman and B. Pourbohloul, Predicting epidemics on directed contact networks, Journal of Theoretical Biology 240: 400–418, 2006. [37] N. Chen and M. Olvera-Cravioto, Directed Random Graphs with Given Degree Distributions, Stochastic Systems 3(1): 147, 2013. 14
[38] M. E. J. Newman, Assortative mixing in networks, Phys. Rev. Lett. 89, 208701, 2002. [39] P. Van Mieghem, H. Wang, X. Ge, S. Tang and F.A. Kuipers, Influence of assortativity and degreepreserving rewiring on the spectra of networks, The European Physical journal B 76(4): 643-652, 2010. [40] S. Maslov and K. Sneppen, Specificity and stability in topology of protein networks, Science 296(5569): 910-913, 2002. [41] P. Van Mieghem, Graph Spectra for Complex Networks, Cambridge University Press, Cambridge, U.K., 2011. [42] F. Juh´asz, On the characteristic values of non-symmetric block random matrices, Journal of Theoretical Probability 3: 199-205, 1990. [43] P. F. Bonacich, Power and centrality: A family of measures, Am. J. Sociol. 92, 1170-1182, 1987. [44] P. Van Mieghem, D. Stevanovic, F. A. Kuipers, C. Li, R. van de Bovenkamp, D. Liu and H. Wang, Decreasing the spectral radius of a graph by link removals, Physical Review E 84(1): 016101, 2011. [45] C. Li, H. Wang and P. Van Mieghem, Bounds for the spectral radius of a graph when nodes are removed, Linear Algebra and its Applications 437: 319-323, 2012. [46] C. Li, H. Wang and P. Van Mieghem, Degree and Principal Eigenvectors in Complex Networks, Networking 2012, Part I, LNCS 7289: 149-160, Springer Berlin Heidelberg, 2012. [47] M. T. Thai and P. M. Pardalos (Eds.), Handbook of optimization in complex networks: theory and applications, Vol. 57, Springer, 2011. [48] R. B. Bapat, J. W. Grossman and D. M. Kulkarni, Generalized matrix tree theorem for mixed graphs, Linear and Multilinear Algebra 46(4):299-312, 1999. [49] M. Fiedler, Algebraic connectivity of graphs, Czechoslovak Mathematical Journal 23 (98): 298-305, 1973. [50] P. Van Mieghem, G. Hooghiemstra and R. W. van der Hofstad, Stochastic Model for the Number of Traversed Routers in Internet, Proceedings of Passive and Active Measurement (PAM), RIPE NCC, Amsterdam, The Netherlands, 2001.
15
Appendix A. Introduction of real-world networks 1. Enron: This data set was made public by the Federal Energy Regulatory Commission during its investigations: it is a partially anonymised corpus of e-mail messages exchanged by some Enron employees (mostly part of the senior management). This data set is a directed graph, whose nodes represent people and with an arc from x to y whenever y was the recipient of (at least) a message sent by x.
2. Ljournal-2008: LiveJournal is a virtual-community social site started in 1999: nodes are users and there is an arc from x to y if x registered y among his friends. It is not necessary to ask y permission, so the graph is directed. This graph is the snapshot used by Chierichetti, Flavio, et al. in ”On compressing social networks.” Proceedings of the 15th ACM SIGKDD international conference on Knowledge discovery and data mining. ACM, 2009, and was kindly provided by the authors.
3. Twitter-2010 Twitter is a website, owned and operated by Twitter Inc., which offers a social networking and microblogging service, enabling its users to send and read messages called tweets. Tweets are text-based posts of up to 140 characters displayed on the user’s profile page. This is a crawl presented by Kwak, Haewoon, et al. in ”What is Twitter, a social network or a news media?”, Proceedings of the 19th international conference on World wide web. ACM, 2010. Nodes are users and there is an arc from x to y if y is a follower of x. In other words, arcs follow the direction of tweet transmission.
4. Word Association-2011 The Free Word Association Norms Network is a directed graph describing the results of an experiment of free word association performed by more than 6000 participants in the United States: its nodes correspond to words and arcs represent a cue-target pair (the arc x->y means that the word y was output by some of the participants based on the stimulus x).
5. WWW networks The networks, ”cnr-2000”, ”in-2004”, ”eu-2005”, ”uk-2007-05@100000” and ”uk-2007-05@1000000” are small WWW networks that were crawled from the Internet. The ”cnr-2000” is crawled from the Italian CNR domain. A small crawl of the .in domain performed for the Nagaoka University of Technology is in data ”in-2004”. The ”eu-2005” is a small crawl of the .eu domain. This network ”uk-2007-05@100000” and ”uk-2007-05@1000000” have been artificially generated by combining twelve monthly snapshot of the .uk domain and collected for the DELIS project.
B. Eigenvalues of the directed networks The spectral radius λ1 and the spectral gap (λ1 − λ2 ) are considered as important metrics for the percolation processes on networks. Here we also present all eigenvalues in directed networks in a Image-Real figure. The eigenvalues are calculated on 103 simulation realizations. The changes of the eigenvalues λi with the directionality ξ from 0 to 1 with step 0.1 in directed binomial networks (N = 10, p = 0.25) are shown on Figure 13. Surprisingly, the real part of all eigenvalues tends to 0, when the directionality ξ increases.
C. Algorithms (see Algorithm 1 and Algorithm 2) D. Spectral radius of large sparse networks (see Figure 14)
16
0.6 binomial directed graphs (N = 10, p = 0.25); ξ = 0 : 0.1 : 1 λ1 λ2 λ3 λ4 λ5 (Right to Left) λ6 λ7 λ8 λ9 λ10 (Left to Right)
0.5 0.4 0.3
Image
0.2 0.1 0.0
-0.1 -0.2 -0.3 -0.4 -0.5
-3.0
-2.0
-1.0
0.0
1.0
2.0
3.0
Real
Figure 13: Change of the eigenvalues with the directionality. When the directionality increases, the real parts of the eigenvalues tend to 0.
Algorithm 1 IOP RA(G, ξ) 1: Create a bidirectional network G(N, L); 2: Save network G(N, L) as Gs and calculate the directionality ξs of network Gs ; 3: while |ξs − ξ| > 10−5 do 4: Randomly select two unidirectional links i → j and k → l associated with the f our nodes i, j, k, l; 5: Rewire the link pair i → j and k → l into i → l and k → j. T he new network Gn is obtained; 6: calculate the directionality ξn of the network Gn ; 7: if |ξs − ξ| > |ξn − ξ| then 8: Gs ← Gn ; 9: ξs ← ξn ; 10: else 11: give up this rewired node pair; 12: end if 13: end while 14: return Gs
Algorithm 2 LRA(G, ξ) 1: Create a bidirectional network G(N, L); 2: Randomly choose ξ percentage of bidirectional link pairs; 3: Randomly choose one unidirectional link f rom each link pair; 4: Randomly reset the chosen unidirectional links to the locations without any link; 5: Save the new network as Gs ; 6: return Gs
17
Figure 14: (Color online) Spectral radius as a function of the directionality in large, sparse directed binomial networks.
18
560x10
-6
Var[x1]
540 520 500 480 460 0.0
power-law directed networks (N = 1000, m = 4) 0.2
0.4
ξ
0.6
0.8