Episodic visual recognition memory and aging: A case of preserved function Robert Sekuler, Michael J. Kahana and Arthur Wingfield Volen National Center for Complex Systems Brandeis University
Visual episodic recognition memory was assessed in young (mean age 22.5 years) and older (mean age 74.1 years) participants. To isolate purely visual memory, recognition was tested with sets of briefly-presented compound sinusoidal gratings, which minimized age-related differences in visual processing, and resisted verbal encoding. Recognition was measured after delays of 1, 2 or 4 seconds. Overall, neither accuracy of recognition nor speed of response differed significantly between groups or with probe delay, which strengthens recent claims that visual memory tends to be spared during the course of normal aging.
Studies with rehearsable verbal stimuli such as letters, words or sentences suggest that normal adult aging is associated with diminished short-term memory (e.g., Kausler, 1994; Wingfield & Kahana, 2002; Wingfield & StineMorrow, 2000). However, recent research raises questions about whether this association extends to memory for other kinds of test materials. For example, using a match-tosample procedure, McIntosh et al. (1999) found that younger and older observers had virtually identical short-term memory for a single, briefly-presented, vertical sinusoidal grating. Functional neuroimaging studies of older and younger participants’ brains led McIntosh et al. to speculate that a compensatory reorganization of neural circuits helped to preserve visual memory in their older participants. Subsequently, with a slightly modified test procedure, Bennett, Sekuler, McIntosh, and Della-Maggiore (2001) confirmed the absence of age-related differences in short-term memory for sinusoidal gratings. Such stimuli can be valuable probes of memory because their representations in early vision are known, and because they resist naming or other symbolic encoding, which promotes reliance on a form of short-term memory that is purely visual (Phillips & Christie, 1977; Phillips, 1974; Kahana & Sekuler, 2002). Given the importance of this finding one should ask whether the simplicity of the task used by McIntosh et al. and by Bennett et al. may have masked age-related changes in short-term visual memory. For example, in those stud-
The authors acknowledge support from the Keck Foundation, and National Institutes of Health grants MH55687 and AG15852. Invaluable assistance was provided by Julie Golomb and Chris McLaughlin. We thank Allison B. Sekuler for excellent comments on an earlier version of this manuscript. Correspondence concerning this article may be addressed to any of the authors, Volen National Center for Complex Systems, MS 013, Brandeis University, Waltham, MA 02254-9110. e-mail may be sent to
[email protected],
[email protected] or
[email protected]
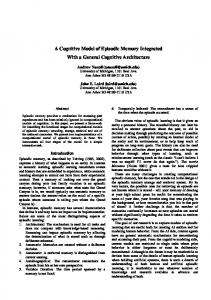
ies observers had to encode and remember only one stimulus per trial. The temporal durability of memory for a single stimulus is no guarantee that the memory would not be vulnerable to disruption by other, succeeding stimuli (Hole, 1996). Moreover, observers in the McIntosh et al. and Bennett et al. studies had to encode just a single attribute of each trial’s single stimulus, i.e., the stimulus’ vertical spatial frequency. We conjectured that age-related differences in visual memory might be better revealed by a more challenging task. So we adapted Sternberg’s visual recognition paradigm to study episodic recognition memory for two separate, twodimensional sinsuoidal gratings (Kahana & Sekuler, 2002; Zhou, Kahana, & Sekuler, 2003). Our stimuli and procedures were patterned after ones that Kahana and Sekuler used with young adults. We took two steps in order to increase task difficulty over that in McIntosh et al. (1999) and in Bennett et al. (2001). First, we presented not one, but two, briefly-presented Study stimuli per trial. These study items, which varied from trial to trial, were followed by a Probe (p), which the participant judged as having been or not been among the just-seen study stimuli. Also, this task forced participants to encode not just one, but two separate aspects of each stimulus. Each stimulus was generated by summing one vertically-oriented grating, and one horizontally-oriented grating. On each trial, the stimuli differed from one another either in vertical spatial frequency (with horizontal spatial frequency held constant), or vice versa. (Examples of both types of trials are shown in Figure 1.) The random variation in which orientation differentiated the stimuli forced participants to encode the spatial frequency information contained in both orientations. For young adults, at least, this requirement was not expected to have much impact; with young participants, Vincent and Regan (1995) showed that orthogonal orientations in a compound grating could be processed independently of one another. Whether the same would hold for older participants is an open question. With young participants, delaying the presentation of a p stimulus for several seconds (Magnussen, Greenlee, As-
2
ROBERT SEKULER, MICHAEL J. KAHANA AND ARTHUR WINGFIELD
plund, & Dyrnes, 1990; Kahana & Sekuler, 2002), or longer (Magnussen, Greenlee, Aslaksen, & Kildebo, 2003) has little or no effect on memory for spatial frequency. We were especially interested in the possibility that short-term visual memory’s temporal robustness might not hold with older participants. We therefore measured episodic visual recognition memory for groups of young and older participants, inserting a variable delay before presentation of the probe stimulus. We collected measures of accuracy of participants’ judgments as well as the associated response times (RTs) to correct responses. Collecting two dependent measures afforded converging perspectives on the underlying quality of episodic memory. Moreover, RT can be a more sensitive probe of memory performance than accuracy, especially when accuracy in some or all conditions is high (Kahana & Loftus, 1999). In fact, using stimuli similar to our own, Magnussen, Idas, and Myhre (1998) showed that response times revealed variations in young participants’ recognition memory, even though such variations eluded response accuracy.
Methods Participants Fifteen healthy young adults (aged 19-28 years, M = 22.5, SD = 3.0) and fifteen healthy older adults (aged 64-85 years, M = 74.1, SD = 5.5) participated in this study for monetary compensation. Of the young participants, 9 were male, 6 female; of older participants, six were male, nine female. All of the participants had post-high school education. Participants’ acuity and contrast sensitivity were measured. In addition, we used an adaptive psychophysical procedure to measure each participant’s spatial frequency discrimination threshold for a sinusoidal gratings. Acuity was measured, for distance, using Landolt C targets; contrast sensitivity was assessed with Pelli-Robson charts (Pelli, Robson, & Wilkins, 1988); frequency discrimination thresholds were measured using an up-down tracking procedure in which participants had to compare the spatial frequencies of two briefly presented gratings (750 msec duration each), which were separated by an inter-stimulus interval of 400 msec. We did not adjust the stimuli in order to compensate for individual differences in discrimination threshold, as Zhou et al. (2003) did in their study of young participants. However, memory test stimuli were confined to low spatial frequencies in order to minimize possible effects of in age-related differences in visual encoding (Owsley, Sekuler, & Siemsen, 1983).
Procedure On each trial, a participant saw two study stimuli, s1 and s2 , 750 msec in duration, and separated by an interval of 400 msec. Then, after a variable pre-probe delay (PPD), a warning tone sounded and p was presented for 750 ms. To compare the rate at which young and older participants lost information from memory, pre-probe delays of 1, 2, or 4 seconds were used. The mean luminance of the display was 22.4 cd/m2 .
S1
S2
PP
A
B
C
Figure 1. Sample stimuli for three trials. In each row, s1 and s2 are the study items, p is the probe. A: p matches s1 ; B: p matches neither of the study items; p’s frequency lies midway between that of s1 and s2 .
On each trial, one orientation, either horizontal or vertical, was randomly selected to be the irrelevant orientation. For the grating component with that irrelevant orientation, spatial frequency was held constant across all the stimuli on that trial. The spatial frequency of the dummy orientation was randomized, uniformly ranging from 0.25 to 4.35 cycles/degree. The spatial frequency of the trial’s other, critical orientation component, was allowed to vary from one stimulus to another. The spatial frequency of the critical component ranged from 0.25 to 6.3 cycles/degree. Within each trial, the critical frequency was randomized under several constraints: the critical components in s1 and s2 always differed by 45 percent (on half the trials, s 1 was higher in frequency than s2 ; on half the trials, the situation was reversed); the p’s critical component either matched that of either s1 or s2 (illustrated in Figure 1B), or differed from them by one of three different amounts. On one-third of non-match trials, the p’s critical frequency was 45% above the spatial frequency of the higher frequency study item; on the remaining nonmatch trials, the p’s critical frequency was 45% below that of the lower frequency study item. This case is illustrated in Figure 1A. On the remaining one-third of non-match trials, the p’s critical spatial frequency fell mid-way between the spatial frequencies of s1 and s2 . This placed p’s spatial frequency 22.5% away from each the frequency of each study item. This last case is illustrated in Figure 1C. A participant viewed the stimulus display from a distance of 114 cm, with head supported by a chin cup and forehead rest. All stimuli were made by summing horizontal and vertical sinusoidal gratings. All trials were self-paced. After each response, one of two tones sounded, providing immediate feedback about response correctness. No in-
3
EPISODIC VISUAL RECOGNITION MEMORY AND AGING:A CASE OF PRESERVED FUNCTION
structions were given about the speed with which participants should respond. Trialwise variation in stimulus spatial frequency forced participants to base their judgments on the most recently-seen study items; hence the requisite memory was episodic. Each participant was tested on 288 trials, which were distributed across two 20-minute sessions. Trials were equally and randomly distributed between ps that matched or did not match a study item. In addition, we randomized and equalized the frequency of the five p types, the three pre-probe delay times, and the critical orientation (horizontal or vertical).
2A shows, the pre-probe delay (PPD) did not significantly affect recognition accuracy, F(2,56) = 0.74, p > 0.4. However, the interaction between PPD and p frequency was significant, F(8,224) = 3.63, p < 0.01. This interaction came about because for a p midway between s1 and s2 , the proportion of correct recognitions was better after a delay of just one second than after longer delays, F(1,28)=363.739, p < 0.001. Table 2 gives the means for these conditions. Finally, it is important to note that neither the main effect of age, nor any interaction involving age was statistically significant.
Results
Prior to analysis, RTs associated with correct recognition judgments were log-transformed to decrease the skew of the RT distributions (Ratcliff, 1993). The mean for each participant and condition was found, and the antilogs of the means, expressed in msec, were used in all statistical analyses. The mean correct response time for young was 1089.51 msec (SeM = 78.65); the mean correct response for older participants was 1381.25 msec (SeM = 85.14), a statistically significant difference, F(1,28)=7.09, p = 0.013. RT also varied significantly with the probe’s spatial frequency relative to those of the study items, F(4,112)= 16.43 p < 0.001. In particular, RTs tended to be longest when the probe frequency lay between that of s1 and s2 , F(1,28) = 20.834, p < 0.001. Unlike the case for accuracy, RTs showed no evidence of a recency effect. As Figure 2B shows, PPD did not significantly affect RT, F(2,56) = 0.102, p > 0.50. Finally, no other main effect or interaction was statistically significant, including interactions with age.
Accuracy
1.00
1500 Young Older
0.90
0.80
0.70
0.60
0.50
Overall recognition accuracy did not significantly differ between the two groups of participants. The mean proportion of correct responses was 0.683 (SeM = .0138) for young participants, and 0.656 (SeM = 0.0143) for older participants, F(1, 28) = 3.124, 0.05 < p < 0.10. Response accuracy varied with the probe’s spatial frequency relative to those of the study items, F(4, 112) = 169.560, p < 0.001]. This effect of p’s spatial frequency has two noteworthy aspects. First, the effect of frequency did not differ significantly between groups, F(4, 112) = 1.768, p = 0.15. Second, accuracy was by far poorest when p’s frequency fell midway between that of s1 and s2 . Under this condition, p was most easily confused with non-matching study items, F(1, 28) = 363.739, p < 0.001. Recognition accuracy showed a recency effect: When p matched the second study item, s2 , recognition accuracy was significantly higher than when p matched the first study item, s1 , 0.79 vs. 0.70 (t=4.40, d f = 29, p < .01). As Figure
Young Older
Mean Response Time (in msec)
Table 1 summarizes the visual screening and discrimination results for each group. Note that on most measures, the two groups were remarkably similar. Most importantly, the difference between the two groups’ discrimination thresholds was not significant (t = 1.135, d f = 27, p > 0.30). The groups’ similarity on this visual function is critical: it means that perceptual differences between stimuli should be comparable for the two groups of participants (Zhou et al., 2003). This fact would help to clarify the origin of any observed age-related changes in visual memory; Gilmore, Allan, and Royer (1986) demonstrated that apparent differences in visual memory can sometimes be caused not so much by a change in memory per se, as by a change in some basic visual function. As expected from previous reports, the two groups differed significantly on both Pelli-Robson contrast sensitivity and on visual acuity (t = 3.636 and t = 5.255, respectively, both d f = 28, and p < .001). Because these measures emphasize high spatial frequency visual responses, and our stimuli were exclusively low frequency, these group differences should be inconsequential for recognition performance.
Proportion Correct
Screening
Response Time
1400
1300
1200
1100
1000 1
2
4
Pre-Probe Delay (sec)
1
2
4
Pre-Probe Delay (sec)
Figure 2. Percent correct (left panel) and reaction time (right panel) as a function of the pre-probe delay. Curves are shown for young and older participants.
Switch of Critical Orientation The orientation whose frequency differentiated one stimulus from another varied randomly from trial to trial: on some trials, the differentiating orientation was horizontal, on others it was vertical. This random variation meant that half of all pairs of successive trials shared the same differentiating orientation, but the remaining trial pairs did not. To determine if this change in differentiating orientation affected recognition, we compared each group’s performance on both types of trial pairs. Recognition accuracy was essentially the same for the two types of trial pairs, F(1, 28) = 0.599, p > 0.40. Moreover, the interaction of this variation with age was not
4
ROBERT SEKULER, MICHAEL J. KAHANA AND ARTHUR WINGFIELD
statistically significant, F(1, 28) = 1.884, p = 0.181. Mean percent correct for each combination of trial pair type and age were: Young, No-Switch = .6987 (SeM = 0.017) ; Young, Switch = .6703 (SeM = 0.016); Older, No-Switch = .6521 (SeM = 0.014); and Older, Switch = .6601 (SeM = 0.018). This is consistent with the idea that information along both orientations is processed in parallel (Zhou et al., 2003; Vincent & Regan, 1995).
Discussion As might be expected from the general slowing of responses with normal aging (Salthouse, 1991; Cerella, 1994; Birren & Fisher, 1995), older adults took significantly longer to make their recognition judgments. However, their ability to discriminate study items from non-study items was not reliably worse than that of young adults. Also, for either group of participants, delaying the presentation of p had little effect, either on overall recognition accuracy or on response time. As shown in Figure 2, the small non-significant trend towards worse accuracy performance of older adults, and the larger RT effect, were both unchanged by the pre-probe delay. Recognition’s robustness in the face of increasing, and unpredictable, pre-probe delay, is consistent with results others have reported, though for young participants only (Kahana & Sekuler, 2002). As mentioned before, participants had particular difficulty making correct recognition judgments when p’s spatial frequency was midway between the frequencies of s 1 and s2 . In this condition, p was between one and two discrimination thresholds away from each study item. Testing young participants with similar compound stimuli, Zhou et al. (2003) found that comparable visual similarity between p and study items led to only 20-30% correct recognition responses, as we found here. More specifically, the mean discrimination thresholds shown in Table 1 mean that a p midway between the study items was on average 1.63 discrimination threshold units away from either study item; for older participants, on average the p was also visually similar to the study items, just 1.42 threshold units away from either one. As a result, if the perceptual distances had any effect, correct recognition that p had not been among the study items should have been a bit more difficult for the older participants. Both RTs and accuracy data hinted at such an age-difference, but that difference was not statistically reliable. The lesson may be that to ensure that any group differences in visual memory are actually memory-based differences, one should scale the memory test materials to reflect individual differences in visual discriminability (Gilmore et al., 1986; Zhou et al., 2003). We confirmed and extended the main results reported by McIntosh et al. (1999) and Bennett et al. (2001). Assayed in heathy older adults tested under conditions that minimized possible effects from age-related changes in vision, visual memory does seem to resist the influence of aging. This result is consistent with the hypothesis, grounded in behavioral and neuroimaging studies McIntosh et al. (1999), Bennett et al. (2001), that compensatory reorganization in the aging brain can protect visual memory. Our findings suggest that
whatever compensatory mechanisms may be at work, those mechanisms are fairly robust, able to withstand the significant stimulus and task complexity imposed here. Obviously, we cannot rule out the possibility that there are limits to such compensation. For example it may be that aging impacts visual memory less than it does verbal memory because the visual stimuli are of lower dimensionality, or because studies with verbal stimuli do not control encoding differences that arise from sensory limitations, or perhaps because visual memory is less rehearsal-dependent, and older adults have less effective rehearsal strategies. Future studies using stimuli that vary along basic perceptual dimensions can serve to rule among these alternative hypotheses and to further enrich our understanding of the complex pattern of age-related change and invariance in episodic memory. Table 1 Summary of visual screening results Young Participants Age Mean=22.5 (SD=3.0) Contrast Sensitivity Mean=1.88 (SD=1.19) Visual Acuity Mean=20/20.7 (SD=7.3) Discrimination Threshold Mean=13.8 (SD=2.3) Older Participants Age Contrast Sensitivity Visual Acuity Discrimination Threshold
Mean=74.1(SD=5.5) Mean=1.66 (SD=1.20) Mean=20/30.3 (SD=7.1) Mean=15.9 (SD=5.6)
Table 2 Proportion correct for p midway between study items PPD Proportion (SeM) correct Young Participants 1 0.158 (.030) 2 0.183 (.025) 4 0.204 (.032) Older Partipants 1 0.142 (.033) 2 0.175 (.048) 4 0.208 (.043)
EPISODIC VISUAL RECOGNITION MEMORY AND AGING:A CASE OF PRESERVED FUNCTION
References Bennett, P. J., Sekuler, A. B., McIntosh, A. R., & Della-Maggiore, V. (2001). The effects of aging on visual memory: evidence for functional reorganization of cortical networks. Acta Psychologica, 107, 249-273. Birren, J. E., & Fisher, L. M. (1995). Aging and speed of behavior: Possible consequences for psychological functioning. Annual Review of Psychology, 46, 329-353. Cerella, J. (1994). Generalized slowing in brinley plots. Journals of Gerontology: Series B Psychological Sciences & Social Sciences, 49(2), P65-P71. Gilmore, G. C., Allan, T. M., & Royer, F. L. (1986). Iconic memory and aging. Journal of Gerontology, 41(2), 183-190. Hole, G. J. (1996). Decay and interference effects in visuospatial short-term memory. Perception, 25, 53-64. Kahana, M. J., & Loftus, G. (1999). Response time versus accuracy in human memory. In R. J. Sternberg (Ed.), The nature of cognition (p. 322-384). Cambridge, MA: MIT Press. Kahana, M. J., & Sekuler, R. (2002). Recognizing spatial patterns: A noisy exemplar approach. Vision Research, 42, 2177-2192. Kausler, D. H. (1994). Learning and memory in normal aging. San Diego: Academic Press. Magnussen, S., Greenlee, M. W., Aslaksen, P. M., & Kildebo, O. O. (2003). High-fidelity perceptual long-term memory revisited– and confirmed. Psychological Science, 14(1), 74-76. Magnussen, S., Greenlee, M. W., Asplund, R., & Dyrnes, S. (1990). Perfect visual short-term memory for periodic patterns. European Journal of Cognitive Psychology, 2, 345-362. Magnussen, S., Idas, E., & Myhre, S. H. (1998). Representation of orientation and spatial frequency in perception and memory: a choice reaction-time analysis. Journal of Experimental Psychology: Human Perception and Performance, 24(3), 707-718. McIntosh, A., Sekuler, A. B., Penpeci, C., Rajah, M., Grady, C., Sekuler, R., & Bennett, P. (1999). Recruitment of unique neural systems to support visual memory in normal aging. Current Biology, 9, 1275-1278. Owsley, C., Sekuler, R., & Siemsen, D. (1983). Contrast sensitivity throughout adulthood. Vision Research, 23(7), 689-699. Pelli, D. G., Robson, J. G., & Wilkins, A. J. (1988). Designing a new letter chart for measuring contrast sensitivity. Clinical Vision Sciences, 2, 187-199. Phillips, W. A. (1974). On the distinction between sensory storage and short-term visual memory. Perception & Psychophysics, 16(2), 283-290. Phillips, W. A., & Christie, D. F. M. (1977). Components of visual memory. Quarterly Journal of Experimental Psychology, 29, 117-133. Ratcliff, R. (1993). Methods for dealing with reaction time outliers. Psychological Bulletin, 114, 510-532. Salthouse, T. A. (1991). Theoretical perspectives on cognitive aging. Hillsdale, NJ: Erlbaum. Vincent, A., & Regan, D. (1995). Parallel independent encoding of orientation, spatial frequency, and contrast. Perception, 24(5), 491-499. Wingfield, A., & Kahana, M. J. (2002). The dynamics of memory retrieval in older adults. Canadian Journal of Experimental Psychology, 56, 187-199. Wingfield, A., & Stine-Morrow, E. (2000). Language and speech. In F. Craik & T. Salthouse (Eds.), The handbook of aging and
5
cognition, 2nd edition (p. 359-416). Mahwah, NJ: Lawrence Erlbaum Associates. Zhou, F., Kahana, M. J., & Sekuler, R. (2003). Short-term episodic memory for visual textures: A roving probe gathers some memory. Psychological Science, in press.