24 May 1999
Physics Letters A 256 Ž1999. 47–54
Equations of motion from chaotic data: A driven optical fiber ring resonator Henning U. Voss
a,1
, Andreas Schwache
b,2
, Jurgen Kurths a , Fedor Mitschke ¨
c
a
b
Institut fur ¨ Physik, UniÕersitat ¨ Potsdam, Am Neuen Palais, 14469 Potsdam, Germany Institut fur Corrensstr. 2 r 4, 48149 Munster, Germany ¨ Angewandte Physik, UniÕersitat ¨ Munster, ¨ ¨ c Fachbereich Physik, UniÕersitat ¨ Rostock, 18051 Rostock, Germany Received 21 December 1998; received in revised form 22 March 1999; accepted 24 March 1999 Communicated by C.R. Doering
Abstract We apply a recently proposed method for the reconstruction of equations of motion from a time series to experimental chaotic optical data and find the theoretically expected Ikeda model. In contrast to phase space reconstruction methods, it is based on nonlinear regression and maximal correlation, and the resulting model can be investigated further. We demonstrate the retrieval of physical parameters by calculating the experimentally not accessible phase evolution of a non-stationary data set. q 1999 Elsevier Science B.V. All rights reserved. PACS: 07.05.K Keywords: Nonlinear time series analysis; Nonlinear optics; Maximal correlation
1. Introduction A recently proposed method for the recovery of equations of motion from a chaotic time series w1,2x using nonlinear regression and maximal correlation is applied to experimental data from a passive optical ring resonator system. This system is theoretically described by the Ikeda model w3x, a standard model of chaotic dynamics. This allows for a test of the proposed method on experimental data by a comparison of the results with theory. In contrast to usual phase space reconstruction methods, our approach 1
E-mail:
[email protected] Present address: Balzers Process Systems, 63755 Alzenau, Germany. 2
leads to an explicit nonparametric estimate of the underlying equations of motion, allowing for a further examination of the dynamical model itself. In nonlinear time series analysis, modeling experimental data is usually based on a phase space reconstruction of the system, using Taken’s embedding theorem. ŽFor an overview see w4,5x and references therein.. Note that these phase space methods are ‘‘black-box’’ approaches in the sense that they are validated by comparison of their inputroutput behavior with the data, e.g. by their prediction performance or ability in noise reduction. In general, it is very difficult, if not impossible, to gain information about physical parameters from a model that is based on this phase space approach by investigating the model itself. The main reason is that the embed-
0375-9601r99r$ - see front matter q 1999 Elsevier Science B.V. All rights reserved. PII: S 0 3 7 5 - 9 6 0 1 Ž 9 9 . 0 0 2 1 9 - 4
48
H.U. Voss et al.r Physics Letters A 256 (1999) 47–54
ding of the time series usually leads to a complicated nonlinear transformation of the phase space, i.e., the reconstructed phase space is, in general, not the true phase space of the system. But some chaotic systems, like nonlinear feedback systems with a time delay, can be described by one-dimensional functional-differential equations w6x, and it is well known that such systems can exhibit even high-dimensional chaotic attractors w7x. If one does not take into account non-invertible observation functions, the problems of embedding do not appear for such one-dimensional systems, and in the case of one-dimensional delayed feedback systems even the complete equation of motion can be reconstructed from the data, as has been shown recently w8,1,2x. In optical systems, often the dynamics is described by a two-dimensional equation for the two complex components of the electric field. But the comparison of this model with experimental data is difficult, because only the intensity can be measured. We show for such a system, a passive ring resonator, that it is possible even in this case to avoid the problems of embedding. Our approach allows for an approximate reconstruction of the equations of motion with the evident advantage that the model equations can be investigated further, which may lead to a better understanding of the physics behind the model. In this Letter we demonstrate this by retrieving the evolution of a phase that cannot be measured experimentally. It is calculated from the dynamical evolution of the system and appears as a parameter in the estimated equations of motion.
2. Experimental setup We analyze time series of measured intensities from an experiment involving a driven nonlinear passive optical fiber ring resonator. The experiment consists of a ring resonator containing a length L f 10 m of polarization-maintaining single mode optical fiber and a beam splitter to couple light in and out. This resonator is driven by a stream of pulses, about 1 ps wide and spaced out by D t s 12 ns, from a color center laser operating at a wavelength of l s 1580 nm which in turn is synchronously pumped from a Nd:YAG laser. As light pulses travel around
the ring cavity, they experience a phase shift Q Ž t . s 2p nŽ t . L . Herein, the effective refractive index of l the fiber nŽ t . is given, for the fixed wavelength used here and for the time scales involved, as nŽ t . s n 0 q n 2 I Ž t .. The first term n 0 denotes the familiar classical refractive index, and the term n 2 I Ž t . gives rise to the intensity-dependent phase known as the optical Kerr effect, with I Ž t . the temporal intensity profile of the pulses, and n 2 the Kerr coefficient. The round trip time is made synchronous with the laser pulse repetition time D t so that after each round trip the pulse circulating in the cavity can interfere with the next incoming pulse 3. The combination of the stationary and the nonlinear cavity phase, Q 0 s Q Ž I s 0. and Qnl Ž t . s 2p n 2 I Ž t . Lrl, respectively, leads to complex modifications of the pulse structure upon interference and can lead to chaotic dynamics for some parameter regimes. More detail of the experiment has been presented in Refs. w9,10x. It has also been shown w9x that for certain parameter regimes Žwhich we consider here., the dynamics is well approximated by the Ikeda equation w3x.
3. Method The Ikeda equation is given as a map for the complex field amplitude Et in the cavity after the t th round trip, 2
Etq1 s aE0 q be iŽQ 0qc < E t < . Et ,
Ž 1.
where a, b, and c are real coefficients, depending on the feedback efficiency, the length of the Kerr medium, the wavelength, and the nonlinear index of refraction. The measured data are the intensities It s < Et < 2 A QnlŽ t ., where we have set an unknown factor from the measurement apparatus to unity. Therefore, to make an ansatz for a time series model to describe the data, we transform the complex Ikeda Eq. Ž1. to a model for the intensities. That means,
3 Actually, at each instant of time the cavity contains four light pulses. It is ensured that the pulses do not interact with each other, and for the analysis only every fourth pulse is recorded. Therefore, the effective repetition time is 48 ns, which equals the round trip time of the laser light.
H.U. Voss et al.r Physics Letters A 256 (1999) 47–54
instead of the Ikeda equation for the complex field amplitudes, Etq1 s f Ž Et . , f :C ™ C, Ž 2. Ž . here we will use a map for the real intensities, Itq1 s g Ž It , Ity1 , . . . , Ityk em bq1 . ,
g :R k em b ™ R.
Ž 3. The value for the dimension k emb of the embedding vector Ž It , Ity1 , . . . , Ityk em bq1 . depends on the dimension of the attractor underlying the dynamics. Since in our case the map f can be considered to be a two-dimensional map, a maximum dimension of five would be sufficient. Furthermore, not having to deal with a multi-dimensional embedding space, we split the function g into a sum of terms: Itq1 s g 1 Ž It . q g 2 Ž Ity1 . q . . . qg k Ž Itykq1 . , Ž 4 . where g 1 , . . . , g k :R ™ R. This is the final model ought to describe the data on the time series level of description; the relationship between this time series model and the physical model Ž1. will be established below, allowing to interpret ansatz Ž4. as some form of equation of motion. A necessary condition for the ansatz Ž4. to give a reasonable approximation for Eq. Ž3. is, of course, that k G k emb . Below we will present a procedure for the estimation of the particular value for the model order k from the data using the concept of maximal correlation. In Eq. Ž4., one could also include product terms like g i j Ž Itq 1y i Itq 1y j ., g i jk Ž Itq1yi Itq1yj Itq1yk ., etc. By an expansion of the Ikeda model we will also show below that in this case cross terms can be avoided. The approximation Ž4. for the phase space model Ž3. poses, in view of the problem of estimating models from data, a reduction of dimensionality: The phase space approach of nonparametrically estimating a function g Ž It , Ity1 , . . . , Ityk em bq1 . can always be traced back to a multi-dimensional nonparametric density estimation problem. A multi-dimensional density estimation problem generally suffers from the difficulty of reliably estimating densities in a higher dimensional space, given only a finite amount of data, or the ‘‘curse of dimensionality.’’ By approximating Eq. Ž3. with Eq. Ž4., we in fact switch from a multi-dimensional density estimation problem to a multi-dimensional regression problem, and ‘‘in general, the problem of nonparametric regression is
49
much easier than the problem of nonparametric density estimation’’ w11x. The price one has to pay is that in the expansion Ž4. we need a model order k G k emb . But as will be shown below, in practice this expansion can often be truncated already after a few terms. This dimensionality reduction is the crucial step for the further analysis and understanding of the model. Here, the replacement of the full model Ž3. by the split model Ž4. is performed by iterative substitution of ‘‘unwelcome’’ complex amplitudes by lagged amplitudes: Taking the absolute value of Ž1., one has 2
Itq1 s aE0 q be iŽQ 0qc I t . Et .
Ž 5.
Now, iteratively substituting Et given by Eq. Ž1. into Eq. Ž5., we get j
`
Itq1 s a2 I0 q b 2 It q 2 a 2 bI0
ž /
Ý b jcos Ý Pk js0
ks0
s a2 I0 q b 2 It q 2 a 2 bI0 cos Ž P0 . j
`
q 2 a 2 bI0
Ý
b j cos
js1
žÝ /
Pk ,
Ž 6.
ks0
where Pk s ŽQ 0 q cItyk . is used. Truncating this model at a finite maximum value for j, and using the addition theorem for the cosine, we now can eliminate the remaining terms containing P0 in the sum in Eq. Ž6. by inserting the truncated equation for It , and so on. Therefore, we finally get the intensity model Itq1 s a 2 I0 q b 2 It q 2 a 2 bI0 cos Ž Q 0 q cIt . q Tty1,ty2, . . . ,
Ž 7.
where Tty1,ty2, . . . denotes further lagged terms. The intensity model is of the form of Eq. Ž4. and the basic point for further analysis. First, we will fit this model in a nonparametric way to the intensity data, then, after checking the validity of the model, we will parameterize the estimated model functions to yield the static resonator phase Q 0 by comparison with Eq. Ž7..
4. Nonlinear regression and maximal correlation For estimating the functions g 1Ž It ., g 2 Ž Ity1 ., . . . , g k Ž Itykq1 . of Eq. Ž4. from a time series It Ž t s 1 . . . N ., we use a method that is based on nonlinear
H.U. Voss et al.r Physics Letters A 256 (1999) 47–54
50
regression analysis and maximal correlation. It relies on the nonparametric estimation of optimal transformations by the alternating conditional expectation ŽACE. algorithm of Breiman and Friedman w12x. ŽThe ACE algorithm has been applied to the analysis of chaotic systems in Refs. w1,2x and is also described briefly in Ref. w13x.. In the following, we consider the time series It Ž t s 1 . . . N . as a temporally ordered sample of a random variable x. Then, for a set of random variables x 0 . . . x k , optimal transformations are defined to solve regression problems of the form 2
k
E
ž
F 0 Ž x0 . y
Ý Fi Ž xi . is1
!
/
s min,
Ž 8.
tical quantity measures the dependence between two random variables, x 0 and x 1 w14x:
C Ž x 0 , x 1 . s sup
R Ž F 0 Ž x 0 . ,F 1 Ž x 1 . . ,
Ž 10 .
F 0 ,F 1
where R is the linear correlation coefficient. Thus, the functions F 0 Ž x 0 . and F 1Ž x 1 . maximize the linear correlation between the random variables x 0 and x 1. In other words, x 0 and x 1 are transformed by suitable, generally nonlinear, transformations to a linear relationship between the new random variables F 0 Ž x 0 . and F 1Ž x 1 .. Here, we use a generalization of the notion of maximal correlation for higher-dimensional regression problems, i.e.,
C Ž x0 , . . . , xk . k
where the functions F j are varied in the space of Borel measurable functions w14x with the only requirements of vanishing expectation, i.e., EwF j x s 0 Ž j s 0, . . . ,k ., and finite variance, i.e., EwF 02 x s 1. Here, the functions are computationally represented as local linear functions that can be easily estimated using local smoothing of the data set. Therefore, applying the regression problem Ž8. to data samples Itq1 Ž t s k . . . N y 1., . . . , Itq1yk Ž t s k . . . N y 1. corresponding to the random variables x 0 , . . . , x k , respectively, the result can be used as an estimate of the model Ž4. that is now given by k
Itq1 s Fy1 0
ž
Ý F i Ž Itq1yi . is1
/
.
Ž 9.
This expression resembles a ‘‘generalized autoregressive model’’ w15x but contains no stochastic driving. At this place it is important to emphasize that the model estimate Ž9. is given through the optimal transformations in a nonparametric form, in contrast to methods that deliver closed-form models w16,17x. In the latter case, coefficients of given basis functions or of serial expansions of functions are estimated by a minimization in coefficient spaces. On the other hand, the optimal transformations are estimated through a minimization in function space, and the results are functions rather than coefficients. The search for an optimum order k of the model Ž4. is an important step in this approach. We use here the concept of maximal correlation. This statis-
s
sup F 0 , . . . ,F k
ž
R F0Ž x. ,
Ý Fi Ž xi . is1
/
.
Ž 11 .
The problem of calculating the maximal correlation Ž11. is equivalent to estimating optimal transformations from data w12x. By definition, the value of C is restricted to the interval w0,1x. The maximal correlation has the important property that it is a statistical measure that captures any dependency between the variables x 0 to x k . If its value is estimated to be equal to one, it follows that there are no dependencies in the data left; they have all been transformed to a linear dependency through the optimal transformations F 0 , . . . ,F k . Applied to the intensity time series It Ž t s 1 . . . N ., the upper limit C s 1 could only be attained if the model Ž4. described the data completely. This is possible only for a noise-free data set and, because of the infinite sum in Eq. Ž6., for an infinite order k. However, the more terms are contained in the model Ž4., the better the approximation should be. Therefore, to estimate the cut-off order k for the model Ž4., we fit models Ž9. with increasing order k to the data and look from where on the maximal correlation fails to increase.
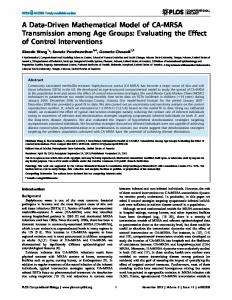
5. Results To demonstrate the application of this scheme, we first analyze a time series of 6000 points for the intensity of the laser light. Return maps of the data are shown in Fig. 1a,b. Fitting models Ž9. with
H.U. Voss et al.r Physics Letters A 256 (1999) 47–54
51
Fig. 1. The first and second return maps for Ža.,Žb. the measured laser light intensities, Žc., Žd. the model data for model order k s 4 ŽEq. Ž9.., and Že., Žf. the noise reduced measured laser light intensities. Since for the nonlinear noise reduction the embedding space must have an odd dimension, here an embedding with k em b s 5 has been used.
increasing order k s 1 . . . 10 yields, as expected, a monotonic increase of the maximal correlation that saturates at about k s 4 ŽFig. 2.. Since the data are rather noisy, the maximal correlation remains somewhat smaller than unity. Truncating the model Ž9. at k s 4, we yield the optimal transformations as depicted in Fig. 3. The zero-lag function F 1Ž It ., that can be seen as an estimate of the zero-lag function in
Eq. Ž7., resembles a superposition of a linear and a cosine-function, as expected. The remaining function estimates for the right hand side of Eq. Ž7. show a doubling of the number of maxima with increasing time lag, as is also expected from a further expansion of Eq. Ž7.. Furthermore, the first function F 0 , corresponding to the estimate for the left hand side of Eq. Ž7., is approximately the identity Žnot shown..
Fig. 2. The maximal correlation C for models Ž9. with order k from one to ten.
Fig. 3. The optimal transformations F 1Ž It . to F4 Ž Ity3 ..
52
H.U. Voss et al.r Physics Letters A 256 (1999) 47–54
Next, we numerically iterate this estimated map, given by the functions in Fig. 3, to produce numerical data, or surrogates, for a validation of the model by comparison with the measurements. As a result, the over-all shape of the attractor is well reproduced by the model data ŽFig. 1c,d.. However, one also observes a fine-structure of the attractor that is not visible in the original measurements ŽFig. 1a,b.. Since our model Ž9. does not include noise, the measurement noise in the data cannot be reproduced by this approach, and the modeling result is expected to contain a lower amount of noise. This fine-structure of the attractor is also revealed after application of a simple nonlinear noise reduction method w18x to the data that is based on local averaging in embedding space ŽFig. 1e,f.. We now come to the interpretation of the fitted equations themselves: We compare the estimated model Ž9. with the theoretically predicted Ikeda model Ž1. through the truncated expansion of the intensity model Ž7.. As already noted, the zero-lag function estimate looks like a superposition of a linear and a cosine term ŽFig. 3a.. Therefore, we next try to retrieve the unknown static phase Q 0 of the Ikeda model from a parameterized fit to the zero-lag optimal transformation. That is, we fit a function f Ž It . s a 0 q a1 It q a2 cos Ž a 3 q a 4 It .
Ž 12 .
to the optimal transformation F 1Ž It . by numerically estimating the coefficients a 0 –a4 . To estimate all parameters simultaneously, we use a gradient-expansion algorithm that performs a nonlinear least squares
Fig. 4. The zero-lag estimated optimal transformation F 1Ž It . Žbold line. and a numerical fit of Eq. Ž12.. The phase is estimated to be Q 0 sy0.95.
Fig. 5. Ža. The non-stationary intensity data where the static phase Q 0 has been increased gradually by a piezoceramic translator. The marked interval corresponds to a phase increase of 2p . To make the structure of the data more recognizable, only every fourth data point is shown. Žb. Local estimates for Q 0 using Eq. Ž12. Ždiamonds with error bars., and global linear fit using Eq. Ž13. Žstraight line.. The local phases have been estimated only for regions where the dynamics differ from a trivial noisy fixed point behavior. Since the errors of the coefficients in Eq. Ž12. are rather large, each phase shown corresponds to an average over five neighbored fits using Eq. Ž12., and the shown error bars are the standard deviations of these fits. The local phases can only be estimated up to modulo p and have been adjusted by adding multiples of p to follow the global fit, where necessary.
fit w19x. The coefficient a 3 then yields the static phase Q 0 . A comparison of the fitted function Ž12. to the zero-lag optimal transformation F 1Ž It . ŽFig. 4. indicates that the optimal transformation can indeed be parameterized by a function of the form Ž12., at least up to minor imperfections. Experimentally, the phase Q 0 is subject to fluctuations due to vibrations, minute temperature variations, etc. Unfortunately, it is also difficult to measure; the procedure given in Ref. w20x is too cumbersome to be used routinely. In order to obtain a verifiable estimate of the phase for our investigation, the following experiment has been performed: To produce data in which Q 0 has a known temporal variation, the length of the resonator was modified by use of a mirror mounted on a piezoceramic translator. The translator was driven by a slow voltage ramp. The resulting change in phase is fairly linear in time if the ramp is faster than temperature fluctuations. It is nevertheless slow enough to let the
H.U. Voss et al.r Physics Letters A 256 (1999) 47–54
system follow adiabatically and adapt transiently to changing attractors. Thus, we consider Q 0 Ž t . as a bifurcation parameter. From Fig. 5a one can see that after about 70 000 time steps the system repeats its behavior, indicating a phase increase of 2p per 70 000 time steps. We now fit models of the form Ž9. to segments of data of each 1000 time points from which we estimate by Eq. Ž12. the temporal phase evolution Q 0 Ž t .. Of course, this can be done only in dynamical regimes that do not show a fixed point behavior, resulting in 96 data segments. Additionally, assuming that the phase indeed varies linearly with time, we estimate the pertaining slope in a global way from all data at once 4 by fitting the coefficients a 0 –a5 of Itq1 s a 0 q a1 It q a 2 cos Ž a 3 t q a4 q a5 It . .
Ž 13 .
Both results are shown in Fig. 5b; the global fit yields a slope of 2p per 69 835 time steps, which is in good agreement with the value from visual inspection of the data.
6. Conclusion To sum up our results, we have shown on experimental data that in contrast to the usual modeling of dynamical systems basing on the phase space approach, it can be advantageous to estimate the governing equations of motion directly. This has been demonstrated using the concepts of nonlinear regression and maximal correlation. It allows not only for a proper numerical modeling of the dynamics but also for a further investigation of the governing laws of motion. In our example, it enables us to estimate the experimentally non-accessible phase evolution of non-stationary optical data by a local fit in time. The inverse problem to yield equations of motion from measured data is usually ill-posed in the sense that the solution cannot be expected to be unique or stable against small perturbations in the data. Considering the problem of uniqueness, here we have used a pragmatic approach: As in the case of phase space methods, the model has been validated by comparing the numerical output of the model with
4
We are indebted to J. Timmer ŽFreiburg. for this hint.
53
the data. The problem of stability has been addressed by the application to a data set with a slowly changing bifurcation parameter, observing that the result follows that change smoothly, although the attractor changes qualitatively. Many complex phenomena involve more degrees of freedom than the example considered here, but the resulting dynamics often reduces to a low-dimensional phase space. Estimating low-dimensional equations of motion for such systems, the result may be considered as an effectiÕe equation of motion where all parameters are summed up in only a few terms. Therefore, we expect that our method is also useful in in several other fields, such as meteorology, fluid dynamics, and physiology. Numerical tests on modeling several chaotic maps by a nonlinear regression analysis instead of the phase space approach indicate that the former is of practical interest also for modeling other systems than the optical system considered here. Since the method of nonlinear regression may lead in some cases to a better understanding of the laws describing the dynamical evolution of a system, we think that it constitutes a powerful supplement to phase space methods that holds promise for many applications. Acknowledgements H.U.V. acknowledges financial support from the Max-Planck-Gesellschaft. A.S. and F.M. acknowledge financial support from the Deutsche Forschungsgemeinschaft. References w1x H. Voss, J. Kurths, Phys. Lett. A 234 Ž1997. 336. w2x H. Voss, J. Kurths, to appear in Chaos, Solitons & Fractals, 1999. w3x K. Ikeda, H. Daido, O. Akimoto, Phys. Rev. Lett. 45 Ž1980. 709. w4x H. Kantz, T. Schreiber, Nonlinear Time Series Analysis, Cambridge University Press, Cambridge, 1997. w5x E. Ott, T. Sauer, J.A. Yorke, Coping with Chaos, Wiley, New York, 1994. w6x J.K. Hale, S.M. Verduyn Lunel, Introduction to Functional Differential Equations, Springer, New York, 1993. w7x J.D. Farmer, Physica D 4 Ž1982. 366. w8x M.J. Bunner et al., Phys. Lett. A 211 Ž1996. 345. ¨ w9x G. Steinmeyer et al., Phys. Rev. A 52 Ž1995. 830.
54
H.U. Voss et al.r Physics Letters A 256 (1999) 47–54
w10x G. Steinmeyer, F. Mitschke, Appl. Phys. B 62 Ž1996. 367. w11x J.R. Thompson, R.A. Tapia, Nonparametric Function Estimation, Modeling, and Simulation, SIAM, Philadelphia, 1990. w12x L. Breiman, J.H. Friedman, J. Am. Stat. Assoc. 80 Ž1985. 580. w13x W. Hardle, Applied Nonparametric Regression, Cambridge ¨ Univ. Press, Cambridge, 1990. w14x A. Renyi, Probability Theory, Akademiai Kiado, ´ ´ ´ Budapest, 1970.
w15x A.B. Owen, Technical Report ORION 020, Department of Statistics, Stanford University, 1983. w16x J.P. Crutchfield, B.S. McNamara, Complex Systems 1 Ž1987. 417. w17x J.L. Breeden, A. Hubler, Phys. Rev. A Ž1990. 5817. ¨ w18x T. Schreiber, Phys. Rev. E 47 Ž1993. 2401. w19x Procedure curvefit from IDL, Research Systems Inc., 1998. w20x G. Steinmeyer, D. Jaspert, F. Mitschke, Optics Comm. 104 Ž1994. 379.