arXiv:cond-mat/0401640v1 [cond-mat.stat-mech] 30 Jan 2004. Equilibrium statistical mechanics of network structures. I. Farkasâ , I. Derényiâ¡, G. Pallaâ , and T.
arXiv:cond-mat/0401640v1 [cond-mat.stat-mech] 30 Jan 2004
Equilibrium statistical mechanics of network structures I. Farkas† , I. Der´enyi‡ , G. Palla† , and T. Vicsek†,‡ †
Biological Physics Research Group of HAS and ‡ Department of Biological Physics, E¨ otv¨ os University, P´ azm´ any P. stny. 1A, H-1117 Budapest, Hungary
Abstract. In this article we give an in depth overview of the recent advances in the field of equilibrium networks. After outlining this topic, we provide a novel way of defining equilibrium graph (network) ensembles. We illustrate this concept on the classical random graph model and then survey a large variety of recently studied network models. Next, we analyze the structural properties of the graphs in these ensembles in terms of both local and global characteristics, such as degrees, degree-degree correlations, component sizes, and spectral properties. We conclude with topological phase transitions and show examples for both continuous and discontinuous transitions.
1
Introduction
A very human way of interpreting our complex world is to try to identify subunits in it and to map the interactions between these parts. In many systems, it is possible to define subunits in such a way that the network of their interactions provides a simple but still informative representation of the system. The field of discrete mathematics dealing with networks is graph theory. Research in graph theory was started by Leonhard Euler [1]. In the 1950s another major step was taken by Erd˝ os and R´enyi: they introduced the notion of classical random graphs [2–4]. By the late 1990s more and more actual maps of large networks had become available and modeling efforts were directed towards the description of the newly recognized properties of these systems [5–9]. A network is constructed from many similar subunits (vertices) connected by interactions (edges), similarly to the systems studied in statistical physics. Because of this analogy, the methods by which some of the central problems of statistical physics are effectively handled, can be transferred to networks, e.g., to graph optimization and topological phase transitions. In this article we will discuss the construction of network ensembles that fit into the concept of equilibrium as it is used in statistical physics, with a focus on structural transitions [10–14]. Note that even though structural transitions in growing networks are non-equilibrium phenomena [15–17], some of the main features of the structures constructed by growth can be reproduced by non-growing models (see, e.g., Refs. [11,12,18]). Similarly, non-growing
2
I. Farkas, I. Der´enyi, G. Palla, T. Vicsek
graphs are not necessarily equilibrium systems (see, e.g., Ref. [8]). Closely related real-world phenomena and mathematical models are the configurational transitions of branched polymers [19], structural transitions of business networks during changes of the “business” climate [20,21], the transitions of collaboration networks [22], networks defined by the potential energy landscapes of small clusters of atoms [23], and potentials on tree graphs as introduced by Tusn´ ady [24]. In the present review we intend to go beyond those that have been published previously [8,12,25], both concerning the scope and the depth of the analysis. We will focus on the structure of networks, represented by graphs, and will not consider any dynamics on them. Thus, several widely studied models are beyond the scope of the present review: models using, e.g., spins on the vertices [12,26–31], disease spreading [32–34] agent-based models on networks [35], or weighted edges and traffic on a network [36–39]. Definiton: Natural networks mostly arise from non-equilibrium processes, thus, the notion of equilibrium in the case of networks is essentially an abstraction (similarly to any system assumed to be in perfect equilibrium). We define equilibrium network ensembles as stationary ensembles of graphs generated by restructuring processes obeying detailed balance and ergodicity. During such a restructuring process, edges of the graph are removed and/or inserted. This definition raises a few issues to be discussed. First of all, the characteristic timescale of rewiring one particular link varies from system to system. For example, the network of biochemical pathways [40] available to a cell can undergo structural changes within years to millions of years, in contrast to business interactions [20,22], which are restructured over time scales of days to years, while the characteristic times of technological networks may be even shorter. With a finite number of measurements during the available time window it is often difficult to decide whether a graph that has not been observed has a low probability or it is not allowed at all. Hence, the set of allowed graphs is often unclear. A simple way to by-pass this problem is to enable all graphs and tune further parameters of the model to reproduce the statistics of the observed typical ones. Once the set of allowed graphs has been fixed, the next step in the statistical physics treatment of a network ensemble is to fix some of the thermodynamic variables, e.g., for the canonical ensemble one should fix the temperature and all extensive variables except for the entropy1 . At this point, an energy function would be useful. Unfortunately, unlike in many physical systems, the energy of a graph cannot be derived from first principles. A possible approach for deriving an energy function is reverse engineering: one tries to reproduce the observed properties of real networks with a suitable 1
In the mathematics literature, the entropy of graphs has been analyzed in detail [41–43].
Equilibrium statistical mechanics of network structures
3
choice of the energy in the model. Another possibility can be to explore the effects of a wide range of energy functions on the structures of networks. Alternatively, to suppress deviations from a prescribed target property, one can also introduce a cost function (energy). Having defined the energy, one can proceed towards a detailed analysis of the equilibrium system using the standard methods of statistical physics. Often a complete analogy with statistical physics is unnecessary, and shortcuts can be made to simplify the above procedure. It is very common to define graph ensembles by assigning a statistical weight to each allowed graph, or to supply a set of master equations describing the dynamics of the system, and to find the stable fixed point of these equations. Of course, skipping, e.g., the definition of the energy will leave the temperature of the system undefined. This article is organized as follows. In Section 2 we introduce the most important notions. Section 3 will concentrate on currently used graph models and the construction of equilibrium graph ensembles. Section 4 will discuss some of the specific properties of these sets of graphs. In Section 5 examples will be given for topological phase transitions of graphs and Section 6 contains a short summary.
2
Preliminaries
Except where stated otherwise, we will consider undirected simple graphs, i.e., non-degenerate graphs where any two vertices are connected by zero or one undirected edge, and no vertex is allowed to be connected to itself2 . The number of edges connected to the ith vertex is called the degree, ki , of that vertex. Two vertices are called neighbors, if they are connected by an edge. The degree sequence of a graph is the ordered list of its degrees, and the degree distribution gives the probability, pk , for a randomly selected vertex to have degree k. The degree-degree correlation function, p(k, k ′ ), gives the probability that one randomly selected end point of a randomly chosen edge will have the degree k and the other end point the degree k ′ . The clustering coefficient of the ith vertex is the ratio between the number of edges, ni , connecting its ki neighbors and the number of all possible edges between these neighbors: Ci =
ni . ki (ki − 1)/2
(1)
The clustering coefficient of a graph is Ci averaged over all vertices. The shortest distance, di,j , is defined as the smallest number of edges that lead 2
In a degenerate (or pseudo) graph multiple connections between two vertices and edges connecting a vertex to itself are allowed. Some additional extensions are to assign, e.g., weights and/or fitnesses to the edges and vertices.
4
I. Farkas, I. Der´enyi, G. Palla, T. Vicsek
from vertex i to j. Finally, a set of vertices connected to each other by edges and isolated from the rest of the graph is called a component of the graph. The two basic constituents of a simple graph are its vertices and edges, therefore it is essential whether a vertex (or edge) is distinguishable from the others. In this article, we will consider labeled graphs, i.e., in which both vertices and edges are distinguishable. A graph with distinguishable vertices can be represented by its adjacency matrix, A. The element Aij denotes the number of edges between vertices i and j if i 6= j, and twice the number of edges if i = j (unit loops). For simple graphs, this matrix is symmetric, its diagonal entries are 0, and the off-diagonal entries are 0 or 1. Note, that the adjacency matrix is insensitive to whether the edges of the graph are distinguishable: swapping any two edges will result in the same A. Also, it is possible to define equivalence classes of labeled graphs using graph isomorphism: two labeled graphs are equivalent, if there exists a permutation of the vertices of the first graph transforming it into the second one. As a consequence, each equivalence class of labeled graphs can be represented by a single unlabeled graph (in which neither the edges nor the vertices are distinguishable). These equivalence classes will be referred to as topologies, i.e., two graphs are assumed to have the same topology, if they belong to the same equivalence class. This definition is the graph theoretical equivalent of the definition of topology for geometrical objects, where two objects have the same topology, if they can be transformed into each other through deformations without tearing and stitching. The focus of this article is on graph restructuring processes. Denoting the transition rates between graphs a and b by ra→b , the time evolution of the probability of the graphs in the ensemble can be written as a set of master equations: X ∂Pa = (Pb rb→a − Pa ra→b ) , ∂t
(2)
b
where Pa is the probability of graph a. If the dynamics defined in a system has a series of non-zero transition rates between any two graphs (ergodicity), and there exists a stationary distribution, Pastat fulfilling the conditions of detailed balance, Pastat ra→b = Pbstat rb→a ,
(3)
then the system will always converge to this stationary distribution, which can thus be called equilibrium distribution. In the reverse situation, when the equilibrium distribution is given, one can always create a dynamics that leads to this distribution. Such a dynamics must fulfill the conditions of detailed balance and ergodicity. Since the detailed balance condition (3) fixes only the ratio of the rates of the forward and backward transitions between each pair of graphs (a and b), the most
Equilibrium statistical mechanics of network structures
5
general form of the transition rates can be written as ra→b = νab Pb ,
(4)
where all νab = νba values are arbitrary factors (assuming that they do not violate ergodicity).
3
Graph ensembles
Similarly to Dorogovtsev et. al [8,12] and Burda et. al [44], we will discuss graph ensembles in this section. According to statistical physics, for a rigorous analysis one needs to define the microcanonical, canonical, and grand canonical ensembles. However, even if some of the necessary variables, (e.g., the energy) are not defined, it is still possible to define similar graph ensembles. In equilibrium network ensembles, the edges (links) represent particles and one graph corresponds to one state of the system. In this article we will keep the number of vertices constant, which is analogous to the constant volume constraint. 3.1
Ensembles with energy
Energy is a key concept in optimization problems. Even if it is not possible to derive an energy for graphs from first principles, one can find analogies with well-established systems, and also phenomenological and heuristic arguments can lead to such energy functions [10–14], as described in the Introduction. Microcanonical ensemble. In statistical physics, the microcanonical ensemble is defined by assigning identical weights to each state of a system with a given energy, E, and a given number of particles; all other states have zero weight. Thus, the definition of a microcanonical ensemble is straightforward: assign the same weight, P MC = n−1 ,
(5)
to each of the n graphs that has M edges and energy E, and zero weight to all other graphs. Canonical ensemble. The canonical ensemble is composed of graphs with a fixed number of edges, and each graph a has a weight PaC =
e−Ea /T , ZC
where T is the temperature, Ea is the energy of this graph, and X ZC = e−Eb /T b
(6)
(7)
6
I. Farkas, I. Der´enyi, G. Palla, T. Vicsek
denotes the partition function. Network ensembles with a constant edge number and a cost function to minimize the deviations from a prescribed feature (e.g., a fixed total number of triangles), belong to this category. Grand canonical ensemble. The grand canonical ensemble is characterized by a fixed temperature (T ) and a fixed chemical potential (µ). The energy and the number of edges (particles) can vary in the system, and the probability of graph a is PaGC =
e−(Ea −µMa )/T , Z GC
(8)
where Ea and Ma denote the energy and edge number of graph a respectively, and X Z GC = e−(Eb −µMb )/T (9) b
is the partition function. 3.2
Ensembles without energy
Microcanonical ensemble. Numerous network models are defined through a static set of allowed graphs, and no restructuring processes are involved. Even if no energies and no probabilities are provided for these graphs, the microcanonical ensemble can still be defined by assigning equal weight to each allowed graph [8,45]. This is equivalent to assigning the same energy to each allowed graph (and a different energy to all the others). Canonical ensemble. If a graph model provides probabilities, {Pa }, for a set of graphs with an identical number of edges, then it can be considered as a canonical ensemble. One can easily construct an energy function from the probabilities using Eq. (6): Ea = −T log Pa + log Z .
(10)
That is, the energy can be defined up to a factor, T , and an additive term, log Z. The grand canonical ensemble. This ensemble is very similar to the canonical ensemble except that even the number of edges is allowed to vary. In this case an energy function can be constructed from Eq. (8): Ea = −T log Pa + µMa + log Z , and a new, arbitrarily chosen parameter, µ, appears.
(11)
Equilibrium statistical mechanics of network structures
3.3
7
Basic examples
The classical random graph. We will discuss this classical example to illustrate the concept of equilibrium network ensembles. The classical random graph model is based on a fixed number (N ) of vertices. The model has two variants. The first one [2] is the G(N, M ) model: M edges are placed randomly and independently between the vertices of the graph. The second variant [3] is the G(N, p) model: each pair of vertices in the graph is connected via an edge with a fixed probability, p. In both variants the degree distribution converges to a Poisson distribution in the N → ∞ limit: k
pk →
hki e−hki , k!
(12)
where hki = 2M/N in G(N, M ) and hki = pN in G(N, p). Viewing the edges as particles, the constant edge number variant of the classical random graph model corresponds to the microcanonical ensemble, since each particular configuration is generated with the same probability. In the constant edge probability variant, only the expectation value of the number of “particles” is constant, and can be described by the grand canonical ensemble. At this point one should also mention the notion of the random graph process [2,4], a possible method for generating a classical random graph. One starts with N vertices, and adds edges sequentially to the graph at independent random locations. In the beginning, there will be many small components in the graph, but after a certain number of inserted edges – given by the critical edge probability, pc – a giant component3 will appear. This transition is analogous to percolation phase transitions. The fraction of nodes belonging to the largest component in the N → ∞ limit is [4] G(hki) = 1 −
∞ 1 X nn−1 (hki e−hki )n . hki n=1 n!
(13)
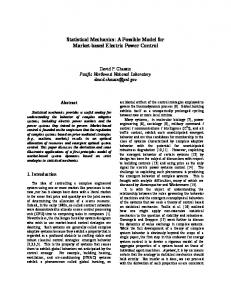
This analytical result and actual numerical data [46] showing the appearance of the giant component are compared in Fig. 1. The small-world graph. Another well-known example for a graph ensemble is the small-world model introduced by Watts and Strogatz [5]. The construction of a small-world graph starts from a one-dimensional periodic array of N vertices. Each vertex is first connected to its k nearest neighbors, where k is an even positive number. Then, each edge is moved with a fixed probability, r, to a randomly selected new location. This construction leads to a canonical ensemble: the number of edges is constant and the probabilities of the individual graphs in the ensemble are different, because the number of rewired edges can vary. 3
Note that the growth rate of this component is sublinear: it grows as O(N 2/3 ) [47].
8
I. Farkas, I. Der´enyi, G. Palla, T. Vicsek 0.7
0.6
0.5
G
0.4
N = 103 4 N = 10 5 N = 10 6 N = 10 7 N = 10 N = 108 theory
0.3
0.98
1
1.01
1.02
0.04
0.2
0.02
0.1
0 0.75
0.99
1
0 1.25
α
1.5
1.75
Fig. 1. Size of the largest component in a classical random graph as a function of the average degree, α = hki, of a vertex. Note that for N > 106 the Monte Carlo data is almost indistinguishable from the theoretical result in Eq. (13). Error bars are not shown, because in all cases the error is smaller than the width of the lines. The inset shows the transition in the vicinity of the percolation threshold, αc = 1. Figure from Ref. [46].
Ensembles with a fixed degree distribution. Many real-world graphs have a degree distribution that decays slowly, as a power law, as measured and described by Barab´ asi, Albert and Jeong [6,48]. These graphs are often referred to as scale-free. On the other hand, the classical random graph’s degree distribution has a quickly decaying (1/k!) tail (see Eq. (12)). The degree distributions of graphs have become central to numerous analyses and various graph ensembles with fixed degree distributions have been developed [8,12,44]. Given a network with the degree distribution pk , there exist several rewiring algorithms that retain the degrees of all nodes at each rewiring step and generate an equilibrium ensemble of graphs. Two examples are the link randomization [49] and the vertex randomization [50] methods. In both methods, two edges are selected first, and then one of the end points of each edge is picked and swapped, ensuring that none of the degrees are changed. The two methods are explained in detail in Fig. 2. The resulting canonical ensembles will have the degree distribution pk in common, but can have different equilibrium weights for the individual graphs. As pointed out by Xulvi-Brunet et.
Equilibrium statistical mechanics of network structures
1
a)
3
2
4
5
3
5
3
4
5
6
1
2
1
b)
2
6
1
4
3
5
6
9
2
4
6
Fig. 2. Generating graph ensembles by randomization methods that leave the degree sequence of a graph unchanged. (a) Link randomization. First, one selects two edges of the graph randomly. These are indicated by heavier lines: edges 1 − 2 and 3 − 4. Then, one end point of each edge is selected randomly – the end points at vertices 1 and 3, respectively – and the selected end points of these two edges are swapped. (b) Vertex randomization. One starts with selecting two vertices at random (vertices 5 and 6 in the example). Next, one of the edges at each vertex is picked randomly and their end points at the selected vertices are swapped.
al [50], upon link randomization the degree-degree correlations are removed from a network, but vertex randomization builds up positive degree-degree correlations. 3.4
Examples for graph energies
Energies based on vertex degrees. The most obvious units in a graph are the vertices themselves. Therefore, it is plausible to assign the energy to each vertex separately: E=
N X
f (ki ) .
(14)
i=1
Note that if the number of edges is constant, then the linear part of f is irrelevant (since its contribution is proportional to the number of edges in the graph), and simply renormalizes the chemical potential in case of the
10
I. Farkas, I. Der´enyi, G. Palla, T. Vicsek a)
b)
Fig. 3. Optimized networks generated by Berg and L¨ assig [10] using (a) energies with local correlations, see Eq. (17), and (b) energies based on global properties, see Eq. (23). In both cases, the temperature, T , was low. Notice that in both graphs disassortativity is present (see Sec. 4.1): vertices with high degrees (hubs, indicated by filled circles) are preferentially connected to vertices with low degrees (empty circles). Figure from Ref. [10].
grand canonical ensemble. In the infinite temperature limit any f will produce the classical random graph ensemble. If f decreases faster than linear, e.g., quadratically, E=−
N X
ki2 ,
(15)
i=1
then at low temperatures the typical graphs will have an uneven distribution of degrees among the vertices: a small number of vertices with high degrees and a large number of vertices with low degrees. In a model of Berg et. al [10], to avoid the occurence of isolated vertices and vertices with large degrees, the following energy was proposed: � N � X k2 − i + ηki3 , E= (16) 2 i=1 and graphs containing vertices of zero degree were not allowed. Energies based on degrees of neighboring vertices. Energies can also be assigned to edges, X g(ki , kj ) , (17) E= (i,j)
where the summation goes over pairs of neighboring vertices (i.e., over the edges). Energy functions of this type inherently lead to correlations between
Equilibrium statistical mechanics of network structures
HaL
HbL
HcL
HdL
HeL
11
HfL j i
l
j i
l
Fig. 4. (a)-(d) Snapshots of the simulation used by Baiesi and Manna [11] to generate an ensemble of scale-free equilibrium networks from a Hamiltonian dynamics, and (e)-(f) the Monte-Carlo rewiring method used during the simulation. The initial network is constructed from N links and N vertices: the vertices are connected as a ring. Later, M − N (M > N ) further edges are added to the network and the Monte-Carlo dynamics with the energy of Eq. (19) is used to decide whether a randomly selected edge, connecting vertices i and j1 , should be rewired to connect the previously unconnected pair of vertices, i and j2 . Blue (dark) edges meet at the vertex with the highest degree. Figure from Ref. [11].
vertices, as demonstrated by Berg and L¨ assig [10] using g(ki , kj ) = ζ δki ,1 δkj ,1 ,
(18)
see Fig. 3. Another example for this type of energy is g(ki , kj ) =
min(ki , kj ) −1, max(ki , kj )
(19)
which favors different degrees at the end points of an edge [11] (see Fig. 4 and Sec. 4.1). To account for correlations over longer distances, a logical next step would be to add terms containing second neighbor interactions, e.g., 1 E = − Tr A3 , 6
(20)
which counts the number of triangles in the graph with a negative sign. If the number of edges can be written as M = n(n − 1)/2 with an integer n (n < N ), then at low temperatures this energy leads to a complete (fully connected) subgraph on n vertices, leaving the rest of the vertices (N − n) isolated. Energies based on global properties. The most apparent global properties of a network are the sizes4 of its components, and especially, the size of 4
Component sizes are usually defined as the number of vertices in a component, however, in this article, because of the edge–particle analogy, si is the number of edges in the ith component.
12
I. Farkas, I. Der´enyi, G. Palla, T. Vicsek
the largest component, smax . A simple form of an energy containing component sizes is [13] E=
n X
f (si ) ,
(21)
i=1
where n is the number of components in the graph and si is the size of the ith component. The simplest form of the energy is proportional to the size of the largest component E = −smax .
(22)
In the ensemble defined by this energy as the temperature is lowered a phase transition occurs which is analogous to the density dependent transition of the classical random graph (see Sec. 3.3). This linear energy function was found to give a continuous transition [14], and the quadratic, E = −s2max or PN E = − i=1 s2i energies result in discontinuous transitions. A possible goal of optimization can be to decrease the graph’s diameter. This can be realized with, e.g., the energy [10] X di,j , (23) E= i,j
where the summation goes over all pairs of vertices. See also Fig. 3 for a typical network generated with this energy function. 3.5
Mapping the graph onto a lattice gas
A simple, natural mapping of a graph with N vertices onto a lattice gas with N (N − 1)/2 lattice sites5 is shown in Fig. 5. One particle of this lattice gas corresponds to one edge of the original graph, and can be at any of the N (N − 1)/2 lattice sites. Two lattice sites are neighbors, if the corresponding two edge locations (not necessarily occupied by edges) of the original graph have one end point in common. Note that this lattice strongly differs from the lattices generally used for lattice gases. Taking an arbitrary edge of the graph, there are 2(N − 2) other possible edges sharing an end point with this edge: in the lattice gas, therefore, each site has 2(N − 2) first neighbors. All the other N (N − 1)/2 − 2(N − 2) − 1 sites are second neighbors. The quadratic single-vertex energy is analogous to the usual definition of the energy for a lattice gas with nearest neighbor attraction, E=− 5
X
(α,β)
nα nβ = −
N X ki (ki − 1) i=1
2
,
(24)
This lattice is called the edge-dual graph of the complete (fully connected) graph of N vertices [4]. One lattice site corresponds to an edge in the complete graph.
Equilibrium statistical mechanics of network structures particle of lattice gas (one edge of the graph)
1
2
(1,3)
13
empty lattice site (possible edge of the graph)
(2,4)
3
4
Fig. 5. Mapping a graph onto a lattice gas. One edge of the graph corresponds to one particle. There are N (N − 1)/2 possible locations for an edge in a graph: these locations correspond to the sites of the lattice.
a standard choice to describe the nucleation of vapors. Here nα is the occupation number of lattice site α, which is 0 or 1, depending on whether the corresponding edge exists in the original graph. The summation in the first sum goes over all pairs of neighboring particles in the lattice gas, which corresponds to all pairs of edges sharing an end point in the original graph. This analogy can be extended to an Ising model with a Kawasaki-type dynamics, where spins have sα = 2nα − 1 = ±1 values and from Eq. (24) the energy of the system is X sα + 1 sβ + 1 , 2 2
(25)
N (N −1)/2 1 X 1 X N (N − 1)(N − 2) sα sβ − sα − . 4 2 α=1 8
(26)
E=−
(α,β)
which can be written as E=−
(α,β)
P Mapping the equilibrium graph ensemble with the − i ki2 energy onto a lattice gas shows that the only difference between this equilibrium P graph ensemble and a lattice gas with the nearest neighbor attraction E = − (α,β) nα nβ on, e.g., a cubic lattice is the underlying lattice. 3.6
Ensembles of degenerate graphs
Degenerate graphs occur in almost all kinds of real-world networks, e.g., in food webs (cannibalism), biochemical interaction networks (autocatalytic or multiple reactions), technological networks (multiple connections between subunits), collaboration networks (repeated co-authorships), and also in field theoretic expansions of particle interactions in the form of Feynman graphs [51]. Ensembles of degenerate graphs [8,12,44] can be introduced similarly to the case of simple graphs. The microcanonical ensemble on the set of all labeled degenerate graphs can be defined by assigning the same weight to
14
I. Farkas, I. Der´enyi, G. Palla, T. Vicsek
each graph with N vertices and M edges. The number of these elements can be given as follows. There are N (N + 1)/2 possible locations for an edge in a degenerate graph: one can pick two different vertices to be connected by an edge in N (N − 1)/2 different ways, and the number of locations for selfconnections is N . Each of the M (distinguishable) edges can be placed into any of these possible N (N + 1)/2 locations yielding P MC =
�
N (N + 1) 2
�−M
(27)
for the microcanonical probability distribution. It is straightforward to define a microcanonical ensemble on a subset of labeled degenerate graphs. Since the degree distribution is a characteristic property of most real-world graphs, it can be used to select a subset: labeled degenerate graphs with N vertices and a fixed degree distribution, pk , meaning that for each value of k there are exactly N (k) = N pk vertices in the graph with that degree. A given degree distribution is realized by many adjacency matrices, and each adjacency matrix is further realized by many labeled degenerate graphs (because the edges are distinguishable). Since each graph has the same weight in the microcanonical ensemble, the probability of a given adjacency matrix, A, is proportional to the number of different graphs, N (A), that realize this particular adjacency matrix6 : P MC (A) ∝ N (A) = M !
N Y
i=1
1 (Aii /2)!
N Y
j p1 .
(31)
16
I. Farkas, I. Der´enyi, G. Palla, T. Vicsek
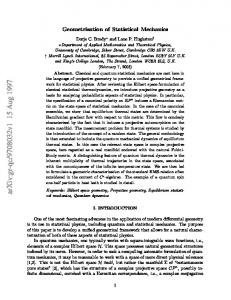
At the transition point, the component size distribution of a random graph with any fixed degree distribution is known to decay as a power law with the exponent −3/2 [55]. Near the transition, the component size distribution follows a power law with an exponential cutoff. This is in analogy with percolation phenomena, where the component sizes also have a power law distribution at the critical point. An analytic treatment of connected components in random graphs with fixed degree sequences is available in Ref. [57]. Spectral properties. Work related to the spectral properties of random structures was launched by Wigner’s semicircle law [58]. His result enabled the modeling of complex quantum mechanical systems lying far beyond the reach of exact methods and later it was found to have numerous applications in statistical and solid state physics as well [59,60]. As one particular extension of Wigner’s work, F¨ uredi and Koml´os [61] proved that the spectral density of a classical random graph also converges to a semicircle. It is important to note that in the classical random graph the number of edges is pN 2 /2 with p=const., i.e., it grows quadratically with the number of vertices. The general form of the semicircle law valid √ for the classical random graph [62] states that the spectral density of A/ pN , apart from the largest eigenvalue, will converge to � √ (2π)−1 4 − λ2 , if |λ| < 2; ρ(λ) = (32) 0, otherwise. The largest eigenvalue is detached from the rest of√the spectrum, and scales as p pN = hki, while the second largest one is about 2 pN = 2 hki [63,64]. Note that reducing the density of edges may destroy the semicircular distribution. In the case of a sparse7 classical random graph (i.e., with a fixed average degree) ρ(λ) converges to a distribution rich in singularities [65,66]. The next class of networks to be analyzed is graph ensembles with a fixed power law degree distribution. For both real-world networks and graph models having a power law degree distribution, the overall shape of the spectral density differs from the semicircle and the largest eigenvalues follow a power law distribution [65,71,72] (see Fig. 6). Chung et. al [73] have found that a fixed power law degree distribution with the exponent γ can be analytically connected to a power law tail of the spectral density with the exponent α: α = 2γ − 1,
if
γ > 2.5 .
(33)
The findings of related numerical and analytical studies [65,68,70] are in agreement with this result. Evidently, the large eigenvalues are caused by the 7
Sparse graphs are a common version of graphs expressing the fact that there is a cost associated to each connection, therefore, the average degree is limited even when N → ∞.
Equilibrium statistical mechanics of network structures
17
1.2 −1/2
0.01
ρ
ρ
−1/2
1 0.8
0.001
0.0001
0.6
2
4
8 1/2
| λ |
0.4 0.2 0 -6
-4
-2
0
2
4
6
8
1/2
λ
Fig. 6. Average spectral densities of scale-free graphs. (The average degree is hki = 10.) Main panel: Graphs with N = 100 (—), N = 1000 (– –), and N = 7000 (- - -) vertices and a degree distribution decaying as pk ∝ k−γ (γ = 3). A continuous line shows the semi-circular distribution for comparison. The central part of the scalefree graph’s spectral density is spiked in contrast to the flat top of the semi-circle. Also, the scale-free graph’s spectrum decays as a power law, while the semicircular distribution decays exponentially at its edges [67]. Inset: The upper and lower tails of ρ(λ) (open and full triangles) for scale-free graphs with N = 40, 000 vertices. Note that both axes are logarithmic and ρ(λ) has a power law tail with the same decay rate at both ends of the spectrum. The line with the slope −5 (i.e., the exponent γ = 5) in this figure is a guide to the eye, and at the same time a numerical prediction also that was later confirmed by analytic results [68–70]. Figure from Ref. [65].
large degrees in the graph. More precisely, it can be shown that the largest eigenvalues can be approximated by the square roots of the largest degrees [69]. We mention here that the spectral properties of a graph are closely related to random walks on the graph and to the electrical resistance of the graph as a network of resistors. For a concise review we refer the reader to Ref. [74].
5
Topological phase transitions in equilibrium network ensembles
As already mentioned, a widely studied phase transition in an equilibrium network ensemble is the occurrence of the giant component in the classical
18
I. Farkas, I. Der´enyi, G. Palla, T. Vicsek
random graph model as a function of the density of edges. For hki < 1, there is a similar transition in the ensemble with the E = −smax energy as a function of the temperature (see later). An appropriate order parameter for such transitions is the normalized size of the largest component, Φs = smax /M . In transitions where a condensation of edges onto one vertex (or a small number of vertices) occurs, the normalized largest degree, Φk = kmax /M , is the most appropriate order parameter. In general, such transitions where some global statistical property of the topology changes (measured by an order parameter), will be referred to as topological phase transitions. Ensembles with single-vertex energies. For several decreasing singleP vertex energies (e.g., E = − i ki2 ), a dispersed-connected phase transition can be observed as the temperature is changed. In the T → ∞ limit the dynamics converges to a completely random rewiring process (independent of the energy function chosen), and the classical random graph ensemble is recovered. At lower temperatures, since the decreasing nature of the energy function rewards high degrees, new phases appear with vertices of macroscopic degrees. P Analytic calculations for the E = − i ki2 energy with hki < 1 show that between the classical random graph phase (at high temperatures) and a phase with a star (at low temperatures) there exists a finite intermediate temperature range where both phases are stable or metastable. This predicted discontinuous transition [13], has been confirmed by Monte-Carlo simulations P (see Fig. 7). In the graph ensemble defined by the E = − i ki log(ki ) energy, two phase transitions can be observed. Both analytical and numerical results [14] support that when the temperature is lowered, the classical random graph first collapses onto a small number of stars accompanied by a jump in the order parameter, Φk (see Fig. 8a). In fact, in the N → ∞ limit this is a second order transition with an infinitely large critical exponent at T = Tc = 1. Further lowering the temperature will lead to another transition: a compactification where all edges collapse onto the minimum possible number of vertices (see Fig. 8b). This transition is discontinuous with a hysteresis. Note that for both single-vertex energy functions discussed here the total energy of the system in the different topological phases scales differently with N , which is connected to the singular changes in the average degree (see caption of Fig. 7). Transient ensembles vs. growing networks. Non-equilibrium processes, such as, growth, can produce a high variety of network ensembles. Some of these ensembles can also be constructed with the help of an equilibrium dynamics as a transient ensemble, i.e., as an intermediary and temporary ensemble between an initialPset of graphs and the final, equilibrium ensemble. In the case of the E = − i ki log(ki ) energy, during the process of relaxation from the classical random graph phase to the star-like phase near the critical
Equilibrium statistical mechanics of network structures
19
a)
Φ 1 0.6 0.2
100
N 10000 1000
0.001
1
T
b)
dispersed T high, Φ
star T low, Φ = 1
Fig. P 7. Topological phase transition in the graph ensemble defined by the E = − i ki2 /2 graph energy. (a) The order parameter Φ = Φk = kmax /M as a function of the temperature and the system size (hki = 0.5). The simulations were started either from a star (corresponding to T = 0, solid line) or a classical random graph (corresponding to T = ∞, dashed line). Each data point represents a single run, and averaging was carried out between the simulation times of t = 100N and 200N Monte-Carlo steps. The thick solid line shows the analytically calculated spinodal T1 = M/ log(N ). This panel is from Ref. [14]. (b) Two typical graphs from the two phases of the graph ensemble. At low temperatures, edges are condensed onto one vertex (Φ = 1), and the total energy of the system is non-extensive: it scales as N 2 . At high temperatures, one has a dispersed classical random graph with Φ ≈ 0, and the total energy of the system scales as N .
temperature, Tc = 1 (see Fig. 8b for two typical graphs illustrating these two phases), the degree distribution of the graphs in the transient ensemble decays continuously, as a power law (see Fig. 8c). The qualitative description of this phenomenon is the following. During the transition there is a “pool” of edges attached to vertices of small degrees, and a small number of vertices
20
I. Farkas, I. Der´enyi, G. Palla, T. Vicsek
a)
1000
1−P(k) 1
k max
c)
0.01 100 1
10 k
100
10 0.4 b)
0.8
1.2
1.6
T
Fig. P 8. Topological phases of the graph ensemble defined by the energy E = − i ki log(ki ). (a) The largest degree, kmax , for N = 10, 224 vertices and M = 2, 556 edges. Each data point shows the value of kmax averaged in one simulation run between the simulation times of t = 5, 000N and 20, 000N MC steps. The data points are connected to guide the eye. There is a sharp, continuous transition near T = 0.85 and a discontinuous transition (with a hysteresis) around T = 0.5 − 0.6. (b) The three different plateaus in (a) correspond to distinct topological phases: kmax = O(1) to the classical random graph, kmax = O(M ) to the star √ phase (a small number of stars sharing most of their neighbors) and kmax = O( M ) to the fully connected subgraph. (c) At T = 0.84 and t = 600N , one minus the cumulative Rk degree distribution, i.e., 1 − P (k) = 0 dk′ pk′ , follows a power law, thus, the degree distribution decays as a power law also. Figure from Ref. [14].
with higher degrees serve as centers of condensation. The change of energy associated with moving edges within the “pool” is negligible, whereas the nucleation centers are accumulating edges at a rate proportional to their degrees8 . This mechanism, produced by an equilibrium dynamics, is analogous 8
If an edge from the “pool” is moved to a vertex with a large degree (k), then the energy of the system changes by approximately ∆E = ∂E/∂k = − log k − 1. In the equilibrium dynamics the rate of this step will be e−∆E/T ∝ k at the critical temperature, T = Tc = 1.
Equilibrium statistical mechanics of network structures
21
to the preferential attachment rule of growing (non-equilibrium) models of scale-free networks [6,48], which also lead to power law degree distributions. Ensembles with neighboring vertex energies. Baiesi and Manna [11] have analyzed the canonical ensemble of connected graphs defined by the energy shown in Eq. (19). This energy favors degree dissasoratativity, i.e., a negative degree-degree correlation. As a function of temperature three phases have been identified in this ensemble: the classical random graph at T → ∞, scale-free graphs at intermediate temperatures, and a phase with a small number of stars at low temperatures. Ensembles with component energies. Similarly to the single-vertex case, a decreasing, component-size dependent energy can also lead to phase transitions. The simplest case which we analyze in this paragraph, is E = −smax . At low densities (hki < 1) one can observe a classical random graph at T → ∞, whereas at low temperatures a giant component is present. It can be shown that the dividing line between the two topological phases is [14] Tc (hki) =
1 , hki − 1 − log(hki)
(34)
which is also supported by numerical results (see Fig. 9). In the vicinity of the critical temperature the order parameter can be approximated as Φ∗s (T ) = 2
T −1 − Tc−1 (hki) 2
hki − 3 hki + 2
,
(35)
indicating that the phase transition is continuous (see Fig. 9 for details). Further ensembles. For the ensembles of degenerate graphs introduced by Dorogovtsev et. al [12] (see Sec. 3.6), with w(k) ∝ k + 1 − γ, a critical line, hki = kc (γ), was found. Below this line the degree distribution has an exponential cutoff and above that a condensate occurs where a finite fraction of all edges is attached to an inifitely small fraction of nodes. In an ensemble of connected tree graphs with a fixed, power law degree sequence, Burda et. al [44] have reported a phase transition as a function of two parameters: γ, the exponent of the degree distribution, and α, related to the probability of subgraphs (see Fig. 10). The analytic form of the dividing line between the identified generic and crumpled phases was computed, and numerical simulations were carried out using a Monte-Carlo sampling technique.
6
Summary
Graph models with energies provide a natural way to define microcanonical, canonical and grand canonical ensembles. These ensembles are often
22
I. Farkas, I. Der´enyi, G. Palla, T. Vicsek
1 3 T
Φ 1
2
0.5
0
1
2
1
0
3
1/T
connected disconnected 0 0
0.2
0.4
0.6
0.8
1
Fig. 9. Analytical phase diagram and Monte-Carlo simulation results for the graph ensemble defined by the E = −smax energy. Main panel: The white and shaded areas correspond to the ordered phase (containing a giant component) and the disordered phase, respectively as given by Eq. (34). Inset: The order parameter Φ = Φs = smax /M obtained from Monte-Carlo simulations as a function of the inverse temperature for hki = 0.1 (triangles) and hki = 0.5 (circles). Each data point shows averages taken for 10 runs between the simulation times of t = 100N and 500N Monte-Carlo steps. The open and closed symbols represent N = 500 and 1, 000 vertices, respectively. The critical exponent, in agreement with the analytical approximations (solid lines, see Ref. [13]), was found to be 1. Figure from Ref. [14].
generated by equilibrium restructuring processes obeying detailed balance and ergodicity. Also, to describe a wider range of network models, it is useful to extend the definition and consider ensembles without energy as well. We have reviewed the main features of currently studied equilibrium graph ensembles, with a focus on degree-degree correlations, component sizes and spectral properties. We have also discussed continuous and discontinuous topological phase transitions in equilibrium graph ensembles. A solid basis of the equilibrium statistical mechanics of networks, as presented in this article, can facilitate the application of statistical physics tools in the field of networks, and can help to expand the analyses towards problems of high current interest, such as optimization and reverse engineering.
Equilibrium statistical mechanics of network structures
23
α
13
crumpled
8
scale−free
3 generic
−2
1
2
3
γ
4
Fig. 10. Phase diagram of the two-parameter ensemble of scale-free tree graphs presented in Ref. [44]. Two phases were identified: generic and crumpled. The points of the dividing line to the right from the dot are scale-free graphs and belong to the generic phase. Figure from Ref. [44].
7
Acknowledgements
This work has been in part supported by the Hungarian Scientific Research Fund under grant No: OTKA 034995. I. F. acknowledges a scholarship from the Communication Networks Laboratory at ELTE.
References 1. L. Euler: Comm. Acad. Sci. Imp. Petrop. 8, 128–140 (1736) 2. P. Erd˝ os and A. R´enyi: Publ. of the Math. Inst. of the Hung. Acad. of Sci. 5, 17–61 (1960) 3. E. N. Gilbert: Ann. of Math. Stat. 30, 1141 (1959) 4. B. Bollob´ as: Random graphs, 2nd ed. (Cambridge University Press, Cambridge, 2001) 5. D. J. Watts and S. H. Strogatz: Nature 393, 440 (1998) 6. A.-L. Barab´ asi and R. Albert: Science 286, 509 (1999); 7. R. Albert and A.-L. Barab´ asi: Rev. Mod. Phys. 74, 47 (2002) 8. J. F. F. Mendes and S. N. Dorogovtsev: Evolution of Networks: From Biological Nets to the Internet and WWW (Oxford University Press, Oxford, 2003) 9. Handbook of Graphs and Networks, From the Genome to the Internet Ed. by S. Bornholdt and H. G. Schuster (Wiley-VCH, Berlin, 2002) 10. J. Berg and M. L¨ assig: Phys. Rev. Lett. 89, 228701 (2002) 11. M. Baiesi and S. S. Manna: Phys. Rev. E 68, 047103 (2003) 12. S. N. Dorogovtsev, J. F. F. Mendes, and A. N. Samukhin: Nucl. Phys. B 666, 396 (2003)
24
I. Farkas, I. Der´enyi, G. Palla, T. Vicsek
13. I. Der´enyi, I. Farkas, G. Palla, and T. Vicsek: cond-mat/0306170 (to appear in Physica A) 14. G. Palla, I. Farkas, I Der´enyi, and T. Vicsek: cond-mat/0309556 (to appear in Phys. Rev. E) 15. G. Szab´ o, M. Alava, and J. Kert´esz: Phys. Rev. E 67, 056102 (2003) 16. G. Bianconi and A.-L. Barab´ asi: Phys. Rev. Lett. 86, 5632 (2001) 17. P. L. Krapivsky, S. Redner, and F. Leyvraz: Phys. Rev. Lett. 85 4629-4632 (2000) 18. B. Bollob´ as and O. Riordan: to appear in: Combinatorica. 19. P. Bialas and Z. Burda: Phys. Lett. B 384, 75 (1996) 20. D. Stark and B. Vedres: Santa Fe Inst. working paper no. 01-12-081 (2001) 21. J.-P. Onnela, A. Chakraborti, K. Kaski, J. Kert´esz, and A. Kanto: Phys. Rev. E 68, 056110 (2003) 22. M. E. J. Newman: Phys. Rev. E 64, 016131 (2001); M. E. J. Newman: Phys. Rev. E 64, 016132 (2001). 23. J. P. K. Doye: Phys. Rev. Lett. 88, 238701 (2002). 24. G. Tusn´ ady: F´ ak evol´ uci´ oja. (The evolution of trees, in Hungarian.) Inaugural talk at the Hung. Acad. of Sci. (2001) 25. Z. Burda, J. Jurkiewicz, and A. Krzywicki: cond-mat/0312494 26. A. V. Goltsev, S. N. Dorogovtsev, and J. F. F. Mendes: Phys. Rev. E 67, 026123 (2003) 27. S. N. Dorogovtsev, A. V. Goltsev, and J. F. F. Mendes: Phys. Rev. E 66, 016104 (2002) 28. G. Bianconi: Phys. Lett. A 303, 166 (2002) 29. A. Barrat and M. Weigt: Eur. Phys. J. B 13, 547 (2000) 30. B. J. Kim, H. Hong, P. Holme, G. S. Jeon, P. Minnhagen, and M. Y. Choi: Phys. Rev. E 64, 056135 (2001) 31. S. N. Dorogovtsev, A. V. Goltsev, and J. F. F. Mendes: cond-mat/0310693 32. M. E. J. Newman: Phys. Rev. E 66, 016128 (2002) 33. D. H. Zanette and M. Kuperman: Physica A 309, 445 (2002) 34. N. Zekri and J. P. Clerc: Phys. Rev. E 64, 056115 (2001) 35. M. Anghel, Z. Toroczkai, K. E. Bassler, and G. Korniss: cond-mat/0307740 36. S.-H. Yook, H. Jeong, and A.-L. Barab´ asi: Proc. Natl. Acad. Sci. USA 99, 13382 (2002) 37. R. Pastor-Satorras, A. Vazquez, and A. Vespignani: Phys. Rev. Lett. 87, 258701 (2001) 38. R. Guimer´ a, A. D´ıaz-Guilera, F. Vega-Redondo, A. Cabrales, and A. Arenas: Phys. Rev. Lett. 89, 248701 (2002) 39. L. A. Braunstein, S. V. Buldyrev, and R. Cohen: S. Havlin, and H. E. Stanley: Phys. Rev. Lett. 91, 168701 (2003) 40. K. W. Kohn: Mol. Biol. Cell 10, 2703 (1999) 41. G. Simonyi: Graph entropy: a survey. In: Combinatorial Optimization, DIMACS Series in Discrete Mathematics and Computer Science, vol 20, ed by W. Cook, L. Lovasz, and P. Seymour (Center for Discrete Mathematics & Theoretical Computer Science, New Jersey, 1995) pp 399–441 42. I. Csisz´ ar, J. K¨ orner, L. Lov´ asz, K. Marton, and G. Simonyi: Combinatorica 10, 27 (1990) 43. M. Bauer and D. Bernard: cond-mat/0206150 44. Z. Burda, J. D. Correia, and A. Krzywicki: Phys. Rev. E 64, 046118 (2001)
Equilibrium statistical mechanics of network structures
25
45. S. N. Dorogovtsev, J. F. F. Mendes, and A. N. Samukhin: cond-mat/0206131 46. J. Dall and M. Christensen: Phys. Rev. E 66, 016121 (2002) 47. E. Ben-Naim, P. L. Krapivsky, and S. Redner: Extremal properties of random structures. In: Lecture Notes in Physics ed by E. Ben-Naim, H. Frauenfelder, and Z. Toroczkai Springer, in press (2004) 48. A.-L. Barab´ asi, R. Albert, and H. Jeong: Physica A272, 173 (1999) 49. S. Maslov and K. Sneppen: Science 296, 910 (2002) 50. R. Xulvi-Brunet, W. Pietsch, and I. M. Sokolov: Phys. Rev. E 68, 036119 (2003) 51. D. Bessis, C. Itzykson, and J. Zuber: Adv. Appl. Math. 1, 109 (1980) 52. M. E. J. Newman: Phys. Rev. E 67, 026126 (2003) 53. M. Bogu˜ na and R. Pastor-Satorras: Phys. Rev. E 68, 036112 (2003) 54. S. N. Dorogovtsev: cond-mat/0308444 55. M. E. J. Newman, S. H. Strogatz, and D. J. Watts: Phys. Rev. E 64, 026118 (2001) 56. M. Molloy and B. Reed: Random Struct. and Algorithms 6(2-3), 161 (1995) 57. F. Chung and L. Lu: Ann. Comb. 6, 125 (2002) 58. E. P. Wigner: The Ann. of Math. 67, 325 (1958) 59. M. L. Mehta: Random Matrices, 2nd ed. (Academic, New York, 1991) 60. A. Crisanti, G. Paladin, and A. Vulpiani: Products of Random Matrices in Statistical Physics, vol 104, Springer Series in Solid-State Sciences (Springer, Berlin, 1993) 61. Z. F¨ uredi and J. Koml´ os: Combinatorica 1, 233 (1981) 62. F. Hiai and D. Petz: The Semicircle Law, Free Random Variables and Entropy (Am. Math. Soc., 2000) 63. F. Juh´ asz: On the spectrum of a random graph. In: Colloq. Math. Soc. J. Bolyai (1978) pp 313–326 64. D. Cvetkovic and P. Rowlinson: Lin. and Multilin. Alg. 28, 3 (1990) 65. I. J. Farkas, I. Der´enyi, A.-L. Barab´ asi, and T. Vicsek: Phys. Rev. E 64, 026704 (2001) 66. M. Bauer and O. Golinelli: J. Stat. Phys. 103, 301 (2001) 67. B. V. Bronx: J. Math. Phys. 5, 215 (1964) 68. M. Mihail and C. H. Papadimitriou: On the Eigenvalue Power Law. In: Lecture Notes In Computer Science. Proceedings of the 6th International Workshop on Randomization and Approximation Techniques (Springer-Verlag London, UK, 2002) pp 254–262 69. F. Chung, L. Lu, and V. Vu: Proc. Natl. Acad. Sci. USA 100, 6313 (2003) 70. S. N. Dorogovtsev, A. V. Goltsev, J. F. F. Mendes, and A. N. Samukhin: Phys. Rev. E 68, 046109 (2003) 71. M. Faloutsos, P. Faloutsos, and C. Faloutsos: Comput. Commun. Rev. 29, 251 (1999) 72. K.-I. Goh, B. Kahng, and D. Kim: Phys. Rev. E 64, 051903 (2001) 73. F. Chung, L. Lu, Linyuan, and V. Vu: Ann. Comb. 7, 21 (2003) 74. L. Lov´ asz: Random Walks on Graphs: A Survey. In: Combinatorics, Paul Erd˝ os is Eighty vol 2 (Keszthely, Hungary, 1993) pp 1–46