Proceedings of the 10th INDIACom; INDIACom-2016; IEEE Conference ID: 37465 2016 3rd International Conference on “Computing for Sustainable Global Development”, 16th - 18th March, 2016 Bharati Vidyapeeth's Institute of Computer Applications and Management (BVICAM), New Delhi (INDIA)
Equivalent Circuit Modelling using Electrochemical Impedance Spectroscopy for Different Materials of SOFC Shuab Khan,
S. M. Aijaz Rizvi
Shabana Urooj
Gautam Buddha University, Greater Noida, India Email
[email protected]
Gautam Buddha University, Greater Noida, India Email
[email protected]
Assistant Professor Gautam Buddha University, Email Id-
[email protected]
Abstract - Suitable models are required to interpret the data for the characterization of the systems using EIS. On the basis of their interpretations, the models are divided into two kinds: process models and equivalent circuit models. These models use the experimental data for the estimation of the parameters which describes this data adequately and are used for the analysis of the system’s behavior in different conditions. In this paper, the equivalent circuits for EIS of different cathode materials are modeled, which are most commonly used for the interpretation of the electrochemical impedance data. In the modeling of the electrochemical performance, these models are built using the passive elements like- inductors, resistors, and capacitors and also the distributed elements like-Warburg diffusion impedance, Gerischer diffusion impedance, CPE (Constant Phase Element). The different combinations of these elements are used to build the equivalent circuits. Each element has some physical meaning in the equivalent circuits. Key Words: Solid oxide Fuel Cell –SOFC, Electro impedance Spectroscopy – EIS, Impedance Modeling.
I. INTRODUCTION
constant and frequency, therefore this fact is used for explaining electrochemical mechanisms, characterizing the different electrode materials with their performances and also their ions transportation properties. The EIS is generated after a sinusoidal AC voltage or current is applied on the top of a DC bias for different ranges of frequencies .The sizes and shapes of the plots obtained reflects the useful information about the conditions of operation, microstructure and material as well as its composition. The appropriate models of the systems are built to understand these experimental impedance data obtained, and after impedance spectra is fitted with the data, we can get its parameters. These obtained models depict its parameters as a physical or chemical meaning and helps to give the description of the system. Ideally each process has its arc in the EIS. But their capacitive nature gives very less time to relax during the change in the boundary conditions and hence overlapped arcs are obtained in the EIS. Quite often, at high and low frequencies, inductive or capacitive impedance in the EIS can also be observed which are obtained because of the impedance of the measurement leads.
As the strength value and phase of alternating current impedance depends on the frequency, so we use a sinusoidal voltage signal for measurements to excite an LTI system, and hence AC current is obtained, having the same frequency as voltage signal. These voltage and current expressions are then converted from a time to a frequency domain. So in turn, the time and frequency domain expressions are related to each other. Most often the Nyquist‟s plot and Bode‟s plots are represented for giving a clearer picture of this alternating current impedance.
B. Electrochemical Impedance Modeling of SOFCs As discussed above about the two modeling processes, in general, equivalent circuit modeling is widely used. This modeling type provides well enough overall performance comparisons, but usually because of the overlapping of the arcs obtained for various physiochemical processes, explanation of the physical source of the SOFC losses lacks accuracy. Hence, interpretations of the chemical as well as physical parameters may often be quite a challenge.
A. Electrochemical Impedance Spectroscopy (EIS) EIS is a powerful method and tool for the interpretation of performance of electrochemical systems and also in the investigation of the polarization processes in an SOFC. As the polarization loss mechanisms have different responses of time
C. Elements Used for the Impedance Modeling: 1) Resistance It has only real part and is independent of the frequency. The current through it and voltage are both in phase to each other. Some uses of resistance in electrochemical phenomenon:
Copy Right © INDIACom-2016; ISSN 0973-7529; ISBN 978-93-80544-20-5
2438
Proceedings of the 10th INDIACom; INDIACom-2016; IEEE Conference ID: 37465 2016 3rd International Conference on “Computing for Sustainable Global Development”, 16th - 18th March, 2016 a) Ohmic resistance (RΩ) it is also called the uncompensated resistance. It is the potential difference between the working and the reference electrode. The ohmic resistance depends on the conductivity of the electrolyte and the geometry of the electrode. In the Nyquist plot, at the high frequency end, the intersection of real axis and the impedance arc gives the RΩ. b) Polarization resistance (Rp) The electrode gets polarized when the potential difference is higher than its open circuited. The polarized electrode results in a flow of current due to the reactions on its surface. 2. Capacitance Its impedance has imag. part and is a function of the freq. Its impedance has the inverse proportional relation with the frequency. The current through it lags in phase by 90° with the voltage. Some uses of capacitance in electrochemical phenomenon: a. Double Layer-capacitance (Cdl) At the electrolyte/electrode interfaces exist an electrical double layer. The double layer thus formed when ions approach electrode surface from the solution. The charges of these ions and the charges in electrode are separated. The double layer-capacitance‟s value depends on number of variables likeimpurity adsorption, temperature, ionic concentrations, electrode roughness, types of ions, electrode potential, oxide layers, etc. b. Coating-Capacitance (CC) Typically, coatings‟ dielectric constants are in ranges „3-4‟ & of water is around „80‟. When coating gets penetrated by water, the dielectric constant is increased, and hence coating capacitance is also increased. Therefore, CC is used for measuring the amount of water absorbed by coating. 3. Constant-Phase Element(CPE) Modeling with an ideal capacitor assumes that the surface investigated is homogeneous which is not the case normally. This lacked homogeneity is modeled as a Q element, used to represent the CPE:ZQ = 1/ [Yo (jw) n] , where, Yo admittance of the ideal capacitance and n empirical constant(range: 0 – 1). And when n= 1, CPE acts like a pure capacitor; when n= 0, CPE acts like a pure resistor. Further, if n=0.5, CPE is the equivalent of the Warburg element, described in below. Double layer-capacitance and coating-capacitance, described above, are usually modeled by CPE. 4. Inductance An electrochemical cell‟s impedance can appear as to be inductive due to the surface‟s reactants adsorption & it can be modeled as an „Inductance‟. This behavior of inductance can also be formed from potentiostat non-idealities, inductance of cell cables, nonuniform current distribution and slow response of reference electrodes. In such cases, appearance of inductance shows the presence of error in the electrochemical impedance spectroscopy measurements.
5.
6.
Warburg Impedance Diffusion of ions at the interfaces of cell is common in electrochemical systems, which is modeled by using this impedance. For semi-infinitediffusion layer, impedance: ZW = 1 / [Yo (jw)0.5 ], where, Yo is the diffusion admittance. Warburg impedance has been characterized which have identical imaginary and real contributions, which results in 45° phase angle. Gerischer Element (G) Gerischer element in the circuit at the beginning was derived for the chemical reactions taking place in bulk sol. at first. On the Nyquist-plot, it looks like thin-layer diffusion element. It is given by the following equation: Y()= √ Where, Yo admittance parameter, and k rate constant parameter.
TABLE I.
CIRCUIT ELEMENT USED IN MODELLING WITH THEIR IMPEDANCES AND ADMITTANCES
Elements
Admittance
Impedance
R
(1/R)
R
L
1/(jL)
(jL)
C
(jC)
1/ (jC)
CPE
[Yo (j) n]
1/ [Yo (j) n]
0.5
1 / [Yo (j)0.5
Warburg Gerischer
[Yo (j) √
√
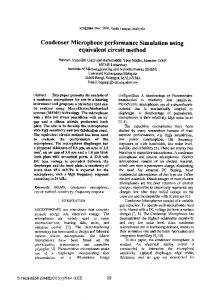
In the complex impedance plane, such impedance yields a semicircle with diameter (Fig.1a). It is clear that in the limit 0 the influence of the capacitance has to vanish, and the dc resistance R is obtained. At higher frequencies, the real part of the impedance Zreal decreases due to the dielectric “opening” of the capacitance (displacement current), whereas the imaginary part Zimag (or the phase shift between the currents going through the resistor and the capacitor) increases. The frequency where these two currents are equal and the imaginary part of the impedance reaches its maximum is the relaxation frequency, R, of the RC element. It is given by R = 1/ RC
Fig1(a)Impedance spectra of one RC element
Copy Right © INDIACom-2016; ISSN 0973-7529; ISBN 978-93-80544-20-5
2439
Equivalent Circuit Modelling using Electrochemical Impedance Spectroscopy for Different Materials of SOFC
Fig.1b impedance spectra of two RC element
There are two circuits shown in figure.1a and figure.1b which shows two different impedance spectra with different time constants. Two serial RC elements lead to two well-separated semicircles in the complex impedance plane if their relaxation frequencies are sufficiently different (Fig.1b). In a real system, this may for example be realised by a large difference in the magnitude of the capacitances and similar values for the resistances. Hence, if a measurement yields one or several well separated semicircles, the resistances and relaxation frequencies of the underlying processes can immediately be read from the Cole-Cole plot, and thus a capacitance can be calculated for each process. The magnitude of a capacitance is often already a strong indication of its physical origin. Generally, Nyquist plot shows the real impedance v/s the imaginary impedance which shows the inductive and capacitive characteristics. Also, these plots have some advantages that controlled activation processes with different constants of time shows the impedance arcs and their shape gives an idea of its mechanisms or its governed phenomenon.
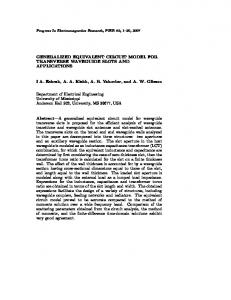
in low frequency region which is due to lead inductance or due to some inductive properties of fuel cell; a small arc is formed due to the RC in parallel in high freq. region; A semicircle followed by a 45° line can be seen which are given by the Warburg and Gerischer type impedance, however their responses are greatly overlapped in the medium to low freq. region as we have discussed above. We also observe that with the increasing of the thickness, time constants of the dynamics increase so the resistance from diffusion also increases[13]. We have also observed one more shortcoming of the Nyquist Plots. While looking at the plot‟s data points, we can‟t tell what freq. was used to record that point. But we can find that frequency by using Bode plot in EIS. As we can see from the figure, we can use any of the above circuits for two time constants but generally we prefer Fig.2.C for modeling for ease of calculations. In two time constants circuit, one RC circuit is due to high frequency and another one is due to low frequency.[2] In many situations, however, the required equivalent circuit representation and thus the interpretation of impedance spectra are more complicated. Difficulties emerge if two serial processes having similar relaxation frequencies. In such a case the two semicircles overlap, and the resulting impedance behavior may appear as a single, distorted arc in the complex impedance plane.
II. DISCUSSION It is clearly seen from the table that some physics-based equivalent circuit models are proposed, and electrochemical impedances of corresponding SOFCs have been fitted well accordingly by using EIS. Fitting of the curves give reaction rate constant, effective gas diffusions, adsorption equilibrium constant, oxygen surface diffusions, etc. Electrochemical impedance plots often contain several semicircles which may be perfect or may be suppressed semicircles. Each suppressed semicircle usually shows to a specific reaction or process. However, such an approach is often not a correct approximation since processes can be coupled. Examples of coupled processes include the Finite-Length-Warburg (FLW) impedance element, gas diffusion coupled with gas conversion, the Gerischer impedance element describing a coupling between diffusion and reaction12. While ploting each process‟ response (cathode Gerischer type surface adsorption/diffusion, inductance, anode Warburg gas diffusion, high frequency charge transfer reaction) individually, their separate peak frequency and contribution can be seen from their EIS curves as shown in table. A vertical line can be seen at highest freq. region at the fourth quadrant due to the inductance or it may be
Fig. 2: Equivalent circuit models with two time constants.
The decision on whether or not such a distorted semicircle consists of two components is aggravated by the empirical fact that experimental semicircles are always “non-ideal” to some degree, i.e. more or less depressed, even if they are caused by a “single” electrochemical process. Apparently, an RC element generally oversimplifies the real situation. A path frequently followed in order to deal with depressed semicircles is to replace the capacitor of an RC element by a so-called constant phase element CPE. Resistance can be a charge transfer resistance, polarization resistance, ohmic resistance etc. and capacitance can be double layer capacitance, etc. as per characterization of fuel cell.
Copy Right © INDIACom-2016; ISSN 0973-7529; ISBN 978-93-80544-20-5
2440
Proceedings of the 10th INDIACom; INDIACom-2016; IEEE Conference ID: 37465 2016 3rd International Conference on “Computing for Sustainable Global Development”, 16th - 18th March, 2016 Bharati Vidyapeeth's Institute of Computer Applications and Management (BVICAM), New Delhi (INDIA) TABLE II.
DIFFERENT SOFC CATHODE MATERIALS WITH THEIR EIS CURVES AND THEIR PROPOSED EQUIVALENT ELECTRICAL CIRCUITS.
Sr. No.
SOFC Cathode Materials
Electrochemical Impedance Spectroscopy (EIS)Data
Proposed Equivalent Electrical Circuits
1.
La0.8Sr0.2MnO3−δ
[1]
2.
LSM-CGO (La0.6Sr1.4MnO4+δ)
[2]
3.
SSC (Sm0.5Sr0.5CoO3−δ)
[3]
4.
LCF
[4]
5.
NSFCx NdxSr1-xFe0.8Cu0.2O3-δ (0.3 ≤ x ≤0.7)
[5]
6.
LSCF (La0.6Sr0.4Co0.8Fe0.2O3-δ)
[6]
7.
BSCF-GDC (Ba0.5Sr0.5Co0.8Fe0.2O3−δ) (Gd0.1Ce0.9O1.95)
[7]
8.
Nd2NiO4+δ
[8]
9.
NBCO (NdBaCo2O5+δ)
[9]
10.
PBCO(PrBaCo2O5+δ– Ce0.8Sm0.2O1.9)
[10]
Ref.
[
Copy Right © INDIACom-2016; ISSN 0973-7529; ISBN 978-93-80544-20-5
2441
Equivalent Circuit Modelling using Electrochemical Impedance Spectroscopy for Different Materials of SOFC
11.
PBSCF (PrBa0.5Sr0.5Co2δFeδO5+δ) (x=0.5, 1.0, 1.5)
III. CONCLUSION Modeling the equivalent circuit of EIS data for different kinds of cathode materials have been used to obtain physical properties of the system by the impedance data modeling in terms of an equivalent electrical circuit composed of resistance, capacitance, inductance etc. The values of these impedances can be easily calculated by using basic laws of KVL and KCL theoretically and also by using EIS fitting. We can also find the rate limiting step in SOFC performance with the help of EIS data and corresponding equivalent electrical circuits by finding the low frequency or high frequency region in EIS study. We have also concluded that the values of impedances depend upon the operating temperature of fuel cell, if we change the operating temperature then corresponding impedance values will change accordingly.
[11]
[12] Chang, B. Y. & Park, S. M. Integrated description of electrode/electrolyte interfaces based on equivalent circuits and its verification using impedance measurements. Anal. Chem.78, 1052–1060 (2006). [13] Qi, Y., Huang, B. & Chuang, K. T. Dynamic modeling of solid oxide fuel cell: The effect of diffusion and inherent impedance. J. Power Sources150, 32–47 (2005).
IV. REFERENCES [1]
[Vance, A. a. & McIntosh, S. Performance and Activation Behavior of Surface-Doped Thin-Film La[sub 0.8]Sr[sub 0.2]MnO[sub 3−δ] Cathodes. J. Electrochem. Soc.155, B1 (2008). [2] Liping, S., Lihua, H., Hui, Z., Qiang, L. & Pijolat, C. La substituted Sr2MnO4 as a possible cathode material in SOFC. J. Power Sources179, 96–100 (2008). [3] Park, I., Im, J., Choi, J., Ahn, J. & Shin, D. Enhanced performance of the Sm0.5Sr0.5CoO3−δ double layer porous cathode for solid oxide fuel cells. Solid State Ionics184, 35–38 (2011). [4] ohs, J. M. & Gorte, R. J. High-performance SOFC cathodes prepared by infiltration. Adv. Mater.21, 943–956 (2009). [5] Yin, J.-W. et al. Structure and Properties of Novel Cobalt-Free Oxides Nd x Sr 1– x Fe 0.8 Cu 0.2 O 3−δ (0.3 ≤ x ≤ 0.7) as Cathodes of Intermediate Temperature Solid Oxide Fuel Cells. J. Phys. Chem. C118, 13357–13368 (2014). [6] Baumann, F. S. Oxygen reduction kinetics on mixed conducting SOFC model cathodes. Arbeit (2006). [7] Liu, Q. L., Khor, K. a. & Chan, S. H. High-performance low-temperature solid oxide fuel cell with novel BSCF cathode. J. Power Sources161, 123–128 (2006). [8] Mauvy, F. et al. Oxygen electrode reaction on Nd2NiO4+δ cathode materials: Impedance spectroscopy study. Solid State Ionics158, 17–28 (2003). [9] Gu, H. et al. Oxygen reduction mechanism of NdBaCo2O5+?? cathode for intermediate-temperature solid oxide fuel cells under cathodic polarization. Int. J. Hydrogen Energy34, 2416–2420 (2009). [10] Zhu, C. et al. High-performance PrBaCo2O5+δ-Ce0.8Sm0.2O1.9 composite cathodes for intermediate temperature solid oxide fuel cell. J. Power Sources195, 3504–3507 (2010). [11] Jiang, L., Wei, T., Zeng, R., Zhang, W. X. & Huang, Y. H. Thermal and electrochemical properties of PrBa0.5Sr 0.5Co2-xFexO5+δ (x = 0.5, 1.0, 1.5) cathode materials for solid-oxide fuel cells. J. Power Sources232, 279–285 (2013).
Copy Right © INDIACom-2016; ISSN 0973-7529; ISBN 978-93-80544-20-5
2442