Lastly, these results have implications for AGN-selection methods such as the IRAC colorâcolor diagram (see Lacy et al. 2004,. 2007; Stern et al. 2005; Sajina et ...
The Astrophysical Journal, 715:1592, 2010 June 1 � C 2010.
doi:10.1088/0004-637X/715/2/1592
The American Astronomical Society. All rights reserved. Printed in the U.S.A.
ERRATUM: “SPITZER MID-INFRARED SPECTROSCOPY OF INFRARED LUMINOUS GALAXIES AT z ∼ 2. II. DIAGNOSTICS” (2007, ApJ, 664, 713) Anna Sajina1,5 , Lin Yan1 , Lee Armus1 , Philip Choi2 , Dario Fadda3 , George Helou1 , and Henrik Spoon4 1
3
Spitzer Science Center, California Institute of Technology, Pasadena, CA 91125, USA 2 Pomona College, Claremont, CA 91711, USA NASA Herschel Science Center, California Institute of Technology, Pasadena, CA 91125, USA 4 Cornell University, Ithaca, NY 14853, USA
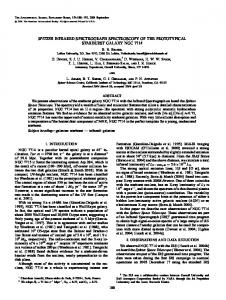
Online-only material: color figure The previously published Figure 12 was plotting the wrong values. Below we show the corrected figure, which is based on the aperture photometry flux density values given in Table 1. The paragraph starting with “Lastly, these results have implications for AGN-selection...” in Section 5.3 of the previously published paper is replaced with the following. Lastly, these results have implications for AGN-selection methods such as the IRAC color–color diagram (see Lacy et al. 2004, 2007; Stern et al. 2005; Sajina et al. 2005). These rely on the power-law continuum in the IRAC band of AGNs, and the PAH, and stellar bump features in the spectra of starbursts. In Sajina et al. (2005), we stressed that this might fail at z ∼ 2 due to the unknown fraction of AGNs whose host galaxies dominate at λ = 1.6 μm . Figure 12 shows the IRAC color–color plot for our sample. The vast majority of our continuum-dominated sources do indeed fall inside the AGN wedge. About 10% of the continuum-dominated sources fall outside of the AGN regime due to host galaxy emission as discussed above. This ignores the sources undetected in more than one IRAC band and therefore not included in Figure 12. On the other hand, most of our strong-PAH sources also fall inside the AGN wedge (although generally near the borderline regions). In this paper, we have argued that these sources are largely starburst dominated, but most also include an AGN component (as can be seen in their enhanced 5.8 μm luminosities). Although our sample is fairly biased (especially due to the 24/8 μm color selection) and hence not representative of the AGN population as a whole, it does imply that the use of this technique to search for obscured AGNs (Lacy et al. 2007) is effective over a range of redshifts, although significant contamination by starburst-dominated sources can still be expected. 1.5
1.0 AGN sources
log(S8.0 /S4.5)
0.5
0.0
-0.5
-1.0
-1.0
-0.5
0.0 log(S5.8/S3.6)
0.5
1.0
Figure 12. IRAC color–color plot of our sample, excluding sources with more than one band at