We consider the Singular Value Decomposition (SVD) of the matrix A: A = UΣV. T. U = [u1,... ..... We consider the Pascal matrix of dimension 20 whose estimated ...
Error estimates in linear systems with an application to regularization Claude BREZINSKI University of Lille - France
➜ ➜ ➜ ➜ ➜ ➜
The norm of the error Extrapolation The formula for extrapolation Estimates of the norm of the error A generalization An application to regularization
1
T HE
NORM OF THE ERROR
Ax = b y an approximation of x and e = x − y. We want to obtain an estimation of kek. We set r = b − Ay. We have Ae = r and the bounds krk ≤ kek ≤ kA−1 k · krk. kAk These bounds require the knowledge of kAk and kA−1 k, But kA−1 k is difficult to compute, and the lower bound can be quite a bad estimate of kek. Estimates for the error in the conjugate gradient were given by Golub and Meurant. T HE NORM OF THE ERROR
2
E XTRAPOLATION We will now obtain estimates of kek by an extrapolation method. We have c0 = (A0 r, A0 r)
A0
A0
0+0=0
c1 = (A0 r, A1 r)
A0
A1
0+1=1
c2 = (A1 r, A1 r)
A1
A1
1+1=2
c−1 = (A0 r, A−1 r)
A0
A−1
0 + (−1) = −1
A−1
(−1) + (−1) = −2
c−2 = (A−1 r, A−1 r) A−1
c−1
= (A0 r, A−1 r) = (e, Ae)
c−2
= (A−1 r, A−1 r) = (e, e) = kek2
E XTRAPOLATION
A-norm of the error norm of the error 3
We will interpolate the points (0, c0 ), (1, c1 ) and (2, c2 ) by some function and then .... extrapolate at the point −2.
E XTRAPOLATION
4
W HAT
W HAT IS EXTRAPOLATION ?
IS EXTRAPOLATION
?
5
Which curve? Answer: a curve which mimics the exact behavior of the ci If the function mimics the behaviour of the ci , then its value at −2 will be a good approximation of ke2k . For choosing the interpolation function, we have to analyze the behaviour of c0 , c1 and c2 . So, let us now analyze this behavior.
W HAT IS EXTRAPOLATION ?
6
We consider the Singular Value Decomposition (SVD) of the matrix A: A =
U ΣV T
U
=
[u1 , . . . , up ]
V
=
[v1 , . . . , vp ]
where U U T = V V T = I, Σ =diag(σ1 , . . . , σp ) with σ1 ≥ σ2 ≥ · · · ≥ σp > 0.
W HAT IS EXTRAPOLATION ?
7
Let v be any vector. It holds
Av AT v A−1 v
= = =
p X i=1 p X i=1 p X
σi (vi , v)ui σi (ui , v)vi σi−1 (ui , v)vi .
i=1
W HAT IS EXTRAPOLATION ?
8
c0 = (r, r)
=
(U T r, U T r) =
= (V T r, V T r) =
p X
αi2 ,
i=1 p X
βi2 ,
αi = (ui , r) βi = (vi , r)
i=1
c1 = (r, Ar) c2 = (Ar, Ar)
= =
p X i=1 p X
σi αi βi σi2 βi2
i=1
c−1 = (A−1 r, r) c−2 = (A−1 r, A−1 r)
W HAT IS EXTRAPOLATION ?
= =
(e, Ae) = (e, e) =
p X
σi−1 αi βi
i=1 p X σi−2 αi2 . i=1
9
T HE
FORMULA FOR EXTRAPOLATION
The function we will use for extrapolation has to mimic as closely as possible the behavior of the ci . So, we will keep only the first term in each of the preceding formulae, that is we will look for α, β and σ satisfying the interpolation conditions c0
= α2 = β 2
c1
= σαβ
c2
= σ2 β 2 .
and then extrapolate for the values −1 and −2 of the index. Thus, c−1 and c−2 will be approximated by c−1 ' σ −1 αβ
T HE FORMULA FOR EXTRAPOLATION
and c−2 = kek2 ' σ −2 α2 .
10
E STIMATES
OF THE NORM OF THE ERROR
The preceding system has 3 unknowns and 4 equations which are not compatible. Thus, it has several solutions. For example, we get the following e2i which are approximations of kek2 e21
=
c41 /c32
e22
=
c0 c21 /c22
e23
=
c20 /c2
e24
=
c30 /c21
e25
=
c40 c2 /c41 .
These estimates were numbered so that e1 ≤ e2 ≤ e3 ≤ e4 ≤ e5 . E STIMATES OF THE NORM OF THE ERROR
11
M ORE ESTIMATES : More estimates can be obtained by replacing c2 in all formulae above by e c2 = (AT r, AT r) =
p X
σi2 αi2 ,
i=1
and approximating it by σ 2 α2 . Similar results and properties are obtained. They will be denoted by putting a e over the letters. It holds ee2ν ≤ kek2 ,
∀ν ≤ 3.
The estimate ee3 was given by Auchmuty in 1992. E STIMATES OF THE NORM OF THE ERROR
12
N UMERICAL EXAMPLES : x = A−1 b is the exact solution of the linear system. y is any approximate solution of it. So, our estimates apply either to a direct method or to an iterative method for the solution of a system of linear equations. They estimate both the rounding errors and the error of the method.
E STIMATES OF THE NORM OF THE ERROR
13
BiCGSTAB: residual, error and estimate 10 9
10 6
10 3
10 0
10 -3
10 -6
0
10
20
30
40
50
60
70
80
90
100
Figure 1: BiCGSTAB for I+50*CIRCUL(100); cond(A) =101
E STIMATES OF THE NORM OF THE ERROR
14
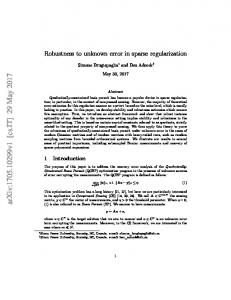
Figure 2: inv(I+50*circul(100)) κ = 101.0408, kAk = 4.0016 · 10−4 , kA−1 k = 2.5250 · 105
E STIMATES OF THE NORM OF THE ERROR
15
A GENERALIZATION : From here: joint work with G. Rodriguez and S. Seatzu (University of Cagliari, Italy). The five estimates e1 , . . . , e5 can be gathered into only one formula 2 3−i i−4 e2i = ci−1 (c c2 , 1) 0
i = 1, . . . , 5.
Moreover, this formula is not only valid for i = 1, . . . , 5, but also for any real number ν, that is e2ν = c0ν−1 (c21 )3−ν c2ν−4 ,
E STIMATES OF THE NORM OF THE ERROR
ν ∈ R.
16
P ROPER TIES : We have
µ e2ν =
¶ν µ 6 ¶ c0 c2 c1 ν 2 · = ρ e0 . 2 4 c1 c0 c2
So, e2ν is an increasing function of ν in (−∞, +∞) since ρ = (c0 c2 )/c21 ≥ 1. Therefore, it exists νe such that e2νe = kek2 . This νe is given by the formula νe = 2 ln(kek/e0 )/ ln ρ.
E STIMATES OF THE NORM OF THE ERROR
17
AN
APPLICATION TO REGULARIZATION
When a system is ill-conditioned, its solution cannot be computed accurately. Tikhonov’s regularization consists in computing the vector xλ which minimizes the quadratic functional J(λ, x) = kAx − bk2 + λ2 kHxk2 over all vectors x, where λ is a parameter, and H a given q × p (q ≤ p) matrix. This vector xλ is the solution of the system (C + λ2 E)xλ = AT b, where C = AT A and E = H T H. A N APPLICATION TO REGULARIZATION
18
If λ is close to zero, then xλ is badly computed while, if λ is far away from zero, xλ is well computed but the error x − xλ is quite large. For decreasing values of λ, the norm of the error kx − xλ k first decreases, and then increases when λ approaches 0. Thus the error, which is the sum of the theoretical error and the error due to the computer’s arithmetic, passes through a minimum corresponding to the optimal choice of the regularization parameter λ.
A N APPLICATION TO REGULARIZATION
19
Several methods have been proposed to obtain an effective choice of λ. The L–curve consists in plotting in log–log scale the values of kHxλ k versus krλ k. The resulting curve is typically L–shaped and the selected value of λ is the one corresponding to the corner of the L. However, there are many cases where the L–curve exhibits more than one corner, or no one at all. The Generalized Cross Validation (GCV) searches for the minimum of a function of λ which is a statistical estimate of the norm of the residual. Occasionally, the value of the parameter furnished by this method may be inaccurate because the function is rather flat near the minimum.
A N APPLICATION TO REGULARIZATION
20
But each of these methods can fail.
We are proposing another test based on the preceding estimates of the norm of the error.
Warning : We don’t pretend that this new procedure never fails!!!
A N APPLICATION TO REGULARIZATION
21
There are two questions that have to be answered: • Is xλ well computed? For answering this question, we propose the following test. Remember that the vector xλ is the solution of (C + λ2 E)xλ = AT b, where C = AT A and E = H T H. Set rλ = b − Axλ . Since AT rλ = λ2 Exλ , it holds λ2 kExλ k = 1. T kA rλ k So, it could be checked if this ratio is close to 1 for all λ.
A N APPLICATION TO REGULARIZATION
22
• Is xλ a good approximation of x? For this question, the preceding estimates could be used. However, due to the ill-conditioning, e c2 = kAT rλ k2 is badly computed when λ approches zero. So, again, we will replace AT rλ by λ2 Exλ in kAT rλ k and in (rλ , Arλ ) = (AT rλ , rλ ).
A N APPLICATION TO REGULARIZATION
23
In order to find the best value of the parameter λ, we will now apply our estimates of the norm of the error to Tikhonov’s regularization method. Effecting the preceding substitutions, we finally obtain the error estimates e2ν = krλ k2ν−2 (rλ , Exλ )6−2ν kExλ k2ν−8 λ−4 . Contrarily to the more general estimates which are always valid, this new formula is only valid for Tikhonov’s regularization. So, it should lead to better numerical results. Testing the equality λ2 kExλ k/kAT rλ k = 1 is also only valid for Tikhonov’s regularization. Let us remark that (rλ , Exλ ) = (Hrλ , Hxλ ) which avoids computing the matrix E and, in several cases, leads to a more stable procedure. A N APPLICATION TO REGULARIZATION
24
E XAMPLE 1: In this example we show how our estimates behave in a problem for which the L–curve method fails. We consider the Pascal matrix of dimension 20 whose estimated condition number is 1.03 · 10+21 . The solution was chosen to be x = (1, . . . , 1)T , the noise level on the right hand side was 10−8 , and the regularization matrix was the identity. The thick line gives the Euclidean norm of the error. From the bottom to the top, the solid lines represent ee1 , ee3 and ee5 versus λ, while the dashed ones are ee2 , ee4 and ee6 .
A N APPLICATION TO REGULARIZATION
25
10
10
5
10
0
10
−5
10
−10
10
−5
10
0
10
Figure 3: Error and estimates
A N APPLICATION TO REGULARIZATION
26
• Using the SVD for computing xλ , the minimal value for kx − xλ k is equal to 1.1 · 10−3 , and is reached for λ = 6.1 · 10−3 . • Our estimates furnish λ = 7.8 · 10−3 , and the corresponding error is the optimal one, within the first two significant digits. • The GCV provides λ = 4.8 · 10−4 with an error of 2.6 · 10−3 . • The L–curve is displayed in the next Figure. It does not exhibit a recognizable corner (it is not even L-shaped), but the routine from Hansen’s toolbox incorrectly locates a corner at λ = 1.7 · 10+9 , with a corresponding error of 4.1.
A N APPLICATION TO REGULARIZATION
27
L−curve, Tikh. corner at 1693045942.6576 0.00016696 0.0047295 0.13397
3.7951 107.5054 3045.3372 86266.1458
solution norm || x ||
2
2443685.9927
69222997.8866
1960899825.4186
0
10 −10 10
−5
10
0
5
10 10 residual norm || A x − b ||2
10
10
15
10
Figure 4: L–curve A N APPLICATION TO REGULARIZATION
28
E XAMPLE 2: We consider the Baart matrix of dimension 20. The solution was chosen to be x = (1, . . . , 1)T , the noise level on the right hand side was 10−8 , and the regularization matrix was the discrete approximation of the second derivative. For this example, we plot the ratio λ2 kExλ k/kAT rλ k with respect to λ. This ratio must be equal to 1 for all λ. The vertical dashed line indicates the value of λ where keλ k reaches its minimum. Thus, this ratio could also be used as a test for the correctness of the computation of xλ , as mentioned above.
A N APPLICATION TO REGULARIZATION
29
1
0.8
0.6
0.4
0.2
0
−0.2
−10
10
−5
10
0
10
Figure 5: Ratio λ2 kExλ k/kAT rλ k for Baart matrix
A N APPLICATION TO REGULARIZATION
30
E XAMPLE 3: The conjugate gradient itself has a regularizing effect. Let us now use our estimates for stopping the iterations of CG. We take the Gaussian matrix of dimension 10000, with a unit solution, and a noise level of 10−4 . Its asymptotic condition number, when the parameter σ is equal to 0.01, is 1.0 · 10214 . Left: error (thick line), estimates eeν for ν = 1, . . . , 5, versus the iterations. Right: (thick plain line), A-norm error, (e, Ae)1/2 (thick dashed line), estimates ee3 (thin plain line), (b e3 )1/2 (thin dashed line).
A N APPLICATION TO REGULARIZATION
31
2
2
10
10
1
1
10
10
0
0
10
10
−1
−1
10
10
−2
−2
10
10
−3
−3
10
10
−4
10
−4
0
50
100
10
0
50
100
Figure 6: Regularizing CG: Gaussian matrix
A N APPLICATION TO REGULARIZATION
32
E XAMPLE 4: Finally, let us solve an image deblurring problem by CG. The size of the image is 256 × 256, and so dimension of the system is 2562 = 65536. We initially apply a Gaussian blur to a test image, displayed on the left of the Figure (see below), and contaminate it with a noise at level 10−4 and 10−2 . The next Figure reports the graph of the error (thick lines) and of e3 (thin lines) for the two noise levels.
A N APPLICATION TO REGULARIZATION
33
ε =10−4
3
ε =10−2
3
10
10
2
10
2
10
1
10
1
10 0
10
−1
10
1
0
10
20
30
40
10
1
3
5
7
9
Figure 7: CG: deblurring problem A N APPLICATION TO REGULARIZATION
34
test image
−4
blurred (ε =10 )
recovered (k=17)
Figure 8: Images for the deblurring problem
A N APPLICATION TO REGULARIZATION
35
R ECENT
WORKS
➜ Least squares solution of rectangular systems C.B., G. Rodriguez, S. Seatzu ➜ Partial Lanczos bidiagonalization of the matrix L. Reichel, G. Rodriguez, S. Seatzu
R ECENT WORKS
36
S OME
REFERENCES
• G. Auchmuty, A posteriori error estimates for linear equations, Numer. Math., 61 (1992) 1–6 • C. Brezinski, Error estimates for the solution of linear systems, SIAM J. Sci. Comput., 21 (1999) 764–781. • C. Brezinski, G. Rodriguez, S. Seatzu, Error estimates for linear systems with applications to regularization, Numer. Algorithms, 49 (2008), to appear. • A. Galantai, A study of Auchmuty’s error estimate, Comput. Math. with Appl., 42 (2001) 1093–1102. • G.H. Golub, G. Meurant, Matrices, Moments and Quadrature with Applications, to appear.
S OME REFERENCES
37