ERSS 2005: Coreference-Based Summarization Reloaded Ren´e Witte and Ralf Krestel Faculty of Informatics Institute for Program Structures and Data Organization (IPD) Universit¨at Karlsruhe, Germany witte|
[email protected]
Abstract We present ERSS 2005, our entry to this year’s DUC competition. With only slight modifications from last year’s version to accommodate the more complex context information present in DUC 2005, we achieved a similar performance to last year’s entry, ranking roughly in the upper third when examining the ROUGE-1 and Basic Element score. We also participated in the additional manual evaluation based on the new Pyramid method and performed further evaluations based on the Basic Elements method and the automatic generation of Pyramids. Interestingly, the ranking of our system differs greatly between the different measures; we attempt to analyse this effect based on correlations between the different results using the Spearman coefficient.
1
Introduction
The fourth automatic summarization competition within the yearly DUC series marks a shift from the general summarization tasks present in previous years to the generation of focused, context-specific summaries. In this paper, we present ERSS 2005, a system based on fuzzy coreference resolution, and its performance as indicated by automatic and manual evaluation results. 1.1
DUC 2005: Context-based Multi-Document Summarization
Unlike in previous years, DUC 2005 consisted of one task only, the creation of summaries for document clusters based on a prescribed context. Each of the 50 given clusters represented a (TREC) topic and contained between 25 and 50 newspaper articles. The individual articles were taken from the Financial Times of London collection and the Los Angeles Times collection.
Sabine Bergler The CLaC Laboratory Department of Computer Science and Software Engineering Concordia University, Montr´eal, Canada
[email protected]
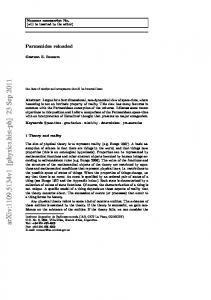
For each document cluster, a multi-document summary of 250 words length had to be generated based on a complex context, which consisted of a set of (related) open questions; an example can be seen in Figure 1. An additional granularity field indicated if the summary for the context should be at a general level or go more into specific details. 1.2
Contents Outline
In the following section, we provide some more details on our summarization system ERSS and its implementation. Section 3 examines our system’s performance based on the results provided by NIST and our participation in the optional Pyramid evaluation scheme; additionally, we evaluated our system using automatically created Pyramid annotations and Basic Elements (BE). Our conclusions appear in Section 4.
2
System Design and Implementation
This year’s system is almost identical to the ERSS suite developed for the previous year’s DUC competition, as described in (Bergler et al., 2004), which in turn was an enhanced version of the 2003 system (Bergler et al., 2003). Thus, here we only provide a brief overview and focus on the changes to last year’s system. For more details, we refer the reader to our previous papers. 2.1
Summarization Strategy Overview
Our summarization system is based on a single strategy, the generation and processing of coreference chains using fuzzy set theory. We compute both inter- and intra-document coreference chains, together they indicate which entities are important within a document and across documents. For focused summaries based on a set of questions, we consider the context as yet another document within a cluster when computing cross-document coreference chains. This allows us to identify information within and
across documents that are semantically connected with one or multiple question(s) from the context. Sentences are then extracted based on a scoring and ranking scheme and assembled into a multi-document summary, with only light postprocessing performed on each sentence. 2.2
Implementation
ERSS has been implemented based on the GATE (General Architecture for Text Engineering) framework (Cunningham et al., 2002). As a component-based architecture, individual analysis components (so-called processing resources) can be easily added, modified, or removed from the system. An extension to the framework allows us to load and process multiple documents for common processing, a prerequisite for cross-document annotations, like coreference resolution results. To process a (multi-)document, a pipeline of processing components is run in sequence, each adding annotations to the text. The most important components within our system, in order of their execution, are: Preprocessing: a number of preprocessing components perform tokenization, gazetteering (marking tokens with semantic labels based on lists like person names, locations, or companies), abbreviation detection, quote recognition, and sentence splitting. POS Tagger: part-of-speech tagging is performed by the Hepple tagger (Hepple, 2000) included in the GATE distribution. NE Transducer: a multi-stage JAPE1 transducer, based on the ANNIE system that comes with GATE, identifies several named entities, like Persons, Organizations, Locations, or Number and Date information. NP/VP Chunker: noun chunking is performed in two steps; firstly, base NPs are generated using the POS tags and NE information. This NP chunker is implemented in JAPE and replaces our Earley-based chunker used in the previous two years. Secondly, long NPs are generated based on some prepositional and conjunctional patterns. An additional JAPE chunker analyses verb phrases. Fuzzy Coreferencer: this component builds fuzzy coreference chains. Details on the fuzzy algorithms are available in (Witte and Bergler, 2003; Witte, 2002) and their use within our summarization system is described in (Bergler et al., 2004; Bergler et al., 2003). 1 A regular-expression based language for writing grammars over annotations, from which (non-deterministic) transducers can be generated by a GATE component.
Summarizer: this is our summarization framework, which allows for pluggable summarization strategies, described in more detail below. 2.3
Summarizer
Our summaries consist of a sequence of text extracts. A summarization framework allows the development of different summarization strategies. For each strategy, features are extracted from a document’s annotations (for example, the length of a coreference chain) and the features are weighted, resulting in a rank for an annotation. Based on this rank, we then extract the selected annotation(s), for example, a list of NPs or sentences. For DUC 2005, we essentially used the same strategies we developed for task 5 of DUC 2004 (NIS, 2004): summaries are generated based on either coreference chains or coreference clusters (Bergler et al., 2004). Since the 2005 competition only allowed the submission of one result per group, we chose the cluster-based strategy. Our summarization strategy was changed for this year only slightly to better handle multiple NPs in the context, which corresponds to the (single-NP) question of task 5 in DUC 2004: We cluster NPs from the question with the NPs in the documents based on the computed fuzzy coreference chains. Thus, for each NP in the context, we obtain at most one cluster (depending on the clustering parameters, several question NPs might be clustered together). For each cluster, we choose one representative sentence, then continue with the next cluster to ensure that the generated summary covers all context NPs. The crucial aspect is to rank the noun phrases of each cluster in accordance with a set of features: NP length: This feature ranks an element according to its string length (longer NPs receive a higher rank). Apposition: If an element is part of an apposition, this feature gives a higher score to this element. Context: To rank sentences higher that contain several noun phrases from the question, we project this fact onto the noun phrases of a sentence by giving every NP a score according to the number of other noun phrases in the sentence that are also part of the context. Specific NPs: This feature gives every noun phrase a score depending on the number of specific noun phrases in the sentence where it occurs. This is achieved by examining whether the NP has additional named entity annotations that correspond to one contained in a list of types indicating specific information. For example, the full name of a person is probably undesirable within a general summary. This feature scores noun phrases higher that have no specific elements in the same sentence. For this
“What countries are or have been involved in land or water boundary disputes with each other over oil resources or exploration? How have disputes been resolved, or towards what kind of resolution are the countries moving? What other factors affect the disputes?” The ministers of Asean – grouping Brunei, Indonesia, Malaysia, the Philippines, Singapore and Thailand – raised the Spratlys issue at a meeting yesterday with Qian Qichen, their Chinese counterpart. The meeting takes place against a backdrop of the continuing territorial disputes involving three Asean members – China, Vietnam and Taiwan – over the Spratley Islands in the South China Sea, a quarrel which could deteriorate shortly with the expected start of oil exploration in the area. China and Vietnam restored ’normal’ relations in November after years of tension, but the rapprochement was quickly soured by territorial disputes on land and at sea. The banking system is in urgent need of reform and a series of draft laws relating to business – including those on bankruptcy, the resolution of contract disputes and the promotion of domestic investment – are queueing up to be passed by the National Assembly at its next meeting in December. Beijing periodically sends ships into areas that Vietnam says are in its territorial waters, including zones set aside for oil exploration. In addition, the unsettled Ukrainian-Russian territorial dispute over Crimea could threaten current contracts, which have been negotiated with Ukrainian authorities. British Gas said last year it had discussed joint offshore exploration close to the disputed waters with YPF, Argentina’s state-owned oil company. Britain and Argentina are to hold talks in July on joint oil exploration in waters surrounding the Falkland Islands, two years after a previous round of oil talks collapsed. Both countries have awarded oil exploration contracts to US oil companies in disputed waters. One of the law’s ostensible purposes is to encourage compromises over the exploitation of maritime resources, even among countries with unresolved disputes.
Figure 1: Example for an ERSS-generated focused summary for d357 (context shown on top)
No pronominal resolution: To avoid dangling pronouns in summaries, this feature ranks elements low that have unresolvable pronouns in the enclosing sentence. After all clusters have been covered, we iterate through them again, choosing the second-best cluster representative, and this process is repeated until the size limit (250 words for DUC 2005) has been reached. Postprocessing. To smoothen the generated summary, we perform a few postprocessing tasks. Besides the removal of duplicate (sub-)sentences, we check for dangling pronouns in the generated summary extract. If such a pronoun occurs, we obtain the corresponding nonpronomial entity from the computed coreference chains and replace it in the summary output. A further improvement is the replacement of repeatedly occuring complex names. To do this, we try to replace the long name by a short form using information from the named entity transducer or, if no NE information is available, by deleting a prefix from the noun phrase, leaving only one word to denote the entity after its first full reference. An example for an ERSS-generated summary can be seen in Figure 1.
3
Evaluation
We analysed the performance of our system based on the automatic and manual evaluations provided by NIST
Rank
year’s competition, we labeled FirstPersons, Persons, Locations, Dates, Money, Abbreviations and Acronyms, as well as Addresses as bearing specific information.
1 2 3 4 5 6 7 8 9 10 11 12 13 14 15 16 17 18 19 20 21 22 23 24 25 26 27 28 29 30 31 32
ROUGE-1 ranks ROUGE-2 ranks ROUGE-SU4 ranks BE ranks
1 2 3 4 5 6 7 8 9 10 11 12 13 14 15 16 17 18 19 20 21 22 23 24 25 26 27 28 29 30 31 32 System ID
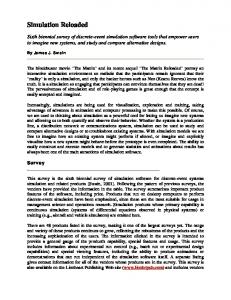
Figure 2: System ranks based on ROUGE and BE scores for all systems (not including human summaries)
(Dang, 2005), as well as additional analyses using the ROUGE (Section 3.1), Pyramid (Section 3.2), and Basic Element (Section 3.3) methods. We were particularly interested in the correlations between these different measures, i.e., how well they track each other. If two measures give significantly different results, this could be an indication for a better discrimination between the performance of different systems, something that is hard to obtain using only ROUGE. Table 1 gives an overview over the results given by the different evaluation measures. As can be seen, there is a striking difference in our system’s performance when evaluated with the different ROUGE scores and especially the two new measures Pyramids and Basic Elements. Figures 2 and 3 in particular show the divergence of the results: While most systems score very similar un-
Measure ROUGE-1 ROUGE-2 ROUGE-SU4 Basic Elements Linguistic quality unscaled Responsiveness unscaled Grammaticality quality Non-redundancy quality Referential clarity quality Focus quality Structure and Coherence quality Pyramids Auto-Pyramids
ERSS 0.36 0.06 0.12 0.027 3.17 2.44 3.56 4.24 2.80 3.00 2.22 0.14 0.057
mean 0.33 0.06 0.11 0.022 3.26 2.40 3.77 4.41 2.99 3.15 2.18 0.16 0.059
best / worst 0.38 / 0.18 0.07 / 0.03 0.13 / 0.06 0.033 / 0.006 3.97 / 2.86 2.78 / 1.38 4.34 / 2.60 4.74 / 3.96 4.58 / 2.16 4.50 / 2.38 4.00 / 1.60 0.21 / 0.06 0.082 / 0.028
rank 11/32 15/32 13/32 9/32 21/32 14/32 25/32 27/32 21/32 21/32 10/32 18/25 16/25
Table 1: Evaluation results overview for ERSS 2005 (System ID #25) der the different measures, they significantly disagree for ERSS (system no. 25). We attempt to analyse this effect in more detail below. ROUGE
Like in the previous year, NIST evaluated all systems using the ROUGE metric (Lin and Hovy, 2003; Lin, 2004). As can be seen in Table 1, ERSS performs roughly in the upper third of all systems when evaluating the ROUGE-1 score and average when considering the ROUGE-2/-SU4 score. This is consistent with the results we observed in last year’s DUC competition (Bergler et al., 2004). 3.2
Pyramids
The Pyramid method (Nenkova and Passonneau, 2004) is a new manual evaluation strategy that was designed to overcome some of the problems with the ROUGE method, especially the inability to deal with abstracting summaries. Figure 3 shows the results for the systems that participated in the Pyramid evaluation. The authors of the Pyramid method claim (Nenkova and Passonneau, 2004) that there is no significant correlation (using the Spearman rank-coefficient) between the ranks computed by the Pyramid score and an n-gram match (i.e., ROUGE). We were interested whether this claim holds for the results of the DUC 2005 competition, where the authors from 25 of the 32 systems also participated in the manual annotation of Pyramids. To compute the correlation, we ranked the 25 systems based on their various ROUGE scores and their Pyramid score. For each combination of a specific rank obtained through a ROUGE score we computed the Spearman correlation with its Pyramid-based rank. Table 2 gives the overall correlation of the different measures.2 2 The results for the correlation with ROUGE match those reported in (Passonneau et al., 2005).
Rank
3.1
ROUGE-1 ranks ROUGE-2 ranks ROUGE-SU4 ranks PYRAMIDS ranks BE ranks
1 2 3 4 5 6 7 8 9 10 11 12 13 14 15 16 17 18 19 20 21 22 23 24 25 1
3
4
6
7 10 11 12 13 14 15 16 17 19 20 21 23 24 25 26 27 28 30 31 32 System ID
Figure 3: System ranks based on ROUGE and Pyramid scores (systems participating in Pyramid evaluation only) There seems to be a correlation, especially when using the ROUGE-2 score, between the ranks obtained by using the different measures, unlike the results reported in (Nenkova and Passonneau, 2004), where correlations reached a maximum of only 0.35. However, when examining an individual system, this does not hold: We also computed the Spearman correlation for each system by ranking all clusters across systems with both the ROUGE and the Pyramid scores. These results are shown in Figure 4. As can be seen, the Spearman scores differ wildly, from systems with very good correlations (around 0.8) to system with very low or even negative correlation. Table 3 contains the Spearman correlations for our system. The overall conclusion we draw from these results is that, while the Pyramid score does not give more information than ROUGE when ranking systems with respect to each other, for an individual system this does not necessarily hold. The case where these measures disagree is actually the most interesting one, as this potentially indicates a better (or at least different) discrimination be-
1 0.9 0.8
PYRAMIDS - ROUGE-1 PYRAMIDS - ROUGE-2 PYRAMIDS - ROUGE-SU4 PYRAMIDS - AUTO-PYRAMIDS 0.05-alpha-risk
ROUGE-1 ROUGE-2 ROUGE-SU4 Basic Elements Auto-Pyramid
0.7 0.6 0.5 Spearman Value
Metric
0.4 0.3
average correlation with Pyramid score for ERSS modified corrected auto 0.720301 0.555639 0.458647 0.600000 0.196241 0.099248 0.627068 0.287970 0.305263 0.428571 0.160150 -0.058647 0.500752 0.363158 1.000000
0.2
Table 3: Average Spearman correlation between different ROUGE and Pyramid scores for ERSS only
0.1 0 -0.1 -0.2 -0.3 -0.4
1
3
4
6
7 10 11 12 13 14 15 16 17 19 20 21 23 24 25 26 27 28 30 31 32 System ID
Figure 4: Spearman rank correlation between different ROUGE and the manual and automatic Pyramid scores Metric ROUGE-1 ROUGE-2 ROUGE-SU4 Basic Elements Responsiveness Auto-Pyramid
average correlation with Pyramid score modified corrected auto 0.823077 0.845385 0.703077 0.895385 0.896923 0.704615 0.858462 0.874615 0.674615 0.833846 0.850769 0.690000 0.814615 0.830000 0.727692 0.826154 0.816923 1.000000
Table 2: Average Spearman correlation between the Pyramid score and different ROUGE, BE, Responsiveness, and the Auto-Pyramid scores tween systems. Thus, we were interested in finding out precisely why our system was ranked differently by these metrics: can the Pyramid method “see” something that the ROUGE measure cannot, or is the difference simply an artifact introduced by the method itself? 3.2.1 Corrected Pyramids We investigated the difference in scoring between the Pyramid and the ROUGE measure for our system, and found that in the case where summaries received greatly different scores this was due to inconsistent manual annotations of the SCUs. For example, for cluster d324 system 11 received a score from one annotator of 0.2679 and from other of 0.5446.3 When we corrected such discrepancies for our system’s annotations, the Pyramid score again came closer to the ROUGE scores (averaged over all systems). So far, we only corrected for 4 of our summaries the annotations (.pan files), where we found agreement of content expressed in our summaries with some SCUs of the pyramid that the annotators had overlooked or inter3 Unfortunately, only a few clusters have more than one manual annotation, so the inter-annotator agreement cannot be reliably determined.
preted as not being exactly the same. Because all systems scored very close to each other, this small change resulted in a noticeable change of correlation when averaged over all system, as can be seen in Table 2. When regarding only our system, however, the change is even more dramatic, but the correlation with the corrected Pyramids becomes worse, as can be seen in Table 3. This again could indicate that manual Pyramids measure something quite different from ROUGE, BE, or the automatically computed Pyramids, however, what precisely we have not been able to determine. As our system only generates sentence extracts (with only very light post-processing) and no abstraction at all, we would expect similar performance across abstraction-sensitive (Pyramids, BE) and abstraction-oblivious measures (ROUGE, partially AutoPyramids). 3.2.2 Automatically Generated Pyramids Given the high amount of work needed for manual Pyramid annotation, the possibility of inconsistent annotations across assessors, and the additional problem of inter-annotator disagreements, a method for the automatic creation of Pyramid annotations is highly desirable. A solution is proposed in (Fuentes et al., 2005): the automatic peer annotator AutoPan,4 which can automatically create a Pyramid annotation file for a given summary. We evaluated the results of the AutoPan script for all systems that also participated in the manual Pyramid evaluation. Table 1 shows the performance of our system based on the automatically created Pyramid annotations. Additionally, we computed the correlation of the AutoPyramid scores with several ROUGE, the BE, the official (modified) Pyramids, and the Responsiveness measures. As can bee seen in Table 2, there is a significant correlation (around 70%) between the ranking obtained through the automatically created Pyramid annotations and the other measures, especially between the automatically and the manually created ones at 83%. However, like with the manual Pyramids examined above, this does not indicate that the scores for each system correlate equally well; for some systems, there is a very high cor4 Available at http://www.lsi.upc.edu/~egonzalez/ autopan.html.
3.2.3 Pyramid Conclusions As the above evaluations show, the Pyramid measure behaves quite differently from either the ROUGE or BE measures. This is in principle a useful property, as another metric that correlates highly with an existing metric would be redundant. However, as practically all systems (and especially our system ERSS) do not implement any significant amount of abstraction, one would expect systems to rank similar to each other given the same model summaries. This is not the case with the Pyramid ranking, neither averaged for all systems nor within a system. As such, we were not able to determine whether the Pyramid measure actually delivers more (or different) information than, say, BE or the Auto-Pyramids, or if the different results are due to some kind of artifact introduced by the Pyramid method itself. Finally, it remains unclear to us whether the Pyramid method actually provides an accurate measure for the quality of a focused summary as generated for DUC 2005: The Pyramid score favours SCUs that appear in several model summaries, essentially giving preference to the majority information across the model summaries. This score does not measure how important or relevant such an SCU is in actually answering a question from the context. One might argue that information important for a certain question must also appear in more model summaries, but this is a rather indirect measure of how relevant an SCU is with respect to the context questions. 3.3
Basic Elements
Basic Elements (BE) are a new automatic evaluation framework proposed by (Hovy et al., 2005). We evaluated our system with BE5 as well and examined correlations with the other automated methods. Table 4 shows the correlations between the BE scores for all systems and the Pyramid, Responsiveness, and several ROUGE scores. Here, we computed the correlation between all systems and clusters, except for the 5 Here,
-s -l.
we used BE version 1.1 with the parameters -b -f
ROUGE-1 ROUGE-2 ROUGE-SU4 Responsiveness Pyramids
average correlation with BE score 0.859753 0.923639 0.888105 0.853327 0.833846
Table 4: Average Spearman correlation between the BE score and the ROUGE, Responsiveness, and Pyramid (for participating systems only) scores 1 0.9 0.8 0.7 Spearman Value
relation, for others, especially ERSS, the correlation is not significant, reaching as low as 0.09 for ROUGE-2, as shown in Table 3. Thus, while the current method for automatically creating Pyramids gives a good correlation, on average, with the manual ones for evaluating the performance of a set of systems, this is not necessarily true for the evaluation of a single system. A graphical illustration of this gives Figure 4, where we plot the Spearman correlation for each system between ROUGE, the automatically, and the manually created Pyramid annotations: Here, several systems are well below the 0.05 α-risk.
0.6 0.5 0.4 0.3 0.2 0.1 0
BE - ROUGE-1 BE - ROUGE-2 BE - ROUGE-SU4 0.05-alpha-risk 1 2 3 4 5 6 7 8 9 10 11 12 13 14 15 16 17 18 19 20 21 22 23 24 25 26 27 28 29 30 31 32 System ID
Figure 5: Correlation of BE and ROUGE scores for all systems Pyramid correlation, which includes only the 25 systems and 20 clusters that participated in the Pyramid experiment. Also, unlike (Hovy et al., 2005), we do not include the manually created human summaries in the evaluation. Compared to the results reported in the workshop version of (Hovy et al., 2005), this results in a lower correlation with the Responsiveness score (0.853 vs. 0.928), similar correlation with the ROUGE-2 score (0.923 vs. 0.965), but a much higher correlation with the Pyramid score (0.834 vs. 0.402). Like for the Pyramid method, we wanted to find out how stable the correlation between the BE and the ROUGE method for each system is. Figure 5 shows a Spearman coefficient well above the 0.05 α-risk for all systems.
ROUGE-1 ROUGE-2 ROUGE-SU4
average correlation with BE score for ERSS 0.827179 0.893541 0.887155
Table 5: Average Spearman correlation between different ROUGE and the BE score for ERSS only As can be seen from Table 1, BE score our system higher than all other measures (rank 9/32), including the
1
0.9
Configuration general/specific original general/specific reversed general only specific only w/o weighting context
BE - ROUGE-1 BE - ROUGE-2 BE - ROUGE-SU4 0.05-alpha-risk
0.8
0.7
ROUGE-2 0.05304 0.04950 0.05166 0.05088 0.05953
ROUGE-SU4 0.10318 0.10107 0.10295 0.10131 0.12878
Spearman Value
0.6
Table 6: Average ROUGE scores for different settings
0.5
0.4
0.3
0.2
0.1
0 1 697 698 698 687 679 659 635 634 447 444 434 432 434 433 436 421 427 424 418 406 402 400 402 409 392 391 394 388 384 386 370 376 377 363 366 357 359 359 340 343 341 346 334 337 324 323 311 317 301 30
Document Cluster ID
Figure 6: Correlation of different ROUGE and BE system ranks per document cluster for ERSS ROUGE-1 score. We were interested whether the difference in ranking distributes evenly over all clusters, or is rather caused by a large difference within a few clusters. The results can be seen in Figure 6, where we ranked all systems within each cluster with the different measures. Except for cluster 359, all measures perform within the same range, with a Spearman correlation well above the 0.05 α-risk. Overall, BE receive the highest correlation of the alternative evaluation methods when regarding only the correlation of our system, as can be seen in Table 5. Thus, at least for our system, BE provide a much more stable evaluation framework then either the automatic or manual Pyramid method (see Figure 4). 3.4
Evaluating Granularity and Context-Sensitiveness
DUC 2005 introduced two significant new features: a complex context and a granularity setting. We were interested in how much these features influence the results of our summarization system. In order to evaluate this, we changed the prescribed granularity setting (only one granularity, specific or general, was given for each cluster, never both) and changed the weighting scheme for information appearing in the context (see Section 2.3). Table 6 shows the results evaluated with ROUGE-2 and ROUGE-SU4 for (a) the original granularity settings,6 with (b) reversed setting, i.e., creating a “specific” summary when a “general” was requested and vice versa, (c) general or (d) specific summaries only, and finally (e) with the original granularity, but ignoring the context. Much to our surprise, there was almost no change in the ROUGE score of the resulting summaries. 6 These
scores differ slightly from the submitted run due to some changes in the system.
Regarding the granularity, this is due to the small influence named entities have on the overall summary generation: this parameter was too unclearly specified in order for us to risk big differences in system output based on an essentially random value. The context-sensitiveness of our system is still under investigation; the experiment performed above still included the context questions in the system, thereby influencing the cross-document coreference resolution and the resulting clusters. Thus, we need to remove the context information completely in order to determine its influence on the summarization process. This evaluation is still ongoing.
4
Discussion and Conclusions
While the new task presented in DUC 2005 has potentially interesting practical applications, its evaluation remains difficult. 4.1
Why a Context?
To begin with, the basic assumption that the introduction of a context leads to better (or even different) summaries for a certain (essentially unknown) task remains unproven, as no summaries have been generated based on the same source texts, but without a context. Thus, how much precisely a context changes the structure or content of a summary remains unknown. A systematic evaluation of context-sensitiveness ideally would include the generation of summaries for different context sizes, from empty to full context. As can be seen from our (still preliminary) evaluations of context-sensitiveness, the assumption that a summary changes significantly when a context is introduced cannot be taken for granted. One should remember the experience with the “context task” within the TREC-10 competition, where the evaluation showed that there is no difference whatsoever between a system’s ability to answer questions with or without a context (Winikoff and Kosseim, 2004). As a consequence, the “context task” was dropped from TREC entirely. 4.2
Why a Granularity?
Also, the purpose of the context attribute for generating “specific” or “general” summaries remains unclear. No specific guidelines have been given as to what precisely constitutes a general/specific summary, no indica-
tion of the purpose or application of this feature has been given, and it has been basically ignored in all evaluations, making its introduction not just useless, but potentially harming the performed evaluations by conflating summaries generated under different conditions within the same score. As every system was asked to generate either a specific or a general summary for a cluster (but never both), a precise evaluation of this parameter’s influence upon the participating summarization systems is impossible. Fortunately, it was decided to drop “granularity” from the DUC 2006 task. On the other hand, this will make it more difficult to compare the 2006 results with those of this year’s competition.
Mark Hepple. 2000. Independence and commitment: Assumptions for rapid training and execution of rulebased pos taggers. In Proceedings of the 38th Annual Meeting of the Association for Computational Linguistics (ACL-2000), Hong Kong, October.
Acknowledgments. The authors would like to thank Thomas Moschny from the IPD, Universit¨at Karlsruhe, for his help in porting the ERSS system to the institute’s Itanium cluster.
Chin-Yew Lin. 2004. ROUGE: a Package for Automatic Evaluation of Summaries. In Proceedings of the Workshop on Text Summarization Branches Out (WAS 2004), Barcelona, Spain, July 25–26. http: //www.isi.edu/~cyl/ROUGE/.
References
Ani Nenkova and Rebecca J. Passonneau. 2004. Evaluating Content Selection in Summarization: The Pyramid Method. In HLT/NAACL, pages 145–152.
Sabine Bergler, Ren´e Witte, Michelle Khalife, Zhuoyan Li, and Frank Rudzicz. 2003. Using Knowledgepoor Coreference Resolution for Text Summarization. In Proceedings of the HLT/NAACL Workshop on Text Summarization (DUC 2003). http: Document Understanding Conference. //www-nlpir.nist.gov/projects/duc/pubs/ 2003final.papers/concordia.final.pdf. Sabine Bergler, Ren´e Witte, Zhuoyan Li, Michelle Khalife, Yunyu Chen, Monia Doandes, and Alina Andreevskaia. 2004. Multi-ERSS and ERSS 2004. In Proceedings of the HLT/NAACL Workshop on Text Summarization (DUC 2004). Document Understanding Conference. http://www-nlpir.nist.gov/projects/duc/ pubs/2004papers/concordia.witte.pdf. H. Cunningham, D. Maynard, K. Bontcheva, and V. Tablan. 2002. GATE: A framework and graphical development environment for robust NLP tools and applications. In Proceedings of the 40th Anniversary Meeting of the Association for Computational Linguistics. http://gate.ac.uk. H. T. Dang. 2005. Overview of DUC 2005. In Proceedings of the HLT/EMNLP Workshop on Text Summarization DUC 2005 (NIS, 2005). http://duc.nist. gov. M. Fuentes, E. Gonz`alez, D. Ferr´es, and H. Rodr´ıguez. 2005. QASUM-TALP at DUC 2005 Automatically Evaluated with a Pyramid based Metric. In Proceedings of the HLT/EMNLP Workshop on Text Summarization DUC 2005 (NIS, 2005). http://duc.nist. gov.
E. Hovy, C. Lin, and L. Zhou. 2005. Evaluating DUC 2005 using Basic Elements. In Proceedings of the HLT/EMNLP Workshop on Text Summarization DUC 2005 (NIS, 2005). http://duc.nist.gov. Chin-Yew Lin and E. H. Hovy. 2003. Automatic evaluation of summaries using n-gram co-occurrence statistics. In Proceedings of the 2003 Human Language Technology Conference HLT/NAACL 2003, Edmonton, Canada, May 27 - June 1.
NIST. 2004. DUC 2004, Boston, MA, USA, May 6-7. http://duc.nist.gov/pubs.html#2004. NIST. 2005. DUC 2005, Vancouver, BC, Canada, October 9-10. http://duc.nist.gov. R. J. Passonneau, A. Nenkova, K. McKeown, and S. Sigleman. 2005. Applying the Pyramid Method in DUC 2005. In Proceedings of the HLT/EMNLP Workshop on Text Summarization DUC 2005 (NIS, 2005). http://duc.nist.gov. S. Winikoff and L. Kosseim. 2004. Is Context Actually Helpful? Preliminary Experiments in Contextual Question Answering. In Proceedings of the Workshop Computational Linguistics in the North-East (CLiNE 2004), pages 64–66, Montreal, Canada, August. CLiNE 2004. Ren´e Witte and Sabine Bergler. 2003. Fuzzy Coreference Resolution for Summarization. In Proceedings of 2003 International Symposium on Reference Resolution and Its Applications to Question Answering and Summarization (ARQAS), pages 43– 50, Venice, Italy, June 23–24. Universit`a Ca’ Foscari. http://www.rene-witte.net/downloads/ wittebergler_fuzzycoref.pdf. Ren´e Witte. 2002. Architektur von Fuzzy-Informationssystemen. BoD. ISBN 3-8311-4149-5.