ESTABLISHING BACKGROUND ARSENIC IN SOIL OF THE URBANIZED SAN FRANCISCO BAY REGION
A thesis submitted to the faculty of San Francisco State University In partial fulfillment of The Requirements for The Degree
Master of Science In Geosciences
By Dylan Jacques Duvergé San Francisco, California December 2011
Contact:
[email protected]
Copyright by Dylan Jacques Duvergé 2011
Contact:
[email protected]
ACKNOWLEDGEMENT
First and foremost, I would like to thank my advisor, Dr. Jason Gurdak, for his receptiveness, thoughtful guidance and support. I consider it an honor to have worked with such a respected professional, and I admire his ingenuity and commitment to this research. I would also like to thank my thesis committee, Dr. Jerry Davis and Mary Rose Cassa for their unique perspectives, and invaluable insight. I am immensely thankful for my friends and family, who have provided moral support throughout my studies; as well as the workload flexibility and tuition assistance offered by my employer, Environmental Science Associates.
v
TABLE OF CONTENTS Page LIST OF TABLES……..……….…………………..…………………………………..viii LIST OF FIGURES……..……….…………………..…………………………………...ix LIST OF APPENDICES..……….…………...……..…………………………………....ix 1.0
2.0
3.0
4.0
Contact:
[email protected]
INTRODUCTION AND BACKGROUND .............................................................. 1 1.1
Introduction .................................................................................................... 1
1.2
Definitions ..................................................................................................... 2
1.3
Arsenic Variability in Soil and Rock ............................................................. 4
1.4
Geologic Sources of Elevated Arsenic .......................................................... 6
1.5
Anthropogenic Sources of Arsenic ................................................................ 8
1.6
Arsenic Background Studies ........................................................................ 11
1.7
Problem Statement and Purpose .................................................................. 15
STUDY AREA ........................................................................................................ 19 2.1
Study Area ................................................................................................... 19
2.2
Regional Geologic Setting ........................................................................... 19
2.3
Land Use Setting .......................................................................................... 21
METHODS .............................................................................................................. 23 3.1
Source Data .................................................................................................. 23
3.2
Site Selection Criteria and Database Compilation ....................................... 25
3.3
Assessment of Site Data, Treatment of Censored Data, and Identification of Outliers......................................................................................................... 29
3.4
Summary Statistics and Statistical Tests ..................................................... 30
3.5
Limitations and Assumptions ...................................................................... 31
RESULTS ................................................................................................................ 34 vi
5.0
6.0
4.1
Summary of the Database ............................................................................ 34
4.2
Summary of Background Arsenic Concentrations by Site .......................... 39
4.3
Arsenic Concentrations by Sample Depth ................................................... 44
4.4
Statistics by Soil Type and Significance Tests ............................................ 47
DISCUSSION AND CONCLUSION ..................................................................... 50 5.1
Summary of Results ..................................................................................... 50
5.2
Other Potential Sources of Variability in the Regional Background ........... 51
5.3
Comparison of Findings with Other Background Studies ........................... 53
REFERENCES ........................................................................................................ 58
vii
Contact:
[email protected]
LIST OF TABLES Page Table 1 – Worldwide mean and range of arsenic for major rock types (mg/kg) ................ 5 Table 2 – Scope and findings for existing background studies of arsenic ........................ 12 Table 3 - Explanation of database fields by name, type and source ................................. 27 Table 4 – Summary of the 77 sites from the Geotracker database, sorted by county and soil type ............................................................................................................................. 35 Table 5 – Statistics by soil unit and means comparison using Tukey test ........................ 47
viii
Contact:
[email protected]
LIST OF FIGURES Page Figure 1 – Arsenic consumption in the United States by industrial sector (1900-2000) .... 9 Figure 2 – Geologic map of the San Francisco Bay Area................................................. 20 Figure 3 – Representative cross section of land use and geology and the relation to total measured arsenic concentrations....................................................................................... 22 Figure 4 – Location of the 77 selected sites selected from the Geotracker database........ 36 Figure 5 – Distribution of arsenic concentrations, including a histogram, a quantile box plot, and a normal quantile plot ........................................................................................ 38 Figure 6 – Normal quantile plot, box plot, and histogram of site medians....................... 40 Figure 7 – Normal quantile plot, box plot, and histogram of the natural log of site medians ............................................................................................................................. 41 Figure 8 – Map of median arsenic by site ......................................................................... 43 Figure 9 – Univariate plot of arsenic concentrations vs. sampling depth (surface and subsurface) ........................................................................................................................ 45 Figure 10 - Univariate plot of arsenic concentrations vs. sampling depth (shallow and deep) .................................................................................................................................. 46 Figure 11 – Distribution of arsenic concentrations by soil type and Tukey-Kramer HSD comparison of means ........................................................................................................ 49
LIST OF APPENDICIES
Appendix A……..…………………………………..……………………………………63
ix
Contact:
[email protected]
1
1.0 INTRODUCTION AND BACKGROUND 1.1
Introduction
The San Francisco Bay Area (Bay Area) has an enormous natural and cultural diversity where concern for environmental quality permeates regional and local land use planning decisions on a daily basis. Among the broad spectrum of environmental problems is the potential for contaminated soil and groundwater to adversely affect human health. Arsenic—recognized as a potential contaminant by local, state and federal environmental agencies—is a trace metal that is present in low levels in all environmental media (soil and rock, water, and air). Over our lifetimes, we ingest trace levels of arsenic that are naturally occurring in food, drinking water, and (to a lesser extent) air without suffering adverse health effects. However, long-term exposure to elevated levels of inorganic arsenic is known to decrease production of red and white blood cells, cause damage to blood vessels, and lead to characteristic effects such as changes in skin pigmentation, appearance of warts or bruises, skin irritation, and increased risk of skin and other cancers (ASTDR, 2009). In the Bay Area, arsenic is present both as a natural component of soil and rock, as well as a byproduct of human activities such as historical pesticide applications and the presence of copper chromated arsenate- (CCA) treated wood. In this context, environmental investigators face the difficult challenge of determining whether arsenic detections at a site reflect the local soil type or anthropogenic inputs, particularly when detected in the upper range of arsenic concentrations thought to occur naturally. By screening from an extensive database of soil sampling results that have been submitted to regulatory agencies in the course of environmental cleanup activities, this thesis aims to estimate background arsenic concentrations in soil around the Bay Area, and investigate whether spatial variability in arsenic concentrations can be at least
2
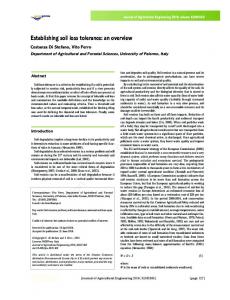
partially explained by variations in soil type. Estimates of the mean and range for trace metals have been developed nationally (7.2, |z|) of 0.40. Because the observed significance probability is not less than 0.05, there is no significant difference between surface and subsurface soil concentrations at the 95% confidence level. A univariate plot of arsenic concentrations for shallow (≤ 1.8 meters) vs. deep (> 1.8 meters) samples was created (Figure 10), and the non-parametric Wilcoxon test resulted in a significance probability
45
Figure 9 – Univariate plot of arsenic concentrations vs. sampling depth (surface and subsurface) Wilcoxon / Kruskal-Wallis Test (Rank Sums)
20
Level Subsurface Surface
Count Score Sum Score Mean 811 492638 607.445 415 259514 625.334
(Mean-Mean0)/Std0 -0.837 0.837
2-Sample Test, Normal Approximation S 259513.5
Z 0.83711
Prob>|Z| 0.4025
ARSENIC (PPM)
A Prob>Z value of 0.05 or less indicates groups are significantly different
10
N = 415 N = 811
0 Subsurface
Surface DEPTH_CLASS
46
Figure 10 - Univariate plot of arsenic concentrations vs. sampling depth (shallow and deep) Wilcoxon / Kruskal-Wallis Test (Rank Sums) Level Deep Shallow
20
Count Score Sum Score Mean (Mean-Mean0)/Std0 345 207186 600.538 -0.155 860 519430 603.988 0.155
2-Sample Test, Normal Approximation S 207185.5
Z -0.15549
Prob>|Z| 0.8764
ARSENIC
A Prob>Z value of 0.05 or less indicates groups are significantly different
10
N = 345
N = 860
0 Deep
> 1.8 meters (2 feet)
Shallow DEPTH
|z|) of 0.88, likewise indicating there is no significant difference in arsenic concentrations between shallow and deep soil samples (95% confidence level). 4.4
Statistics by Soil Type and Significance Tests
The 77 sites are underlain by several geologic units, including Holocene bay mud, Holocene alluvium, Pleistocene alluvium, other Quaternary units, and Franciscan Complex bedrock (Table 4). Because only one site is located within the Franciscan Complex, it was excluded from this analysis. Eleven sites are underlain by several different Quaternary units that are not alluvial in origin. These sites were either underlain by dune sands, coastal/marine terrace deposits, or colluvium, and were grouped together as one category. Table 5 lists summary statistics for arsenic concentrations by soil unit. An ANOVA was performed to test whether grouping by soil type can explain some of the variation in background arsenic concentrations. An ANOVA was considered appropriate because the site medians follow a normal distribution, and because variances are equal. The F Ratio obtained from the ANOVA (3.85) indicates that the model fits the data at a 95% confidence level (probability > F is 0.013), and that group means are statistically different from the overall response mean. Table 5 – Statistics by soil unit and means comparison using Tukey test Soil Type Holocene alluvium Holocene bay mud Pleistocene alluvium other Quaternary unit
Number Mean
Min Median Max Tukey (mg/kg) (mg/kg) (mg/kg) test*
27
5.10
1.62
5.25
11
14
3.97
1.89
3.58
6.94
AB
24
3.65
0.61
3.35
8.86
B
11
3.30
1.34
3.47
6.25
B
* Levels not connected by same letter are significantly different
A
48
To make multiple comparisons between soil types, a Tukey test was performed, as shown in Figure 11 and Table 5. The comparison circles plot on the right side of Figure 10 is a visual representation of group mean comparisons. Circles for means that are significantly different either do not intersect or intersect slightly so that the outside angle of intersection is less than 90 degrees. If the circles intersect by an angle of more than 90 degrees or if they are nested, the means are not significantly different. Group means for Holocene alluvium, Holocene bay mud, Pleistocene alluvium, and other Quaternary units were 5.10 mg/kg, 3.97 mg/kg, 3.65 mg/kg, and 3.30 mg/kg respectively. According the Tukey test, Holocene alluvium has a group mean that is significantly higher than both Pleistocene alluvium and other Quaternary units, but there is no significant difference between Holocene bay mud and any other unit. In addition, there is also no statistically significant difference between group means of Pleistocene alluvium and other Quaternary units. The R2 value of the ANOVA model is 0.14, indicating the groupings explains 14 percent of the overall variability of the sample group.
49
Figure 11 – Distribution of arsenic concentrations by soil type and Tukey-Kramer HSD comparison of means 12 11 10 9 8
6 5 4 3 2
AGE-LITH_GEN
Pliestocene Alluvium
Other Quaternary Unit
0
Holocene Bay Mud
1
Holocene Alluvium
Median
7
All Pairs Tukey-Kramer 0.05
50
5.0 DISCUSSION AND CONCLUSION 5.1
Summary of Results
The results of this study indicate that background arsenic concentrations within the urbanized San Francisco Bay Region are lower than many of the estimates found in the literature, and are only weakly correlated with the underlying Quaternary geologic unit. Based on the data screened from Geotracker, the mean and upper estimate (the 99th percentile) for the regional background level of arsenic is 4.61 mg/kg and 11.00 mg/kg, respectively. In increasing order, the mean concentration of site medians grouped by soil type are 3.30 mg/kg (“other” Quaternary units), 3.65 mg/kg (Pleistocene alluvium), 3.97 mg/kg (Holocene bay mud), and 5.10 mg/kg (Holocene alluvium). Arsenic concentrations within Holocene alluvium were found to be statistically greater than Pleistocene alluvium and “other” Quaternary units; but no statistically significant difference was found between Holocene Bay Mud, Pleistocene alluvium, and “other” Quaternary units. The ANOVA and Tukey test revealed that the differences between group means are not pronounced, accounting for only 14 percent of the variation in median values across the 77 sites included in this study. While it was anticipated that non-point anthropogenic sources of arsenic might result in higher concentrations of arsenic within surface samples, there was no statistically significant difference found between surface and subsurface soil samples. Further accounting for the soil mixing and reworking that takes place in urban settings, there was likewise no statistically significant difference found between shallow (≤ 1.8 meters) and deep (> 1.8 meters) soil samples. These results provide further evidence that the anthropogenic influence on the sample sites as it relates to arsenic is minimal.
51
The relative differences in mean arsenic concentrations across the four soil types, despite being subtle, correlate well with the general expectation that finer grained soils would result in elevated arsenic concentrations relative to coarse grained soils (NAVFAC, 2002; Alloway, 1990). Helley et al. (1979) explains that Pleistocene alluvium, which extends out from the base of hills in the Bay Area, is generally a coarsergrained unit than Holocene alluvium on the bay plains. Further, the “other” Quaternary units—predominantly composed of dune sands, colluvium, and shallow marine terrace deposits—had the lowest mean arsenic concentration. These “other” units are generally clean sandy units, and/or coarse-grained as a result of their depositional environment. This is generally consistent with finding made by Gustavvson et al. (2001), who associated the Nebraska Sand Hills, the largest dune field in the Western Hemisphere with low concentrations of arsenic. 5.2
Other Potential Sources of Variability in the Regional Background
As explained in Chapter 2, there are a number of other factors besides Quaternary soil type that likely contribute to regional variability in background arsenic concentrations, including the geologic source material for the Quaternary soils, the anthropogenic background, and/or ongoing geochemical processes (e.g., weathering, leaching, or enrichment). Localized areas in the hills and mountains of the region may produce unusually high concentrations of arsenic due to favorable geologic environments such as ore deposits (i.e. former mercury mines) and presence of organic-rich shales or coal. It is reasonable to expect that depositional settings sourced from these regions may result in naturally elevated concentrations of arsenic within Quaternary-age sediments. However, there are several limitations, both in this study’s dataset and in the existing geologic environment, that limit the ability to test this idea. Firstly, there are inherent difficulties in associating alluvial soils to specific bedrock sources, especially
52
when the watershed is large and geologically complex. The influence of arsenic-rich geologic environments would become decreasingly detectable as a greater portion of the watershed is underlain by other bedrock units (i.e., distance from source). Secondly, while the general locations of former mercury and coal mines are known, shale and/or mudstones often occur in repeating sequences along with other sedimentary lithologies (e.g. sandstone). These sequences are frequently mapped together in the same formation, making it difficult to reliably estimate the portion of the watershed underlain by a specific lithology. Lastly, rather than being concentrated in one geographic location, shale-rich lithologies are fairly widespread throughout the Bay Area, making it unlikely a clear geographic pattern would be detected. These limitations, along with the low geographic resolution of the data make correlations of high arsenic concentrations within Quaternary soils to specific source rocks speculative at best. If there were a strong source-rock influence on arsenic concentrations in Quaternary soils, it would be expected that sites with high arsenic values would be clustered and coincident with similar source regions. As discussed in Section 4.2 and shown in Figure 8, while the data in this study appears slightly clustered, it is also possible that it is the result of random chance. The lack of evidence for strong clustering or a striking geographic pattern may have more to do with the geographically sparse nature of the dataset than the absence of a source rock influence. The two general observations of 1) low median values along the northern end of the San Francisco Peninsula and the San Mateo and Santa Cruz County coastlines, and 2) high values in the eastern and southern Bay Area beg for a geologic explanation. Further study aimed at greater understanding of the relationship between arsenic concentrations found in Quaternary soils, and the geologic characteristics of their source regions would be valuable in further explaining natural variability in arsenic, and could possibly lead to the development of predictive tools.
53
An additional consideration which might influence the regional variability in background arsenic concentrations is broad land-use patterns and associated non-point sources of anthropogenic arsenic. It is important to recognize that regional land-use patterns often coincide with major changes in the underlying soil type. As illustrated in Figure 3, Holocene alluvium and bay muds underlie some of the most intensely developed urban and industrial areas, whereas Pleistocene alluvium more often underlies low-density residential areas. In addition, Holocene alluvium commonly supports prime agricultural soils and is likely to have supported agricultural uses prior to urban development, particularly in the eastern and southern Bay Area. Despite findings of no significant difference between surface and subsurface samples, it is difficult to fully dismiss the possibility that higher arsenic concentrations within Holocene alluvium are associated with concurrent variations in the anthropogenic background (e.g., the general type, intensity, and history of land development). Due to its considerably greater age, it is also possible that Pleistocene alluvium in the study area was derived from different source rocks, or that geochemical processes that remove arsenic from alluvial soils have had a longer time to take place. It should also be recognized that the datasets for two of the geologic groups are small (n=11 for bay mud, n=14 for “other” Quaternary units), so the differences may also reflect a lack of a representative dataset. While a statistical correlation was identified between soil type and arsenic concentration, the actual processes governing those relations remain elusive. 5.3
Comparison of Findings with Other Background Studies
Despite the difficulties in clearly explaining sources of variation in the background dataset, statistics derived from the database provide defensible global estimates for background concentrations of arsenic within the flatland deposits of the Bay Area. The screening criteria avoided obvious sources of contamination and the
54
Geotracker database by nature contains primarily sites where fuels and organic solvents are the primary contaminant of potential concern. As discussed in Section 3.1, there is little to no correlation between metal and organic compound distributions, and the presence of organic co-contaminants has no effect on metal concentration background ranges. The location and type of sample sites in this study is especially appropriate given they are representative of the geological and land-use settings where future environmental investigations are likely to be performed. A map of Geotracker site locations in the Bay Area instantly reveals that the vast majority of sites undergoing investigation and/or cleanup are located on urbanized flatland underlain by Quaternaryage geologic units. The commercial, industrial, institutional, and transportation-related land uses that are most often the subject of environmental investigations will continue to be predominantly located in such settings. Thus, the regional background estimates derived in this study may actually be more appropriate than background estimates derived from a pristine natural area, particularly if derived from bedrock units that naturally have anomalously high levels of arsenic. The mean of 4.61 mg/kg and the proposed upper estimate of 11 mg/kg for the regional background concentration of arsenic found in this study are noticeably lower than upper limits from several other background studies of various geographic scope and scale (see Sections 1.3 and 1.5). The most obvious difference is with the background threshold value of 42 mg/kg for the Great Valley Sequence and 24 mg/kg for the “other” bedrock discussed in the LBNL (2002) study. The approach to screening sites/samples and the number of samples for this study was comparable to the LBNL study, though the approach to identifying outliers differed. The LBNL study used a uniform criterion of 50 mg/kg to eliminate outliers, whereas this study performed a site-by-site evaluation of
55
outliers based on individual site distributions (the lowest value identified as an outlier, for example, was 7.1 mg/kg). While this difference in approach may have resulted in some of the disparity between background estimates, it is not sufficient to account for the substantially higher background threshold value found in the Berkeley hills. In the LBNL case, the difference can be reasonably explained by differences in the geological setting. The LBNL area is underlain by tertiary-age sedimentary rocks (the Moraga and Orinda Formations) which are highly variable in their lithology, but commonly contain repetitious layers of shale and sandstone. The Great Valley Sequence in the area is mapped as the Claremont Shale of the Monterey Group, which is a finegrained organic-rich shale and mudstone formation. As discussed in Section 1.3 (see Table 1), there is general consensus in the literature that shales and fine-grained soils tend to have naturally higher levels of arsenic than other types of rocks. The fact that the LBNL found a significant difference between different bedrock types on-site, and their finding of relatively high background threshold values support this notion. The national study by Shacklette and Boerngen (1984) also reported noticeably higher background arsenic concentrations (7.2,