1
Vehicle safety and crash risk factors relating to newly licensed drivers in Queensland Michelle Scully, Stuart Newstead Monash University Accident Research Centre Tel: +61 3 9905 1801 Fax + 61 3 9905 4363, and Email:
[email protected] Abstract Graduated Licensing Systems (GLS) are an important aspect of the Safer Road Users components of the safe systems approach. GLS aim to reduce road trauma among one of the most vulnerable road user groups - young novice drivers – by controlling the conditions of gaining driving experience. As part of a larger evaluation of Queensland’s GLS, five-thousand Queensland P1 drivers were invited to complete an anonymous 15-minute self-report survey. All participants were aged between 17 and 25 years and had held their P1 licence between 3 and 6 months. The survey comprised questions relating to driving exposure, vehicle ownership, factors influencing vehicle purchase, and participants’ attitudes towards major GLS initiatives that were introduced from 1 July 2007 (e.g. requirement to record 100 hours of supervised driving experience in a logbook, restriction on carrying peer passengers, ban on mobile phone use, and restriction on driving high-powered vehicles). Participants’ de-identified driving history and demographics were obtained from the Department of Transport and Main Roads prior to data collection (i.e. date and number of attempts to obtain Learner and P1 licence, number and type of driving infringements, gender, and postcode of residence). The final sample comprised 1,404 P1 drivers, an overall response rate of 28%. The analysis focuses on participants’ vehicle ownership and factors influencing vehicle purchase. Keywords young novice drivers, graduated licensing, crash risk, vehicle safety Background In Australia the overrepresentation of young novice drivers in crashes resulting in serious injuries and fatalities is being primarily addressed through Graduated Licensing Systems (GLS). Although GLS differ across jurisdictions, their common features are distinct licensing phases with a variety of accompanying restrictions and requirements, and, a gradual lifting of these restrictions as drivers meet the requirements to progress through each phase (Senserrick & Whelan, 2003). Some consistent patterns have been observed in young novice driver crash risk over the past few decades. There is a marked increase in crash risk among P-plate drivers in comparison to Learners. The first few months of the P-plate period represents the period of highest crash risk for drivers under the GLS with this crash risk gradually reducing over the first 12-months (Transport and Main Roads, 2005). When compared with drivers aged 25 years or older, drivers aged 18-24 years have more single-vehicle crashes, crashes at night, and crashes in rural areas, and, these types of crashes are more likely to result in serious injury or fatality for young novice drivers (Whelan, Scully & Newstead, 2009).
2
On July 1 2007 the Queensland Government enacted 13 major changes to their GLS, the first time a major licensing change had been implemented since 1999. Key initiatives included a two-phased probationary licence period (P1 and P2), a peerpassenger restriction during the P1 licence, an increased Learner permit holding period, restrictions on high-powered vehicles, and the requirement for all Learners under the age of 25 to obtain 100 hours of supervised driving experience (including 10 at night) and record this in a logbook. The Monash University Accident Research Centre were commissioned by Queensland Department of Transport and Main Roads (TMR) to undertake an evaluation of the new GLS examining changes in crashes and infringements associated with the implementation of the new GLS. In addition, a survey of P1 drivers was undertaken in order to obtain information on factors that may influence the effectiveness of the GLS but cannot be measured solely through the crash and infringement database. For example, recent research by Whelan et al. (2009) has for the first time quantified the role that vehicle safety plays in young novice driver crashes, and, research by Watson and Newstead (2009) has demonstrated that young novice drivers typically drive vehicles with poorer crashworthiness when compared to drivers aged 25 years or over. Whelan et al utilised the estimates of driver fatality and serious injury risk in a crash related to different makes and models of vehicle derived from the Used Car Safety Ratings to model crash reduction benefits for young novice drivers resulting form scenarios for safer vehicle purchases. Specifically, it considered the trauma reduction benefits that would have resulted amongst crash involved young novice drivers if, instead of vehicle they actually crashed, they had crashed the vehicle with the best possible crashworthiness from the same vehicle market group and same year of manufacture. Under this scenario it was calculated that a 20 per cent reduction in fatalities and serious injuries among drivers aged 18-20 years could be observed. If the safest alternative vehicle was chosen to be of the same age but from any market group, serious trauma reductions of over 60% were estimated. These results highlighted the potential role improved safe vehicle choices could have in reducing young novice driver road trauma. Aims Whelan et al. reported that the application of research findings related to optimising safe vehicle choices for young novice drivers required further research in order to obtain a greater understanding factors motivating vehicle choice for young novice drivers. The Queensland GLS survey included a section that focussed on measuring these factors, and it is this section of the survey that forms the focus of the current paper. The aim of the research was to describe patterns of vehicle exposure and ownership across L and P1 licensing phases and their association with factors such as budgeted and actual vehicle purchase price, source of funding for the purchase, and modifications made to the vehicle. Method Five thousand Queensland P1 drivers who had held their licence for a minimum of 3months and a maximum of 6-months were randomly selected by TMR from the TMR licensing database. Fifty-three percent of the sample was male (2,344 female P1 drivers, 2,656 male P1 drivers). There was a total of 302 traffic infringements observed in the invited sample. The minimum entry age for P1 is 17-years, and the
3
maximum P1 entry age (i.e. the age before the entire P1 phase is skipped) is 25 years so the data extraction only included participants who were aged 17 years or above and below the age of 25. As of 1 June 2010, the total number of eligible P1 licence holders was 14,459 for the period 1 December 2009 – 31 March 2010. The sample population comprised 34.5% of the total eligible population. From the date that the survey was mailed out, participants had just over 5 weeks to complete and return the survey in order to be included in the draw for one of 10 cash prizes each to the value of $100. Participants were sent a 2-page introductory letter attached to the survey. To maintain privacy the letter was sent by TMR on behalf of the project manager at MUARC. Each survey was allocated a randomly generated key that linked the survey back to personal identifiers held by TMR. MUARC did not have access to this linking table, only the random key. The letter invited participants to complete and return a survey asking them about their attitudes towards the new licensing system. The survey was estimated to take participants 15-minutes to complete. Participants were advised that the survey could be completed and returned either online or via paper using a reply-paid envelope provided, that their responses would be linked to their de-identified driving history for research purposes only, and that their individual responses would only be viewed by MUARC not TMR and would therefore remain anonymous. De-identified crash and infringement data for the five-thousand participants were provided to MUARC by TMR and linked via the randomly generated key. Incentives for completing the survey were also distributed by TMR based on the randomly generated key values if the survey respondents. Some of the many benefits of linking the survey data with the TMR data were the ability to calculate non-response bias in terms of crash- and traffic infringement-involvement, and to use the self-report data to predict factors contributing to crash involvement. The study was approved by the Monash University Human Research Ethics Committee. Results The final sample (N=1,404) represented a response rate of 28% with 301 surveys completed online and submitted electronically, and 1,103 surveys completed via pen and paper and returned via mail using the reply-paid envelope. Despite the invited sample consisting of an almost equal proportion of males and females, more females (57%) completed the survey than males (41%). Of the invited sample, those not completing the survey accounted for 88% of the total proportion of traffic infringements. Participants were asked about their current occupational and educational activities and were encouraged to select more than one response; the responses are displayed in Table 1. Cross-tabulation of responses indicated that participants who reported being enrolled at University were slightly more likely to report also being employed part-time (41%) compared to participants enrolled at high-school/secondary school (31%). The majority of participants reported living with their mother and father (62%) with the next most common response option recorded as living with their mother only (8%) followed by mother and stepfather (6%). Eighty-two per cent of participants reported living with at least one parent. There was a balanced number of responses to the question “were you the first child in your family to be on P-plates?” with 55 per cent
4
of participants reporting yes. Sixty-three per cent of participants reported no to the question “while you were on your Ls, was there anyone else in your household who were on their Ls or Ps?”. Almost all participants (94%) reported that they had professional lessons whilst learning to drive. Of the participants reporting that they had professional lessons, 60% reported that they had 7 lessons or less and 89% had less than 12 lessons. Table 1: Respondent occupational or educational activity Occupational or educational activity Frequency (%) (multiple responses allowed) Enrolled at high school/secondary school
375 (19.54%)
Enrolled at University
446 (23.24%)
Enrolled at TAFE
119 (6.20%)
Employed as an apprentice
119 (5.99%)
Employed part-time
502 (26.16%)
Employed full-time
224 (11.67%)
Unemployed/Seeking employment
101 (5.26%)
Home duties (not working or studying) Benefit receipts
37 (1.93%) 0 (0.00%)
Total
1,919
(100%)
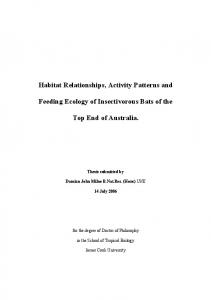
Participants’ responses to the questions on ownership of the car they predominantly used as a learner and P1 driver are presented in Figure 1. 70
60
% Vehicle Ownership Status During Learner and P1 Phase
50
40 30
Learners P1
20 10 0 A family car owned by parent(s)
Allocated Owned by Owned by Owned by to you but driving someone you owned by school else parent(s)
The main family car owned by parent(s)
Figure 1: Vehicle ownership status during Learner and P1 phase
5
There was a clear shift from the number of participants reportedly driving the family car in the Learner phase to driving a car that they own in the P1 phase. Exploratory analysis confirmed that this trend was consistent across gender and driver age. Table 2 shows the pattern of vehicle ownership for the Ls and P1 stages of licensure. The most common pattern was for young novice drivers to learn to drive in the family car owned by their parent(s) and then own a vehicle on their P1 phase. The next most common pattern was to learn to drive in the family car owned by their parent(s) but on the P1 phase drive a vehicle that is owned by their parents but allocated to the P1 driver. Table 2: Vehicle ownership status by licence period
Learners
P1 Missing
Family car owned by parent(s)
Allocated to you*
Owned by someone else
Owned by you
The main family car owned by your parent(s)
Total
Missing
0 (0%)
1 (0.1%)
1 (0.1%)
0 (0%)
6 (0.4%)
0 (0%)
8 (0.6%)
Family car owned by parent(s)
4 (0.3%)
57 (4.1%)
227 (16.2%)
19 (1.4%)
407 (29%)
125 (8.9%)
839 (59.8%)
Allocated to you*
1 (0.1%)
2 (0.1%)
205 (14.6%)
1 (0.1%)
65 (4.6%)
4 (0.3%)
278 (19.8%)
Owned by driving school
0 (0%)
1 (0.1%)
2 (0.1%)
4 (0.3%)
8 (0.6%)
1 (0.1%)
16 (1.1%)
Owned by someone else
1 (0.1%)
0 (0%)
5 (0.4%)
8 (0.6%)
41 (2.9%)
4 (0.3%)
59 (4.2%)
Owned by you
0 (0%)
0 (0%)
3 (0.2%)
2 (0.1%)
197 (14%)
2 (0.1%)
204 (14.5%)
Total
6 (0.4%)
61 (4.3%)
443 (31.6%)
34 (2.4%)
724 (51.6%)
136 (9.7%)
1,404 (100%)
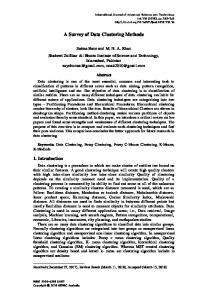
*A family car allocated to you but owned by your parent(s), The majority of participants reported no (86.3%) to the question “are you or your parent(s)/guardian planning to buy a vehicle in the next few months for you to drive – either because you don’t own your own vehicle or are planning to upgrade your current vehicle?”. Seventy per cent of participants expect to pay or actually paid between $0-$10,000 for their vehicle. The responses to the question “how did you pay for, or expect to pay for your vehicle (please select ONE box only)” are shown in Figure 2.
6
35
% Vehicle Purchase Method
30 25 20 15 10 5 0
Entirely with I got a loan It was given to My parents my own savings from a me by a family gave me bank/finance member or money plus I company friend had some savings
My parents paid for the vehicle
Figure 2: Method of vehicle purchase 60
% Ranking vehicle purchase factors as the MOST and LEAST important
50
40
0
Most important factors important factors
Easy to drive/park
Purchase price Running costs Resale Easy to drive/park
Resale
Running costs
Purchase price
Safety
Image/Style
Easy to drive/park
Running costs
Safety
Resale
10
Purchase price
20
Image/Style
30
Safety
Image/Style
Least
Figure 3: Ranking of the most and least factors influencing vehicle purchase factors Figure 3 shows that purchase price followed by safety were the two most important factors reported for participants vehicle purchase and resale value and image/style are regarded the least important factors. The majority of participants reported no (77%) to the question “have you modified, or do you plan to modify, the vehicle you are currently driving in any way?”. Exploratory analysis indicated that there were no gender differences for this question. Discussion and Conclusions
7
A primary focus of this paper was to examine the patterns of vehicle ownership across Ls and P1 phases in relation to factors influencing vehicle choice including the expected or actual vehicle purchase price and payment method, source of funding for the vehicle purchase and expected or actual vehicle modifications. The response rate to the survey used to investigate these issues was 28% with the sample comprising slightly more females than males. The demographic questions in the survey indicated that the majority of respondents lived at home with at least one of their parents, were enrolled either in high-school or University, and had undertaken professional lessons whilst on their Learner licence. A response bias was observed in that the majority of respondents had not received traffic infringements, whereby almost 90% of the infringements were accounted for by those not responding to the survey. Results indicated a clear shift in the pattern of vehicle ownership between the Ls and P1 period. Most participants reported driving the family car owned by their parent(s) as a Learner driver but driving their own vehicle as a P1 driver. The next most common pattern was driving the family car owned by parent(s) during the Learner period but being allocated a different vehicle to drive that was still owned by their parent(s) on the P1 period. The findings indicate that young novice driver’s progression from Ls to P1 is very likely to coincide with a change of vehicle to either a secondary family owned vehicle or their own vehicle. Survey results suggest that in either scenario, it is likely that the vehicle driven during the P1 period was likely to be older and cheaper than the vehicle driven in the Learner period. This is a key finding. Statistically the progression from Ls to P1 results in a 33-fold increase in crash involvement. The change in the vehicle driven between L and P1 phases may have important implications for the crash risk of newly licensed young novice drivers. The spike in crash risk that is observed from Ls to the first few months of the P1 period is generally attributed to inexperience and propensity to drive in high-risk driving situations (Gregersen & Bjurulf, 1996). It is argued that a change in vehicle ownership or the type of vehicle driven should be considered a high-risk driving situation – it may increase a young novice driver’s propensity to engage in poor driving behaviour and it may expose them to greater risk of having a crash due to poorer vehicle primary safety performance and greater risk of death or injury based on vehicle occupant protection performance (crashworthiness). GLS aims to reduce the sudden onset of exposure to high-risk driving situations, for example by enacting restrictions on the carriage of peer passengers or late night driving. To date GLS has generally ignored the role changing vehicle allocation may potentially have on crash and injury risk. Further research should investigate whether vehicle ownership changes increases crash risk, and how the change in vehicle impacts their crash risk from a driver behaviour and vehicle safety perspective. Research should also investigate whether a change in vehicle ownership alone increases young novice driver crash risk irrespective of when this occurs in the GLS, or whether it is the change in vehicle ownership coupled with the transition from Ls to P1 that increases young novice driver crash risk. It may be that the change in vehicle from Ls to P1 has no impact on driving behaviour but the chosen vehicle is poor in terms of primary safety or crashworthiness. The impact on driving behaviour is beyond the scope of this paper
8
and requires further research. The effect that vehicle ownership has in terms of vehicle safety is explored further. Previous research has consistently found that vehicles that are typically driven by newly licensed young novice drivers provide poor crashworthiness in comparison to vehicles driven by drivers aged 25 years or above (Whelan et al. 2009; Watson & Newstead, 2009). At least in part then, vehicle safety is contributing to the high rate of deaths and serious injuries amongst P1 drivers. The survey undertaken in this study asked participants about the make, model, and year of manufacture of their current vehicle and the vehicle that they drove on their Ls. In 2012 TMR crash data pertaining to the survey sample in the 6 month period after the survey will become available for linking. Self-reported vehicle make, model and year of manufacture of the vehicle driven during Ls and P1, and TMR crash data will be used to investigate the role of vehicle safety in newly licensed drivers. To a certain degree this data will allow assessment of the relative crash risk associated with different vehicle choices as well as articulating the role of vehicle crashworthiness in the injury outcomes observed in the crashed reported. It will also allow the crashed vehicle profile of survey respondents to be compared to non-respondents to articulate the ability to generalize results from this study. Whelan et al. (2009) provided encouraging results in terms of potential crash reductions if young novice drivers were driving safe vehicles (i.e. vehicles with the best possible crashworthiness within the identical vehicle market group and same year of manufacture to the vehicle the young novice driver crashed). The research evidence is mounting on the important role that vehicle safety plays among newly licensed drivers. The problem then becomes how vehicle choice can be influenced so that young novice drivers are driving safe vehicles, particularly in the first few months and years of independent driving. The vehicle ownership results of this study indicate that vehicle choice includes the allocation of vehicles to young novice drivers from their parents’ pool of family vehicles, as well as traditional consumer vehicle choice in terms of the purchase of new or used vehicles. Whelan et al. (2009) reported the top 10 most common vehicles crashed by young novice drivers with each vehicle’s respective crashworthiness rating and current market value, and also the safest vehicle alternatives (within the same vehicle market group and year of manufacture of all crashed vehicles) with each vehicle’s crashworthiness ratings and used vehicle purchase price range. Further inspection of this data indicates that the 10 most common vehicles crashed by young novice drivers belong predominantly to four market groups; large, medium, small, and light (Used Car Safety Ratings brochure, 2010). The average crashworthiness rating (risk of death or serious injury given crash involvement) for the vehicles that are most commonly crashed by young novice drivers is 4.26% and the purchase price for these vehicles ranges from an average of $1,081-$3,859. The average crashworthiness rating for the safer vehicle alternatives across the four vehicle market groups is 1.59% and the purchase price for these vehicles ranges from an average of $7,522-$12,513. The average vehicle purchase for safer vehicle alternatives is around $10,000, which is consistent with the results of the current study where 70% of participants either
9
expected to pay or actually paid up to $10,000 for their vehicle which is very close to the purchase price that a young novice driver has actually paid or would expect to pay. This indicates that vehicle purchase price is not likely to be a barrier for young novice drivers to choose safer vehicle alternatives. The survey results demonstrate that vehicle purchase price is the most critical factor influencing vehicle choice and resale value the least important factor. It also showed that participants either expect to pay or actually pay for their vehicle with their own savings, with receiving money from parents (either in full or a proportion) also fairly common. It was uncommon for participants to report receiving finance, thus reducing the efficacy of targeting finance companies to encourage safer vehicle purchase for young novice drivers. As most participants were living with at least one of their parents it is highly likely that parental involvement is involved during the process of P1 drivers purchasing a vehicle, and it is arguably impossible for no parental involvement among those P1 drivers who reported driving another family vehicle allocated to them but owned by their parents. The development of strategies that target both the parent and the young novice driver so that they are informed of the safest vehicle choices and can avoid making poor decisions should be considered. The development of information on safe vehicle purchase through websites and brochures is important but the promotion of these information sources timed prior to vehicle purchase is critical. One source of information can be found on the newly developed First Car List which is a two-page document available online on the Arrive Alive website listing safe and affordable vehicles (Arrive Alive, 2010). Parents should be encouraged to lend their P1 driver the main family vehicle as this is most likely to be the safest vehicle in the family in terms of primary (crash avoidance) and secondary (injury mitigation) safety. Additional initiatives could include restricting P1 drivers to vehicles based on their crashworthiness (in addition to the current restrictions that restrict young novice drivers based on vehicle power). Further analysis from this study using survey responses to predict crashes will allow a clearer understanding of the role that vehicle ownership plays in crash risk and in turn be used to better develop strategies to encourage safe vehicle choices for drivers in the Queensland GLS. If future research concludes that it is the change in vehicle ownership occurring around the same time as the transition from Ls to P1 that increases crash risk, and not just a change in vehicle ownership at any point in the GLS, then consideration of policy change that delays vehicle ownership change until the P2 phase or conversely advances the vehicle ownership change to the Learner period is warranted. A further strategy for optimizing young novice driver vehicle choice may be through the use of reduced insurance premiums for young novice drivers that encourage the purchase of vehicles with good crashworthiness. Following further research into vehicle ownership and allocation, reduced premiums for parents who lend the main family vehicle to their newly licensed drivers should also be explored. Reduced premiums or excesses could also apply to vehicles with smart key technology. Potentially the driving limits provided by the smart key technology could be based on the restrictions in the GLS (e.g. peer passenger restriction, zero BAC). The paper has reported on the initial results from a survey of P1 drivers in Queensland. The results have enabled a number of issues and future research
10
opportunities to be identified in the areas of vehicle ownership and vehicle choice for young novice drivers. The key issue that has been identified is the change in the vehicle driven by the young novice driver in the transition from Ls to P1. It appears that at the same time that a young novice driver progresses through the GLS from the phases with the lowest to highest risk of crash involvement, they also transition from driving in a relatively safe vehicle owned by their parent(s) to a relatively unsafe vehicle owned either by themselves, or a secondary family vehicle allocated to them but owned by their parent(s). Further research is required to understand how to manage this change in vehicle ownership. Following the analysis of responses to the vehicle make, model and year of manufacture and the TMR crash data there should be sufficient evidence to facilitate the development of initiatives to improve safe vehicle choice for young novice drivers. This area of research is relatively new but provides promising opportunities to reduce the high rate of deaths and serious injuries amongst young novice drivers. At the same time the research can further knowledge of the safe systems approach as the area of research addresses aspects both safer road users; and safer vehicles. Acknowledgements The authors wish to acknowledge the financial support of Queensland Department of Transport and Main Roads. While this paper reflects the impartial research findings and opinions of the authors, the paper and its conclusions may not necessarily reflect the policy position of the Department of Transport and Main Roads. The authors would like to acknowledge the wonderful support and assistance from Samuel Bailey of TMR in developing the study methodology, in particular the linkage of survey and TMR data and input into survey item development. References Arrive Alive (2010). First Car List, viewed June 2011, http://www.arrivealive.vic.gov.au/files/initiatives/firstcar/VRD0592_Used_Cars _Safety_List.pdf. Gregersen, N.P., & Bjurulf, P. (1996). Young Novice Drivers: Towards a model of their accident involvement. Accident Analysis & Prevention, 28, 229-246. Senserrick T.M., & Whelan, M.I. (2003). Graduated driver licensing: Effectiveness of systems and individual components. MUARC Report 209, Monash University Accident Research Centre, Clayton, Victoria. Transport and Main Roads (2005). Queensland youth on the road and in control: a discussion of ways to improve young driver safety. Discussion paper, October 2005. Used Car Safety Ratings (2010). Buyer’s guide to Used Car Safety Ratings 2010. Released July 2010. Watson, L., & Newstead, S. (2009). Vehicle safety and young drivers, Stage 1 – Profile of young driver vehicles. Monash University Accident Research Centre, Melbourne. Whelan, M., Scully, J., & Newstead, S. (2009). Vehicle safety and young drivers Stages 2 and 3: Analysis of young driver crash types and vehicle choice optimisation. Report 292. MUARC.