Hydrol. Earth Syst. Sci., 14, 2507–2525, 2010 www.hydrol-earth-syst-sci.net/14/2507/2010/ doi:10.5194/hess-14-2507-2010 © Author(s) 2010. CC Attribution 3.0 License.
Hydrology and Earth System Sciences
Establishment of a catchment monitoring network through a participatory approach in a rural community in South Africa V. M. Kongo1,* , J. R. Kosgei1,** , G. P. W. Jewitt1 , and S. A. Lorentz1 1 School
of Bioresources Engineering and Environmental Hydrology University of KwaZulu-Natal, PB X01, Scottville, Pietermaritzburg, South Africa * now at: Stockholm Environment Institute-Africa Centre, Institute of Resource Assessment, University of Dar es Salaam, P.O. Box 35097, Dar es Salaam, Tanzania ** now at: Masinde Muliro University of Science & Technology, Department of Civil & Structural Engineering, P.O. Box 190-50100, Kakamega, Kenya Received: 10 September 2007 – Published in Hydrol. Earth Syst. Sci. Discuss.: 16 October 2007 Revised: 10 November 2010 – Accepted: 22 November 2010 – Published: 13 December 2010
Abstract. The establishment of a catchment monitoring network is a process, from the inception of the idea to its implementation, the latter being the construction of relevant gauging structures and installation of the various instruments. It is useful that the local communities and other stakeholders are involved and participate in such a process, as was highlighted during the establishment of the hydrological monitoring network in the Potshini catchment in Bergville District in the KwaZulu-Natal Province, South Africa. The paper highlights the participatory establishment of a hydrological monitoring network in a small rural inhabited catchment, in line with the overall objective of the Smallholder System Innovations (SSI) research programme, to monitor hydrological processes at both field and catchment scale for water resources management research purposes. The engagement and participation of the Potshini community precipitated a learning opportunity for both the researchers and the local community on (i) the understanding of hydrological processes inherent in the catchment (ii) appreciating the inherent dynamics in establishing a catchment monitoring network in the midst of a community (iii) paradigm shift on how to engage different stakeholders at different levels of participation. The participatory engagement in the monitoring process led to appreciation and uptake of some of the research results by the Potshini community and ensured continued support from all stakeholders. This paper is of the view that the participation of the local community and other stakeholders in catchment monitoring and instilling a sense of ownership and
Correspondence to: V. M. Kongo (
[email protected])
management of natural resources to the local communities needs to be encouraged at all times. Success stories in water resources management by local communities can be realized if such a process is integrated with other development plans in the catchment at all forums, with due recognition of the social dynamics of the communities living in the catchment.
1
Introduction
Sound decision making for water resources and environmental management has to be based on good knowledge and factual information regarding the dominant hydrological processes, together with bio-physical characteristics of a catchment and in combination with socio-economic aspects. Such information, especially on hydrological processes, can only be obtained through establishing networks that are capable of monitoring hydrological processes at different temporal and spatial scales. Such a process is normally driven by a motive to meet certain research objectives (e.g. Wigmosta and Burges, 1997; Gilvear and Bradley, 2000; Hodgson et al., 2002; Ireson et al., 2006), but with consideration of the cost implications with regard to construction and acquisition of the various instruments and their maintenance. However, research catchments are typically established in uninhabited areas. In fact, people are usually excluded from such catchments as they add uncontrollable variables to the experiment as well as present the risk of theft and vandalism. An alternative perspective is that the establishment of a catchment monitoring network involves a process, from inception of the idea to the actual construction of the various structures and installation of the necessary equipment and
Published by Copernicus Publications on behalf of the European Geosciences Union.
2508
V. M. Kongo et al.: Establishment of a catchment monitoring network through a participatory approach
instruments while engaging relevant stakeholders, but that this forms only the first few steps of an ongoing engagement with the community. This perspective has become increasingly important in the context of initiatives to ensure food security at the household and smallholder level where detailed understanding of water dynamics is imperative, but largely unknown. From the farmer’s perspective, to decide that a water use innovation is worthy of investment, they also need a realistic understanding of its risks and benefits, including factors such as time and monetary input requirements, but very importantly, potential effects on yield and soil and water conservation. This reduces the risk of wasted expenditure on an innovation that is not suited to their specific situation, which could lead to reluctance towards trying other potentially beneficial innovations (Sturdy et al., 2008). In order to realize these benefits, the involvement of the smallholder farmers from the onset is imperative. There are few case studies in the available literature on the establishment of detailed catchment monitoring networks through a participatory approach involving the local community and other stakeholders. Moriarty (2000) reported the establishment of the Romwe catchment in Zimbabwe through the involvement of the local community, but the participatory approach that was applied in due process was not highlighted. A survey study by Loreta et al. (2006) indicated the desire by local communities and other stakeholders to be involved in water quality monitoring and surveillance in the Mzingwane catchment in Zimbabwe, even though they were not aware of the existence of such a monitoring programme in their locality. It is perceived that the participatory approach in catchment monitoring has long term benefits, including the opportunity for the relevant stakeholders, notably the local community, to gain insight into the hydrological regime of their locality. This in turn provides a better basis for decision making for catchment based activities and understanding the impact of anthropogenic activities on water resources in the catchment, thus contributing to environmental education. The latter is key to effective community involvement in participatory research and development of research products that are relevant and acceptable to the community (Marshke and Sinclair, 2009). Thus, a participatory approach requires a constant effort to initiate a learning process, through which the local community is able to appreciate and recognize the importance of catchment monitoring, notwithstanding the willingness of the community to participate in the monitoring exercise. This paper highlights the participatory establishment and monitoring of a hydrological network in the midst of a rural community, the Potshini community, in the upper Thukela river basin in South Africa. The catchment monitoring network was established in line with the overall objective of the Smallholder System Innovations (SSI) in integrated watershed management research programme (Rockstr¨om et al., 2004) of addressing the challenges of increasing food Hydrol. Earth Syst. Sci., 14, 2507–2525, 2010
production and improving rural livelihoods while safeguarding critical ecosystem functions and services. The approach used to establish the monitoring network supports the contention of Wagener et al. (2010) that a key element of a “paradigm shift” in our approach to understanding the hydrological functioning of coupled human-nature systems is to move from a perspective of humans being intrinsic, rather than external to the hydrologic system and to research catchments which are not pristine, but rather reflect the places where humans live and interact. Thus, the paper provides a good case study for considering the many issues and challenges (social, scientific and engineering) that need to be addressed in the process of establishing the monitoring network in a populated rural catchment in a developing region. The paper shares experience which is often not documented in literature, but of great value in water resources management, especially in developing countries. 1.1
The study area
The Potshini catchment, Figs. 1, 2 and 3, is located in the foothills of the Drakensberg mountains in South Africa (29.3679◦ E, 28.8145◦ S) at an average altitude of 1310 m and is predominantly a smallholder farming area and a subcatchment of the Quaternary Catchment1 number V13D (Emmaus catchment) in the Thukela River basin in South Africa. The Thukela river basin is comprised of 86 Quaternary Catchments with a total area of 29 036 km2 , with the Quaternary Catchment V13D having an area of 285 km2 . The Potshini catchment comprises 2-nested catchments, with an area of 1.2 km2 (gauged by an H-Flume) and 10 km2 (gauged by a pressure transducer), respectively (cf. Figs. 1 and 3). The mean annual precipitation at Potshini is estimated to be 700 mm a−1 and the estimated mean annual potential evaporation is between 1600 to 2000 mm a−1 (Kongo and Jewitt, 2006). The rains occurs during the summer season (September to April), with heavy rains being characterized by thunderstorms and occasional hailstorms. The maximum and minimum temperatures recorded in the catchment since 2004 are 34 and −4 ◦ C respectively. Frost is common during the dry winter season (May to August) and has often destroyed vegetative materials in the catchment, including vegetables in homestead gardens. Due to local topography and high summer rainfall, a good drainage network has developed in the Potshini catchment with some of the streams being perennial and providing water for domestic use to the upper part of the catchment, while replenishing reservoirs for commercial farmers downstream. The main land uses in the catchment include the predominant smallholder farming (crop production) during summer, which constitutes approximately 60% of the total land in the catchment, 1 Quaternary Catchments (QC) in South Africa are the smallest delimitations of a river basin upon which policies and decision with regard to water resources management are based upon. The QC were defined and established by the National Department of Water Affairs and Forestry.
www.hydrol-earth-syst-sci.net/14/2507/2010/
V. M. Kongo et al.: Establishment of a catchment monitoring network through a participatory approach
2509
Fig. 1. An overview of the Thukela River basin and the nested Potshini catchment.
and grazing. The smallholder farms are individually owned while grazing areas and boreholes that were installed by the local authorities are considered common property. The main sources of water for domestic use in the community are bore holes, springs and the Potshini stream.
2
Objectives for establishing the Potshini catchment monitoring network
The inclusion of people in research catchments has many challenges. Nevertheless, one cannot carry out convincing studies on the interaction between water resources and food security of any rural community without considering www.hydrol-earth-syst-sci.net/14/2507/2010/
the livelihoods of the rural community and the dominant hydrological processes taking place in the locality. It is with this understanding that the Potshini catchment monitoring network was established, to address some of the scientific and developmental objectives of the Smallholder System Innovations programme. The main objectives of establishing the Potshini catchment monitoring network were: – Monitoring the hydro-climatological processes of the Potshini catchment in order to gain an in-depth understanding of the hydrological regime of the catchment and investigate the hydrological and ecosystem impacts of adoption and adaptation of water use innovations (e.g. rainwater harvesting, conservation tillage etc.) in the Potshini catchment. Hydrol. Earth Syst. Sci., 14, 2507–2525, 2010
2510
V. M. Kongo et al.: Establishment of a catchment monitoring network through a participatory approach
H-Flume
Fig. 2. An overview of the households in the Potshini catchment.
– Establishing a capacity to assess, monitor, and manage water and environmental resources in the Potshini community in collaboration with various stakeholders through training on the basic methodologies of catchment monitoring. – Providing information to scientists and community members alike on the potential for improved productivity from water resources of the catchment. – Providing an opportunity for future and further research through the establishment of a catchment monitoring network with a potential for upscaling and integrating into other larger networks in the country. This is due to the fact that the network comprises several permanent structures which other researchers may use in their studies in the future after the completion of the SSI research programme2 . The SSI research programme was focused on investigating the potential of small-scale water system innovations for upgrading rainfed farming in semi-arid agro-ecosystems, including aspects such as the need for local adaptations of these techniques, adoption of them among smallholder farmers and possible trade-offs between water for agriculture and water for surrounding ecosystems. It must be noted that SSI was both a scientific programme and as such dedicated to the delivery of innovative and high quality research, albeit in a developmental setting, as well as a development and outreach programme, dedicated to the improvement of human livelihoods through the application and uptake of water system innovations (Sally, 2010). The instrumentation which formed the Potshini hydrological monitoring network ranged in sophistication from simple manual rain guages, to state of the art instruments such as the Large Aperture Scintillometer. 2 an aim which is being achieved through ongoing research initiative
Hydrol. Earth Syst. Sci., 14, 2507–2525, 2010
Fig. 3. The 1.2 km2 Potshini catchment.
2.1
Main stakeholders
The process of establishing the Potshini catchment monitoring network was initiated in early 2004 under the SSI research programe at the School of Bioresources Engineering and Environmental Hydrology of the University of KwaZuluNatal, South Africa. The process integrated two approaches (i) a participatory approach where the local community and other stakeholders were involved and participated and (ii) a scientific approach which entailed the application of scientific and engineering principles in designing, construction and installation of various structures and instruments. The two approaches were not treated separately but rather formed an integrated continuous learning process where the relevant stakeholders and researchers made an effort to interact and to learn from each other. The main stakeholders for the SSI programme in the Potshini catchment, at various degrees of participation, included the following: (i) smallholder farmers actively participating in various experimental and monitoring activities (ii) members of the local community in the Potshini catchment in observation and construction; (iii) smallholder farmers neighbouring the Potshini catchment in attending field days and learning sessions; (iv) neighbouring large scale commercial farmers in participating and supporting the catchment monitoring initiative; (v) the traditional and local leadership in assembling and motivating the community; (vi) the Provincial Department of Agriculture and Environment in supporting teaching, providing material inputs, organizing field days and encouraging the community to become involved; (vii) the Agricultural Research CouncilInstitute of Climate Soil and Water in contributing expertise from past research in Potshini; (viii) the Local Authority-the Okhahlamba Municipality in encouraging the community to become involved and providing material inputs and (ix) the www.hydrol-earth-syst-sci.net/14/2507/2010/
V. M. Kongo et al.: Establishment of a catchment monitoring network through a participatory approach KwaZulu-Natal Provincial Department of Water Affairs and Forestry in providing monitoring and domestic boreholes. The Potshini catchment was previously ungauaged and the catchment monitoring network already has provided benefits to both the local community on the upstream (as elaborated in subsequent sections of this paper) and to the downstream water users, e.g. the commercial farmers who rely on the water yields from the upper Potshini catchment for replenishing their farm dams (cf. Figs. 1 and 2). Any change in land use or water use, e.g. intensification of rainwater harvesting on the upper catchment could significantly affect the catchment response, including water quality e.g. sediment load, which is an important parameter with regard to management of the downstream reservoirs. It is also acknowledged that the water quality of the water filling the downstream reservoirs could be impaired due to the anthropogenic activities on the upstream, e.g. washing clothes in streams using phosphorous-enriched detergents and intensive application of fertilizers on the smallholder farms in the community. Thus, the downstream water users were also important stakeholders in the hydrological research undertakings in the SSI research programme. The Potshini catchment monitoring network comprised gauging structures and instrumentation, mostly automated, for measuring and monitoring stream flows, overland flow from experimental runoff plots, sediment load, shallow and deep ground water bodies, subsurface resistivity using Electrical Resistivity Tomography (Loke, 2003), isotopic composition (Deuterium and Oxygen-18) in both surface and subsurface water, volumetric soil moisture content dynamics, soil hydraulic characteristics, crop transpiration rates and meteorological variables. The application of scintillation techniques (Large Aperture Scintillometer) in estimating total evaporation in the Potshini catchment formed an intermediate observation and a local-scale calibration for remote sensed estimates of total evaporation from satellite images in the catchment and the Thukela river basin at large, using the Surface Energy Balance Algorithm for Land (SEBAL) (Bastiaanssen et al., 1998a,b; Bastiaanssen, 2000). Initial results on hydrological studies based on data obtained from the Potshini catchment monitoring network are reported in Kongo and Jewitt (2006), Kosgei et al. (2007) and Kongo et al. (2010). In addition, various experiments in crop water use and land preparation were conducted where farmers were directly involved in assessing different land preparation and crop production techniques at field scale. Here, the research team provided detailed measurements of soil hydraulic characteristics and monitoring crop water use in close collaboration with the owner/smallholder farmer who kept detailed records of application and yield.
www.hydrol-earth-syst-sci.net/14/2507/2010/
2.2
2511
Overview of a logical hydrological measurement sequence
Although hydrological processes vary continuously in time and space, they are often described and derived from point measurements. The resulting data form a time series, which is typically subjected to further processing, including statistical analysis and or hydrological modelling. Chow et al. (1988) highlighted a sequence of logical steps which are commonly followed for hydrological measurements and monitoring, beginning with the instrumentation of a physical device that senses or reacts to the physical phenomenon and ending with the delivery of data to the users. Such a sequence was adapted during the establishment of the Potshini catchment monitoring network with an additional participatory component where the input from the local community and other stakeholders was sought and incorporated as indicated in Fig. 4. In the absence of the participatory component, the sequence describes a scenario which is biased to understanding the hydrological processes in a catchment, but void of the social dimension of how the local community understand and respond to the hydrological processes being monitored. The social dimension is valuable for several reasons, including (i) the understanding by the researchers of the community’s knowledge base with regard to the dominant hydrological processes e.g. rainfall patterns, stream flows, temperatures etc.; (ii) creation of a platform for the community to learn more in quantifiable terms about the dominant hydrological processes taking place in their midst and the importance of understanding such processes and (iii) facilitation and enhancement of the community’s willingness to invest time and effort in the monitoring activities, not withstanding their goodwill in maintaining and securing the various equipment and instruments in their midst. An example of application of the local knowledge base in this study is highlighted in Sects. 3.2 and 3.3 of this paper. Such an approach perpetuated a sense of ownership and, through interaction with the SSI researchers, imparted management skills of natural resources to the local community. The social dimension can be complicated if several stakeholders with diverse interests are involved in the establishment of a catchment monitoring network. Nevertheless, such diversity can be a source of inspiration and strength if a common understanding is sought at the initial stages. However this must be based on good working relationships and trust, of which was achieved during the establishment of the Potshini catchment monitoring network as explained in Sect. 3. Although the steps indicated in Fig. 4 may appear to be obvious, even simple, they need to be followed and documented for the purpose of sharing the experience and knowledge as highlighted in this paper.
Hydrol. Earth Syst. Sci., 14, 2507–2525, 2010
2512
V. M. Kongo et al.: Establishment of a catchment monitoring network through a participatory approach
Hydrological phenomenon (e.g rainfall)
Instrumentation Setting up of a monitoring network
Sensing Transforming the intensity of the phenomenon into an observable signal
Input from local community and other stakeholders Local knowledge, goodwill, participatory monitoring and recording
Recording Make an electronic or paper record of the signal
Transmission Move the record to a central processing site/unit
Translation
Water resources decision making Regulatory framework at different scales, maximizing potential use, sustainability and sharing of water resources
Convert the record into a computerized data sequence
Editing Check the data and eliminate errors and redundant information
Storage Archiving the data in a data base
Feed back to the local community and other stakeholders Community field days, report on analysed data, share data and information with stakeholders
Retrieval Recover the data in the form required
Fig. 4. Hydrological measurement sequence with a participatory component indicating the role of the local community and other stakeholders.
3 3.1
Monitoring network establishment The participatory process
A communication process and dialogue was initiated between the researchers and the relevant stakeholders in the catchment and the research approach applied in establishing the Potshini catchment monitoring network followed a Participatory Research approach (Bhatt et al., 2006), where the smallholder farmers and other stakeholders were involved from the initial preparatory stages to the actual construction and instrumentation of the various structures and instruments and thereafter actively participated in the monitoring. Local input was sought regarding the siting of structures and instruments and permission to develop a monitoring network was sought from the local farmers’ forum, individual farmers as well as from the traditional and local leaders of the area. Local artisans and masons were purposely involved in construction of various structures and installation of some Hydrol. Earth Syst. Sci., 14, 2507–2525, 2010
of the instruments as part of a wider learning platform and technology transfer to enable them appreciate the operational mechanisms of the network. The procedure used to select these artisans and masons is highlighted in Sect. 3.3. The culture and practices (e.g. abstaining from any field activities that involve digging or excavation of the soil during burials) of the Potshini community were respected at all times both during and after the establishment of the Potshini catchment monitoring network. The approach proved to be effective in perpetuating a conducive environment for interacting with the local community and hence the goodwill of the community to safeguard any installations in the area. Several smallholder farmers in the Potshini community volunteered to participate in various research activities including managing experimental trials on their farms. The voluntary catchment monitoring by some of the smallholder farmers in the Potshini catchment was beneficial to them as elaborated in Sects. 3.6 and 3.7 of this paper.
www.hydrol-earth-syst-sci.net/14/2507/2010/
V. M. Kongo et al.: Establishment of a catchment monitoring network through a participatory approach
2513
2
3.2
Siting of stream flow gauging structures
2.5
Flow depth for a 2 yr return flood estimated by SCS
Channel depth (m)
The local community continued to be a key stakeholder in the SSI research programme and an effort was made towards creating and maintaining a cordial relationship with the community based on respect, trust and friendship, an aspect which is expanded upon in Sect. 4 of this paper.
Previous inundation extent as marked by the local elders
2
H-flume approach channel
1.5
1
Left bank
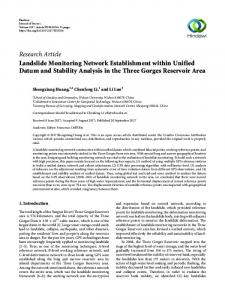
The establishment of the Potshini catchment monitoring network involved the initial stage of reconnaissance surveys to gain a general understanding of the catchment before detailed and specific site surveys were performed as per requirements of each structure or instrument. The siting of the stream flow gauging sites and design of the gauging structures in the Potshini catchment involved the application of the local knowledge, scientific and engineering techniques. In particular, the local knowledge on the historical peak flows and flood prone areas was vital during the design and construction of one of the stream flow measuring structures, i.e. an H-Flume, where community members, especially the elders, were involved in some of the reconnaissance surveys in the catchment with regard to siting for an appropriate section along the stream for its construction. For example, the elders were asked how often the stream in the Potshini catchment overtopped its banks and whether the sites that had been identified as ideal for constructing the H-flume, based on the criteria highlighted in Kongo et al. (2007), were safe from flooding and inundation. According to the elders, the site where the H-flume was eventually constructed was prone to inundation at most every three years and they even marked the inundation extent for flooding event at this section as indicated in Fig. 5. This information was useful in the design of the H-flume, especially the orientation of the instrumentation house as discussed in Sect. 3.3 of this paper. Even though the stream-section on which the H-flume was constructed was prone to inundation (based on local knowledge), it was preferred due to the structural stability of its narrow banks, presence of underlying rocky material for stability of the approach channel, and most importantly enough bed slope for preventing downstream inundation, which is an important parameter in construction of H-flumes (Ackers et al., 1978). It is interesting to note that the information obtained from the local community with regard to historical peak flows (cf. Fig. 5), i.e. stream flow depth during historical peak flows, was in close agreement with results obtained from a modeling exercise, using the Soil Conservation Services (SCS) methodology (Schulze et al., 1992), in determining peak floods from the Potshini catchment. 3.3
Design and construction of the H-flume
The main reason for using an H-flume rather than a weir in the 1.2 km2 Potshini catchment was to facilitate accurate monitoring of the sediment load and low flows. The flume was designed to carry a maximum flow of 3.4 m3 /s at a depth www.hydrol-earth-syst-sci.net/14/2507/2010/
Right bank 0.5
0
12 -12
10 -10
8 -8
-6 6
-4 4
-2 2
0
2
4
6
8
10
12
14
16
18
20
Distance from the thalweg (m)
Fig. 5. Schematic diagram of the cross section at the H-flume gauging site (with a vertical exaggeration). See Figs. 1 and 2 for location.
of 1.2 m. Necessary precautionary features and safety factors, together with advice and knowledge from the local people, were incorporated in the design and construction of the instrumentation house and the approach channel to allow the safe passage of a 2-year return period flood without affecting its structural stability. In particular, the orientation of the H-flume’s instrumentation house was influenced by the local knowledge from the elders of the Potshini community on inundation extent at the site where the gauging structure was constructed as illustrated in Fig. 5. The H-flume was constructed with active participation of the local Potshini community, where the local leaders were asked to identify the suitable masons in the community based on the quality of their past workmanship, especially in building brick/block houses in Potshini and surrounding communities. It turned out that three masons had unique experience in certain construction aspects, e.g. foundation, concrete works etc. and hence the SSI research team found it prudent to involve the three as the lead technical team in construction of the H-flume and asked them to find four other persons from different parts of the community to provide labour. Such an approach perpetuated a sense of cohesiveness and team work to the construction team and which turned out to be beneficial after the construction works under the SSI research programme where the same team continued to procure local tenders for construction of both traditional (grass thatched with mud walls) and permanent (block walls with galvanized or tile roofing) houses in the Potshini community, neighbouring communities and the nearby Bergville town. The contract between the SSI research programme and the local construction team was negotiated on provision of labour, of which the construction team was to construct the H-flume, from foundation to the superstructure within a specified time, while the SSI programme was to provide material and technical expertise on the layout and ensured that all specifications of the structure was as per design. It was a challenge for the construction team to estimate their labour cost given the fact that they had never constructed a similar Hydrol. Earth Syst. Sci., 14, 2507–2525, 2010
2514
V. M. Kongo et al.: Establishment of a catchment monitoring network through a participatory approach
structure before and above all it was to be built in a flowing stream. In this regard, the SSI researchers sought to know the cost of constructing a house in the community, using the same number of building blocks as the H-flume, and added 30% of such a cost to take care of the extra labour input that was to be required especially in excavation and reinforcement works. In all, the total cost of constructing the H-flume, in 2004, was approximately US$ 4000.00, with the labour cost constituting 32% of the total cost i.e. US$ 1300.00. The local construction team portrayed impressive skills, from reading an engineering design drawing to brick and reinforcement works. The SSI researchers managed to point out in advance the few construction errors that were observed, and which were corrected accordingly. Figure 6 shows the construction of the H-flume in progress. Significantly, the construction team appreciated some important procedures and skills that they learnt during the construction exercise, including the importance of precision in measurements, timeliness and above all their ability to construct a hydraulic structure in a flowing stream, an endeavor they had not undertaken before. Such skills were beneficial later to some members of the construction team when the same team was contracted later in 2005 and 2006 to construct subsurface rainwater harvesting tanks in the community by the SSI researchers and another community development project in Potshini, funded by the Water Research Commission (WRC) of South Africa. One of the criteria that was used to recruit the construction team members in constructing the tanks was their previous experience, which had been demonstrated by those who had constructed the H-flume. 3.4
Monitoring stream flow
Stream flow at the larger 10 km2 nested Potshini catchment (cf. Fig. 1) was gauged by monitoring the stage water level fluctuations, at a road culvert, using a pressure transducer. A rating curve was developed at this road culvert gauging site after carrying out velocity transect surveys, using a propeller current meter, on discrete days between 2005 and 2007 and for different discharges. Some members of the Potshini community voluntarily participated in the discharge measurement exercise and benefitted from an understanding of the various controls on streamflow in the catchment. For example, the flows at the culvert bridge are controlled by the upstream farm-dams (cf. Figs. 1 and 2) and most often the flows that are observed at this section are low flows with limited sediment loads and hence there was no need to monitor sediment fluxes at this point except for stage measurements. Level of discharge at the Potshini H-flume (cf. Figs. 1, 2 and 3) was monitored via a tube, connecting the open approach channel discharge to a stilling well as illustrated in Fig. 7. The Potshini community was also involved in the ongoing monitoring. Every Monday of each week, and after a rainfall event, a designated community member, who was also Hydrol. Earth Syst. Sci., 14, 2507–2525, 2010
Fig. 6. Constructing the H-Flume in the Potshini catchment.
the SSI programme facilitator in the community, took manual readings of the depth of flow, date and time at the Hflume gauging site using a stainless steel tape measure. It is useful to note that the community facilitator was elected by the Potshini community in a well attended community meeting, to assist or facilitate the SSI researchers on behalf of the community, during the initial stages of implementing the SSI programme. The manual measurements were used to check the stage readings recorded by the data logger. It was interesting and encouraging to note that the community facilitator urged his fellow community members, especially those who had manual rain gauges installed in their homesteads, (Sect. 3.6), to accompany him to the H-flume gauging site when taking the stage readings. This had the benefit of making them aware of the quantifiable relationship between rainfall, which they were recording at their homesteads, and the stream flow recorded at the H-flume. Only the community facilitator was compensated for his continuous monitoring efforts; all the other community members participated in the monitoring activities in the SSI programme out of their interest and goodwill. 3.5
Monitoring of sediment load and isotopic composition of stream flow
It is always a challenge to obtain a representative water sample in streams at the desired time and hydraulic conditions, for analytical work on water quality. This is compounded by the fact that stream flows emanating from head water catchments of relatively small area in semi-arid areas are highly variable, with rapid overland flows and interflows (Kongo, 2008). Thus a good sampling scheme should take into consideration such variations of flow by taking frequent samples during a changing flow. Two parameters, i.e. sediment load and isotopic composition of Oxygen-18 and Deuterium (18 O and 2 H) were www.hydrol-earth-syst-sci.net/14/2507/2010/
V. M. Kongo et al.: Establishment of a catchment monitoring network through a participatory approach
2515
Water level in the approach channel is same as in the stilling well
Float cable connected to a shaft encorder and an MCS data logger
Approach channel
Float in the stilling well Stilling well
50mm x 5.6m connecting pipe sloping towards the stilling well
Fig. 7. A schematic diagram indicating the mechanism for monitoring the approach channel flow depth using a stilling well and float at the Potshini H-Flume. The length and width of the approach channel are 11.5 m and 2.7 m respectively.
analyzed from samples obtained from the 1.2 km2 catchment which was gauged by an H-fume and equipped with an ISCO sampler, the latter being controlled by a data logger as illustrated in Fig. 7. The sampler had a capacity of 24 bottles of 500 ml each and the sampling-trigger parameters in the data logger were varied, depending on the season, to achieve the desired sampling scheme. The local community had a significant role in this monitoring exercise where three members of the community, including the community facilitator, took turns to check on number of bottle samples already filled in the ISCO and notified the researchers by sending a cellphone text messages (SMS) when the number of remaining empty sample bottles in the ISCO was less than 10. The community facilitator was trained to remove samples from the ISCO, label the samples, replace the empty bottle cartridge in the right position and to reset the sampling scheme in the data logger. This had the benefit of ensuring that there were always empty sampling bottles in the ISCO, especially during the wet season if by any chance the researchers were not in the catchment. Manual samples for isotopic analysis (18 O and 2 H) were taken at the outlet of both the 1.2 km2 and 10 km2 catchments. These samples were mainly taken by the local community once every week (on a Monday) and labeled accordingly (i.e., site name and time of sampling). It should be noted that the main reasons for automating the measurement and sampling of stream flows were (i) for convenience purposes, especially during the night when it was difficult for both the researchers and community members to take samples and measurements and (ii) for continuous monitoring, thus accounting for extreme events e.g. big rainfall events which led to increased stream flows and sediment loads. The water samples were temporarily stored in the instrumentation house of the H-Flume before being taken to the relevant laboratories for analysis. Some of these samples were displayed during field days in the community when other neighbouring communities (smallholder farmers) were www.hydrol-earth-syst-sci.net/14/2507/2010/
invited. It was interesting for the smallholder farmers to note the clear difference between samples taken: (i) before a rainfall season (low flows); (ii) at the beginning of rainfall season; (iii) during a storm event; (iv) after a rainfall event and (v) the end of a rain season. Samples taken at the beginning of the rainfall season and during a storm event had more sediment material (dark brown in colour) compared to the rest. The samples taken during the low flows, dry winter season, were clear and void of sediments. From these visual observations, the smallholder farmers appreciated the fact that there was a relationship between the type of land cover on their farms, rainfall intensity and the sediment load, the latter being an indicator of loss of good fertile soil. This aspect was further reinforced through quantitative results which were graphically presented to the community during farmer’s field days. The communication and feedback mechanism that was used in this study is highlighted in Sect. 4 of this paper. 3.6
Climatic parameters
Rainfall is clearly the main parameter that drives the hydrological cycle in a catchment, hence the need to observe its occurrence accurately, both spatially and temporally. Manual raingauges, if well managed, can provide relatively accurate daily rainfall data in a catchment and their affordability, availability and the ease of installation and operation makes them attractive, especially to smallholder farmers. After a reconnaissance survey in the catchment, several potential sites (homesteads) were identified in the Potshini community where manual raingauges were to be installed. The family members in these homesteads were then approached, beginning with the head of the homestead, to seek permission and the goodwill from the members of the homestead to permit the installation of the manual raingauges, and most importantly, to take daily rainfall readings at locations as shown in Figs. 1 and 3. A rainfall data recording booklet, translated into the local language – IsiZulu, was provided to Hydrol. Earth Syst. Sci., 14, 2507–2525, 2010
2516
V. M. Kongo et al.: Establishment of a catchment monitoring network through a participatory approach
the identified households and training to record and keep the daily rainfall records undertaken. The smallholder farmers recorded rainfall twice a day, i.e. at 09:00 h and 17:00 h, from which the total daily rainfall was computed as the sum of the morning and evening readings. One of the profound statements made by one of the smallholder farmers who participated in monitoring rainfall in the catchment using a manual rain gauge was the fact that he was now in a position to tell, in quantifiable terms, how much it had rained and confidently share this information with his peers, unlike before he had a rain gauge. One of the main factors that determine the planting date of the maize crop in Potshini, the main food source in the community, is the onset of rainfall. Farmers have been advised by the extension personnel in the district Department of Agriculture that they should sow their seeds after receiving a cumulative of 30 mm of rainfall. Thus, this underpins the importance which the most of the community members attach to monitoring of rainfall but which had previously been perceived as too difficult or complicated to undertake. The peer to peer learning and engagement process on rainfall monitoring in the Potshini community paid dividends when some of the other smallholders bought their own raingaguges and requested the SSI researchers to facilitate their installation and data recording. It was interesting to note the enthusiasm, in most community members, in participating in the monitoring of rainfall after the SSI researchers highlighted the fact that the daily television weather bulletin uses similar rainfall measurements to generate information on the distribution of rainfall in the country. Such an understanding increased the enthusiasm of the community members and engendered a feeling of importance of the monitoring exercise at both village and national level, and in fact raised hopes of hosting a national monitoring station in their midst. The daily rainfall data was collected from the smallholder farmers by the SSI researchers on a weekly basis, during the rainfall season, and incorporated in a database for the Potshini catchment. Thus, voluntary participation of the local community in data collection promoted the philosophy of participatory catchment monitoring to the Potshini community as envisioned in the SSI research programme. Rainfall data from the manual raingauges were augmented by climatic records from two automatic weather stations installed in the two nested Potshini catchment (cf. Fig. 1). One of the weather stations was installed in 2005 in the middle of the village (community weather station) and upstream of an existing telemetric weather station which was operational since 2002 on a nearby commercial farm and managed by the Agricultural Research Council (ARC) of South Africa. In 2007, a rainfall collector was attached to the automatic raingauge in the community weather station to collect rainwater for analysis of isotopic composition of 18 O and 2 H. The collector comprised six-400 ml bottles which filled sequentially during a rainfall event and is designed to prevent evaporation of the collected samples. The community members assisted Hydrol. Earth Syst. Sci., 14, 2507–2525, 2010
Drainage channel Tipping bucket
Fig. 8. A set of runoff plots under different treatments in a farmermanaged trial.
in storing and labeling of the rainwater samples after a rainfall event and emptied the bottles to allow fresh rainwater samples to fill the bottles during a subsequent rainfall event. Since its installation, the weather station in the middle of the village was maintained by the local Potshini community, including fencing of the station and maintaining tidiness within and on the surrounding area. Fencing of the weather station was necessary to safeguard the instrumentation against the cattle which grazed freely, especially during the dry winter season. Otherwise the security of the weather station was entrusted to the local community, through the traditional leadership of the community and the goodwill generated by the participatory engagement of the Potshini community and other stakeholders at the initial stages. The climatic data from these two stations was accessible to researchers in the ARC, the SSI programme and any other interested stakeholder. 3.7
Runoff plots
One of the research themes in the SSI research programme was aimed at investigating the hydrological processes and determine water balance in smallholder farmers’ fields (