our methodology using the change management process as defined in IBM Tivoli Unified Process (ITUP) and estimating the business value of implementing an ...
Estimating Business Value of IT Services through Process Complexity Analysis Yixin Diao, Kamal Bhattacharya IBM Thomas J. Watson Research Center P.O. Box 704, Yorktown Heights, NY 10598, USA Email: {diao|kamalb}@us.ibm.com
Abstract— In this paper we propose a methodology to estimate business value of IT services. We investigate how to apply quantitative studies for IT service management processes that allows us to link measurable performance improvements with concrete business value. Specifically, we follow an Information Technology Infrastructure Library (ITIL) defined strategy combined with process complexity analysis techniques. This helps to reason about inefficiencies in IT service processes due to problems with coordination of different roles, lack of support for task execution, and complexities for getting the source of information. Our approach consists in (1) identifying the process context using ITIL as a reference framework, (2) quantifying process baseline with typical task execution time and underlying complexity, (3) estimating performance improvement achieved by tooling deployment or process transformation, and (4) estimating business value derived for various business cases. We illustrate our methodology using the change management process as defined in IBM Tivoli Unified Process (ITUP) and estimating the business value of implementing an application discovery tool and a change management tool.
I. I NTRODUCTION Operational costs for managing Information Technology (IT) over the last decade have been constantly increasing despite a significant decrease in infrastructure cost. In 2004 IDC has predicted a 4.93% growth in IT budgets mostly due to an increase of operational labor spend of about 10% from 20032008. The root cause of operation inefficiencies are often attributed to the complexity of IT infrastructure. Any enterprise of today maintains a large application portfolio, often grown historically, with many redundancies and decreasing visibility into the degree of interconnections between applications and hardware components. The complex IT landscape has also lead to a proliferation of domain specific technologies, e.g., server management, application management, storage management, etc. which created vertical silos of expertise. The promise of Information Technology Service Management (ITSM) is to reduce the complexity of managing IT infrastructure by engaging a process-centric approach that allows for operational innovation and horizontal integration of the aforementioned vertical silos. Several reference frameworks such as Control Objectives for Information and related Technologies (COBIT) [1] or the IT Infrastructure Library (ITIL) [2] provide guidance in moving towards a coherent service management approach. For example, ITIL provides best practices around the areas of Service Operation, Design, Transition, and Strategy. A service in ITIL is an entity that
provides value-add to a customer. Service management in the ITIL sense is a set of specialized organizational capabilities for adding value to a customer through services. The notion of services as being a means to add value to a customer is a notion that applies to both business services and IT services; often, the boundaries between the two are blurred. IT service providers run a rather low margin business. For example, profit from outsourcing IT operations across the industry hardly ever exceeds 6-8%. Service providers move the outsourced operations of their clients and maintain their profit levels by managing the steady state as efficient as possible with inherited client infrastructure and processes. One of the key sources of disappointment from ITIL engagement, as analyzed by Forester, is unrealistic Return on Investment (ROI) expectations for investments made to improve operational efficiency. Whether a service provider invests into IT management products to improve specific operations or invests into development of point applications, there is a lack of understanding how the investments will come to fruition and add to the bottom line of the service providers. There are several factors contributing to this problem. First, each IT service in an IT organization is part of a larger value network. As today’s IT service providers have very little visibility on their entire value network, it is hard to gauge the impact of singular process improvements. Second, there is a lack of understanding on how to analyze the scope within which investments should be made. The service providers typically buy a rich software package that most likely captures a much broader range of capabilities than actually required to improve the user problems. This large capability set blurs the impact horizon and makes it difficult to identify the key business value. In previous work [3], we have introduced a framework for measuring the complexity of IT system configuration, which has been subsequently extended to quantify the complexity occurred in IT service management processes [4]. This framework defines complexity along several dimensions including execution, coordination, information, and memory. For example, the execution complexity is characterized by the number of tasks and context switches between tasks, as well as the degree of automation: automatic, tool-assisted, and manual. Furthermore, in [5] we have developed a quantitative model that relates the collected complexity metrics to key businesslevel performance metrics such as labor time.
978-1-4244-2066-7/08/$25.00 ©2008 IEEE Authorized licensed use limited to: UNIVERSIDADE FEDERAL DO PARANA. Downloaded on October 28, 2009 at 16:49 from IEEE Xplore. Restrictions apply.
208
Identify Process Context
Fig. 1.
Complexity Analysis
Product/Asset Capabilities
Business Scenario
Prepare Baseline Quantification
Estimate Process Improvement
Estimate Business Value
Value estimation methodology.
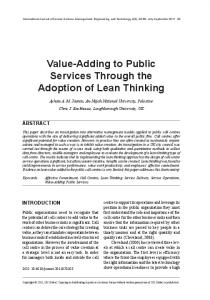
This paper extends our earlier work in two directions. First, we propose a complete value estimation methodology that starts from identifying the service process context and ends at providing business value estimation on how the financial bottom line can be impacted. Second, in the intent of establishing a repeatable and scalable methodology, we present a streamlined process analysis method that requires less inputs from the service process. As depicted in Figure 1, the first step in our value estimation methodology is to identify the process context under which the target IT service management product is evaluated. We follow an Information Technology Infrastructure Library (ITIL) defined strategy which covers the whole spectrum of IT service management. In this paper, we use IBM Tivoli Unified Processes framework (ITUP) [6] as a context to identify the service management processes that the target service product is likely to impact. ITUP is a freely available process framework that specifies ITIL processes to a greater level of detail. The latest release of ITUP is compliant with ITIL V3. Next, we prepare the baseline quantification. We use the process complexity analysis techniques introduced in [4] as a basic method. However, we explore the hierarchical process structure defined in ITUP, and interlace complexity analysis with execution time estimation so that we do not need to evaluate all tasks in the service process. Focusing on key aspects of the process reduces the overall time for baseline quantification, and we are still able to roll up the process-wide quantification through the hierarchical process structure. The third step in our value estimation methodology is to estimate process improvement due to the introduction of new service product. We can still use the regression model developed in [5] to correlate labor time with complexity metrics. However, this requires a large set of time measurement data, which are typically difficult to get in practice. Instead, we propose a simplified model that directly gives process improvement estimation based on complexity reduction. Finally, we derive business value estimation that is based on various business cases such as labor cost reduction, service fulfillment savings, and service quality improvement. The remainder of this paper is organized as follows. Section II details our approach for estimating the business value of IT service investment. In Section III, we apply our methodology to the change management process and estimate the business value of implementing an application discovery tool and a change management tool. Section IV reviews related work. Our conclusions are contained in Section V.
II. P ROCESS -C ENTRIC B USINESS VALUE E STIMATION In this section we discuss our methodology to estimate the business value of IT services through process complexity analysis. This methodology leverages the previously defined process complexity framework [4], and proposes a means to analyze customers’ business problems. Through complexity analysis and value estimation, it tights the perceived business value of IT investment with concrete IT operation tasks and their respective changes. We start from identifying the process context using ITUP as a reference framework. Then we use complexity analysis techniques to estimate the process baseline and spot complexity bottlenecks. Afterwards, we identify product capabilities to alleviate pain points and estimate the associated improvements. Finally, we evaluate business use cases to estimate the business impact of the process investment. This methodology is also illustrated in Figure 2 with respect to the involved metrics and their relationships. A. Process Context Identification Imagine being a consultant that assists in identifying operational inefficiencies in an IT service delivery center. Typically, the service provider will have a broad sense in which area they want to improve, for example, change management. What is a good consulting approach to further dig into the change management process? One approach in the IT service management space is to take guidance from industry best practices such as ITIL or COBIT. ITIL in particular is at its core a process framework. Each area of service management is broken down into a set of processes, which are described at a high level of abstraction to convey to essence of the service management tasks at hand. Our method leverages process frameworks such as ITIL to identify the areas of interest, however, is indenpendent of the concrete method framework. In this paper, we have chosen the IBM Tivoli Unified Process (ITUP) framework as a reference framework. ITUP specifies ITIL V3 processes to a greater level of detail by maintaining fully compliant to ITIL V3. The reasoning behind our choice was merely driven by the familiarity of our subject matter experts with ITUP. ITUP is a process framework that decomposes different service management areas into a set of (interconnected) processes and provides a work break down structure for each process. The process models in ITUP are, even at the lowest level of description, high-level, i.e. they are designed to be agnostic to specific implementations. In the interest of providing quantitative process analysis that reveals business gains from new service product, we apply a hybrid approach that identifies the process context. As shown in Figure 2, at the high level, we use ITUP to represent the overall structure of a process. Although the actual process used by the service provider may be different to the ITUP process and some service providers may not have their processes explicitly modeled, using ITUP as a high level best practice still allows us to reason about the service provider processes in a consistent means. Furthermore, at the low level, we resort
209 Authorized licensed use limited to: UNIVERSIDADE FEDERAL DO PARANA. Downloaded on October 28, 2009 at 16:49 from IEEE Xplore. Restrictions apply.
ITUP PROCESSES
Baseline
Coordinate Accept & categorize
Performance Metrics
Assess Change
Review & Close
Approve & Schedule
Level 1
Distribute Best Practice
Complexity Metrics
Impacted Complexity
PRODUCT PRODUCT
Level 2
Perform Preliminary Assessment
Identify Assessment Level
Review RFC
Assess Technical Impact Consolidate
Close Assessment
Assess Business Impact
Performance Improvement
Business Value
Fig. 2.
Process-centric business value estimation.
to technical consultants who have worked for many years in the IT service management field to fill up the knowledge that matters for actual process implementation. Specifically, we collect a set of key questions that need to be answered in order to complete the tasks in the ITUP process. These questions are still in the generic sense and applicable to different service providers, but the way how they are being answered depends on the service provider’s specific environment and the type of tools and service products being used. We illustrate the above discussion using a change management process as shown in Figure 3. The first two levels of abstractions are provided in ITUP as best practices for the change management process. Level 1 shows the overall change management process composed of six subprocesses. On Level 2, we illustrate the breakdown of the Assess Change subprocess. (In the interest of space the breakdowns for other subprocesses are omitted here.) On Level 3, we illustrate six typical questions to be answered by the Assess Business Impact task. These questions represent the field knowledge from experience technical consultants. Through this way, we structure the IT operations so that they can be mapped to generic ITUP processes, as well as provide enough details to eventually reason about productdriven improvements. This structured analysis provides the basis for our methodology to focus on the key aspects in a process and start the complexity analysis to establish the process baseline. Without such a structure, a consultant can still conduct a Level 3 analysis, but is more likely to either involve in trivial details or oversight important aspects. B. Process Baseline Quantification Using Complexity Analysis We quantify the process context identified above using complexity analysis techniques. Specifically, we aim to establish a quantitative baseline to be used as a basis to evaluate process improvement. By baseline, we mean a typical walk-through of the process using common practice and prevailing tools that are generally used by most service providers. Since different service providers indeed practice the process differently, we will discuss how to customize the baseline in the next section when we conduct process improvement estimation.
Level 3
Fig. 3.
Impacted services
Downtime risk
Change Windows
SLA Document
SLA Penalty
Field Knowledge
Customized Complexity
CUSTOMER PRODUCT
Downtime protocol
A hierarchical structure of the change management process.
Our complexity analysis techniques are based on the IT process complexity framework defined in [4]. We briefly summarize the major complexity metrics as follows. Execution Complexity refers to the complexity involved in performing the tasks that make up the service process, typically characterized by the number of tasks, the context switches between tasks, the number of roles involved in a task, and their degree of automation. Coordination Complexity represents the complexity resulting from coordinating between multiple roles, either within a task or between tasks, and depend on how business items are transferred and processed. Information Complexity (a.k.a., Business Item Complexity) addresses the complexity involved in providing data into the service process, and is quantified through how the values were obtained. Table I lists information source complexity indicated by a unit-less value representing the complexity of supplying information to service processes. Each information item is assigned a source complexity, based on the source that provides the data, which are chosen from one of source types given in Table I. For each source type, a score value is assigned according to a weighting scale of different source complexities. Given the scope of the process, a complete complexity analysis can be a fairly involved process. We mitigate the “complexity” of conducting complexity analysis by focusing on the most important pain points in the process. This helps to pursue substantial benefits out of the limited amount of time working with subject matter experts. The mitigation is achieved through the following two means. First, we explore the hierarchical process structure defined in ITUP and decide which parts of the process (i.e., subprocesses, tasks) need complexity analysis. We achieve this prioritization by looking at performance metrics, such as execution time and error rate, which are more close to business interest and value. Typically, we use execution time since it is the easiest metric that is either recorded or can be estimated by technical consultants with less extra effort and reasonable accuracy. Furthermore, we capture the execution time as a percentage relative to the overall turn-around time. This not only makes the estimation easier (compared to asking for the exact
210 Authorized licensed use limited to: UNIVERSIDADE FEDERAL DO PARANA. Downloaded on October 28, 2009 at 16:49 from IEEE Xplore. Restrictions apply.
TABLE I I NFORMATION SOURCE COMPLEXITY. Source Type internal
Score [0]
freeChoice
[1]
documentationDirect
[2]
documentationAdapted
[3]
bestPractice
[4]
environmentFixed
[5]
environmentConstrained [6]
Description if the information value is automatically provided by the system/process. if the information value can be chosen freely. if the information is taken directly from the documentation. if the information value is extrapolated indirectly from the documentation. if the information value is not from documentation but obvious to a service personnel versed in the service domain. if the information value depends on the environment and needs to be selected to a specific value. if the information value depends on the environment and needs to be selected with further research from a set of choices.
time which can be different for different service environment and different service request volume), but naturally presents the pain points on which we want to focus complexity analysis and reveal process improvement. For example, in the change management process shown in Figure 3, we find from Subject Matter Experts (SMEs) that the Asses Change subprocess takes about 35% of the overall turn-around time, and the Assess Business Impact task takes about 35% of the overall execution time for the Asses Change subprocess. This implies the Assess Business Impact task as a pain point, and we can consequently conduct complexity analysis to find out more about this task. Second, when we conduct complexity analysis, we focus on information source complexity (and omit other types of complexity) if the sake of process evaluation time is of concern. As illustrated in Figure 3, we assess the complexity of supplying the answers to the six questions listed on Level 3, corresponding to the Assess Business Impact task. This is aligned with our experience that information complexity typically is the largest opportunity for improvement. We have also conducted experiments to compare the results from correlating execution time reduction with only the information complexity metric versus with all complexity metrics. We will discuss in the next section on process improvement estimation. In summary, as shown in the dashed box in the upper right corner of Figure 2, we quantify process baseline through both complexity metrics and performance metrics. By exploring the hierarchical process structure defined in ITUP, we simplify the complexity analysis work and yet generate a baseline quantification that can be used to estimate process improvement. C. Product Capability Mapping and Process Improvement Estimation The third step in our value estimation methodology is to estimate process improvement. We go through the tasks
Baseline Information Complexity
5
6
3
3
3
5
Level 3
Assess Impacted services
Assess Downtime risk
Identify Change Windows
SLA Analysis
SLA Penalty
Identify Downtime protocol
Impacted Information Complexity
0
5
3
0
0
0
Product Capability
Business Topology Viewer
SLA Manager
SLA Manager
Fig. 4.
Risk Assesser
N/A
Score: 25 Time: 35%
Score: 8 Time: 11% (8/25 x 35%)
Communication Template
Product capability mapping and its impact on complexity scores.
identified in the previous steps, and study how the evaluated product can affect the task complexity and which functionality contributes to this impact. This step is typically carried out through collaboration with the SMEs who are knowledgable in actual benefit of product capabilities. Estimating product impact is conducted by comparing the (previously assessed) scores for the baseline information complexity and the impacted complexity scores due to the introduction of a product capability. Figure 4 illustrates complexity analysis for the six Level 3 questions from the Assess Business Impact task. The first question is what are the business services impacted by the change. For example, if a network router firmware is to be updated, the service personnel need to find out its dependencies to related business applications. Based on Table I, we assign an information complexity score of [5], environmentFixed, to the baseline. This indicates the impacted business services depend on the specific service delivery environment. Similarly, for the second question on what is the risk of the business service not being available, we assign a score of [6] since getting this information required “further research” to consider a set of choices. Suppose we are evaluating a change management product that has a capability to show the change dependencies through a business topology viewer. This will significantly reduce the complexity of answering the above question since the impacted business services are ready to know from the business topology viewer. Thus, the information complexity is reduced to [0], internal. Other capabilities such as SLA management and communication template have also significantly driven down the information complexity for other questions. Next, we estimate performance improvement. Although we can still use the regression model proposed in [5] to correlate execution time with complexity metrics, this requires both a large set of measured execution time and collecting all complexity metrics, which may be time-consuming to obtain. (But note that if situation permits, taking this regression modeling approach will yield more accurate performance improvement estimation.) Instead, we propose a simplified model by assuming the performance related saving is proportional to information complexity reduction. The approach is mathematically formulated as follows. 1) Collect performance metrics for the baseline. That is, tm , the execution time for task m as a percentage relative to the overall turn-around time. 2) Define the information complexity for the baseline. That is, cm , the information source complexity score summed over from all information items required in task m. The
211 Authorized licensed use limited to: UNIVERSIDADE FEDERAL DO PARANA. Downloaded on October 28, 2009 at 16:49 from IEEE Xplore. Restrictions apply.
complexity score for each information item takes a unitless value from 0 to 6 as defined in Table I. 3) Define the information complexity from introduction of product j. Similar to the step taken in 2), this gives cjm for task m and product j. 4) Compute performance related saving from product j. For task m, the execution time after introducing product j is calculated as cj (1) tjm = m tm cm Thus, the performance related saving of process n with M tasks is �M tjm j (2) pn = 1 − �m=1 M m=1 tm where we consider the hierarchical structure of the process and roll up each task execution time accordingly. As an example, consider the task depicted in Figure 4, the overall complexity score for the baseline is 25 and the score for the product supported process is 8. Note that in our previous section we estimate the execution time for the Assess Business Impact task as 35% of the overall Assess Change subprocess. By assuming a linear correlation, the execution 8 × 35% = 11%. time after product introduction is 25 Assuming the performance related saving is equal to reduction in information complexity greatly simplifies the required work on collecting the complexity metrics and execution time. Besides the belief from technical consultants that most service complexity comes from acquiring and delivering necessary information, we further study the validity of this assumption using data collected from several service processes. First, in an ITCAM installation process [5], among the ten complexity metrics defined, we find information source complexity is the most dominant metric that captures 46% of labor time variation (compared to 61% if all ten complexity metrics are used to build the regression model). Furthermore, adding the second most dominant metric, Memory Additions, only affects the R2 error by 5%. Second, in another process called project fulfillment (staffing outsourced IT projects from a pool of system administrators with different skill profiles), information source complexity remains the most important complexity metric and yields 61% modeling accuracy compared to 70% when all complexity metrics are being used. Similar results have been obtained in several other complexity evaluation projects that we have engaged. We have two remarks on process improvement estimation. First, in the case where we need to consider multiple products and their joint impact on the process, we can use min(.) at the information item level to consider what would be the lowest information complexity score that we can get out of by using this set of products. Second, since the actual service provider’s process may be different to the ITUP best practice process, we can customize the baseline by changing the estimated baseline performance metrics. For example, if one specific task is not executed at all, then its corresponding performance metric is set to zero. In the case where certain automation tools have
been deployed in the service environment, we can also change the complexity scores to actually reflect this difference at a more detailed level. In summary, Figure 2 illustrates the metrics used in the process improvement estimation step. As shown by the dashed box in the bottom right corner, we calculate performance improvement from three sources: baseline performance metrics (e.g., execution time percentage), impacted complexity that reflects the impact from the evaluated product, and customized complexity that reflects the difference between the ITUP baseline process and the actual process used by customers. D. Business Value Estimation Business impact analysis is viewed as one of the most challenging work in IT service management for two main reasons. First, many IT processes are part of a larger value chain and have indirect impact on the financial bottom line. Second, there is a lack of understanding on how product capabilities are solving the service problems. The second problem was addressed in previous sections by relating product capabilities with complexity metrics that reflect fundamental service problems. In this section, we address the first problem by laying out business cases and linking the business value with process improvement. We consider several business cases for value estimation. The simplest one is labor cost reduction, which is directly linked with the execution time reduction, plus additional knowledge on the overall execution time and the relevant salary information. Furthermore, by viewing complexity reduction as the fundamental reason for process improvement, we can apply our value estimation methodology to other business cases such as service fulfillment savings and service quality improvement. Savings in service execution time not only saves the labor cost of delivering the services, but reduces the service fulfillment time for the customers. This can be converted to financial impact on avoiding service agreement violation and getting incentives for completing the services earlier. In addition, we extrapolate process improvement to evaluate service quality improvement. Consider that reducing task complexity also has the benefits of reducing the error rate, for example, the number of incidents caused by improperly handled change requests. By assuming a linear relationship between complexity reduction and incident reduction, we have a first order estimation on the business value from service quality improvement. Continuing with the performance related savings pjn defined in the previous section, we can formulate business value estimation as follows. • Labor cost reduction: We define the business value out of labor cost reduction through the following. j
L
lnj Δtjn
= = =
N �
lnj
n=1 Δtjn sn tn pjn
(3) (4) (5)
212 Authorized licensed use limited to: UNIVERSIDADE FEDERAL DO PARANA. Downloaded on October 28, 2009 at 16:49 from IEEE Xplore. Restrictions apply.
•
where pjn denotes the percentage of performance related savings (over the baseline) for process n from product j. Given tn as the per-year full time equivalent (FTE) for process n, we can obtain the corresponding time reduction Δtjn . Furthermore, by getting the salary information sn , we can compute lnj as the labor cost savings for process n from product j. Thus, the overall value for labor cost reduction comes from summing up the savings from all the processes impacted by product j. General business case: Next, we define business value estimation in a more general case that covers service fulfillment savings, service quality improvement, or other cases. Vj fnj
=
N � �
�
Φ(fnj ) − Φ(fn )
(6)
n=1
=
� � fn 1 − pjn
(7)
where pjn denotes the percentage of performance related savings, fn denotes the baseline business metric (e.g., service fulfillment time, number of incidents), and fnj denotes the improved business metric which is computed through the linear correlation. By considering a function Φ that converts business metric into revenue, we can estimate how process improvement has impacted the financial bottom line. III. E VALUATION In this section we apply our methodology to the change management process and estimate the business value of implementing an application discovery tool and a change management tool. The application discovery tool provides an automated solution to create application topology and discover complex dependencies between infrastructure components. The change management tool provides a planform for managing change requests and configuration items, and integrating data and workflows for a consolidated view of changes. Although the impact of the above two products can be observed in multiple ITUP processes, for the illustrative purpose, in this paper we only use the change management process as an example to show how our methodology can be used to provide business value estimation that arises from tangible IT service processes and specific product capabilities. A. Baseline Quantification We start from using ITUP as the framework to identify process context. Figure 5 shows the high level workflow of the change management process. We focus our analysis on the six subprocesses in the left part of the workflow, which are executed for each change request. As shown in Table II under the Baseline column, the execution time is estimated by the Subject Matter Experts (SMEs), and listed as a percentage relative to the overall turn-around time of the change management process. This helps to identify the subprocesses that comprise the major part of the turn-around time for further decomposition and analysis. (Note that P1
Fig. 5.
Change management process from the ITUP framework.
TABLE II S UBPROCESS EXECUTION TIME AS A PERCENTAGE RELATIVE TO THE OVERALL TURN - AROUND TIME OF THE CHANGE MANAGEMENT PROCESS .
1 2 3 4 5 6
Subprocesses in Change Management Accept and Categorize Change Assess Change Approve and Schedule Change Coordinate Implementation Prepare, Distribute, and Install Change Review and Close Change
Baseline 5 35 15 30 5 10 100%
P1 5 25 15 30 5 10 90%
P2 5 14 15 15 5 10 64%
and P2 in Table II refer to the application discovery tool and the change management tool, respectively; their corresponding columns are the results from process improvement calculation and will be discussed later.) Since Table II identifies Assess Change and Coordinate Implementation are the two most time consuming subprocesses, we narrow down to these two subprocesses. As an example, Figure 6 shows the Assess Change subprocess from ITUP. Table III lists the task execution time, estimated by the SMEs, as a percentage relative to the overall turn-around time of the Assess Change subprocess under the baseline column. (Again, we will discuss the P1 and P2 columns later.) We conduct process complexity analysis at the task level, specifically, for the tasks that take a major part of execution time. Table IV lists the information source complexity as a 0 to 6 unit-less score for the Assess Business Impact task (which takes 35% of the turn-around time within the Assess Change subprocess as shown in Table III). B. Performance Related Savings In contrast to baseline quantification, we estimate product improvement using a bottom-up approach, starting form information complexity and working backwards. This basically means to fill up the P1 and P2 columns in Table IV first.
213 Authorized licensed use limited to: UNIVERSIDADE FEDERAL DO PARANA. Downloaded on October 28, 2009 at 16:49 from IEEE Xplore. Restrictions apply.
time savings using a linear approximation. For example, consider the Assess for Business Impact task as shown in Table IV, the overall complexity score is 25 for the baseline and 20 for the application discovery tool (P1). As shown in Table III, since the baseline for the Assess Business Impact task is 35%, the execution time after introducing P1 is 20 25 × 35% = 28%. Overall, compared to the baseline P1 will need 73% of time to complete the Assess Change subprocess. Finally, we aggregate the time savings into the process level. For the example of the Assess Change subprocess, note that the baseline time is 35%. The time affected by Product 1 will be 35×73% = 25%. In summary, as shown in Table II, compared to the baseline, we estimate the application discovery product (P1) will yield a 10% performance related savings, and the change management tool (P2) will yield 36% savings. Fig. 6.
Assess change subprocess from the ITUP framework. TABLE III
TASK EXECUTION TIME AS A PERCENTAGE RELATIVE TO THE OVERALL TURN - AROUND TIME OF THE ASSESS CHANGE SUBPROCESS . Tasks in Assess Change Perform Preliminary Assessment Identify Level of Assessment Make RFCs Available for Assessment Assess for Business Impact Assess for Technical Impact Collect Results and Issues
1 2 3 4 5 6
Baseline 10 5 5 35 35 10 100%
P1 10 5 5 28 15 10 73%
P2 10 5 5 11 0 0 41%
For example, the complexity of answering the first question, what are the business services impacted by this change, can be alleviated through the application discovery tool (P1) since it has a capability to show the change dependencies through a business topology viewer. This gives an information complexity score of [0], internal, as the information is automatically provided by this service product and no manual work is further required. The change management tool (P2) also reduces the complexity for the fourth information item (identifying the SLA for the business service) to [0] through its SLA management capability. Next, we roll up the complexity reduction into execution TABLE IV I NFORMATION SOURCE COMPLEXITY AS A 0 TO 6 UNIT- LESS SCORE FOR THE
1 2 3 4 5 6
A SSESS B USINESS I MPACT TASK .
Information Items Impacted Business Services Risk of Unavailable Business Services Predefined Change Windows Business Service SLA SLA Penalties Change Problem Handling
Baseline 5 6 3 3 3 5 25
P1 0 6 3 3 3 5 20
P2 0 5 3 0 0 0 8
C. Business Value We consider the following three business cases as examples of calculating the business value from improving the service process. 1) Labor Cost Reduction: Consider a business case where the service provider is interested in deploying a new application discovery tool to help improve the efficiency of its change management process and reduce the corresponding labor cost. First, the service provider needs to obtain the baseline; for example, it is found that its change management process requires five full time equivalent (FTE) per year. As calculated in Table II, the application discovery tool (P1) has a 10% performance related saving. This gives a 0.5 FTE reduction (Δtjn = 5). Assume the FTE salary is $100,000 per year (sn = 100, 000), the business case will be $50,000 savings. 2) Service Fulfillment Savings: Consider another business case where the service provider’s revenue is partially related to how long the customer’s change requests can be fulfilled; by deploying an application discovery tool the service provider expects to see a profitable growth in revenue. Suppose the current change management process has an average change request fulfillment time of 20 days (fn = 20). By using a linear correlation from the 10% performance related saving of Product 1, this brings the to-be change request fulfillment time to 18 days (fnj = 18). Assume a linear revenue function Φ that yields $200 returns per one day reduction, and there are 500 change requests per year. The business case will be $200,000. 3) Service Quality Improvement: We can further extrapolate the estimation to service quality improvement. Suppose the current number of incidents caused by improper changes is 100 (fn = 100) per year, as is an average for several service delivery accounts we experienced. If in the to-be process the change management product (P2) has a 36% performance related saving, this brings the to-be incidents to 64 (fnj = 64). Also assume a revenue function Φ that has $10,000 cost per one instance. The business case will be $360,000 savings.
214 Authorized licensed use limited to: UNIVERSIDADE FEDERAL DO PARANA. Downloaded on October 28, 2009 at 16:49 from IEEE Xplore. Restrictions apply.
IV. R ELATED W ORK Our methodology is inspired by the widely successful system performance benchmark suites defined by the Transaction Processing Council (TPC) and the Standard Performance Evaluation Corporation (SPEC). In addition, we have borrowed concepts from Robert C. Camp’s pioneering work in the area of business benchmarking [7]. Recent related work in this area is McKinsey & Company’s Process 360, a benchmark comparing IT service offerings among different providers [8]. There is increased interest in IT service management (e.g., [9], [10]), especially on aligning IT with business objectives [11] [12]. The linkage between business and IT has also been studied in management science (e.g., [13], [14]). The quality management methodologies successfully used in manufacturing and production are applied to IT services recently [15][16]. The ITIL best practices have also been used to identify opportunities for IT management automation [17]. A recent trend in business analysis is Network Value Analysis (e.g. [18], [19]). Since an IT service provider runs many services that are interconnected with each other, the intent of network value analysis is to understand how the value is being delivered across various paths of the network. Related work in the system administration discipline has been carried out with a focus on establishing cost models [20][21][22]. V. C ONCLUSIONS AND F UTURE W ORK In this paper we have proposed a methodology to assess business value from IT service management products. We have presented a repeatable and scalable approach that follows ITIL defined strategy combined with quantitative complexity analysis techniques. The proposed methodology analyzes the business value from the view point of complexity reduction, and can be used on different process frameworks and business cases. Although the change management process is used throughout the paper, the proposed method can be applied to other IT or business processes. For example, in incident management or problem management, a less complex process will generally lead to faster response and less service disruptions. The proposed method is also relatively easy to apply due to its focus on evaluating key process tasks. Not necessarily an exact prediction, our approach provides a reasonable estimate by going into the depth of the ITIL service process and evaluating business value in the context of specific product capabilities and complexity based quantitative metrics. The importance of this methodology is to alleviate the risks of unrealistic ROI expectations, and provide guidance to consultants and decisions makers on their investment focus. It also helps ITSM solution providers to reason about shortcomings of their product portfolio. The challenges ahead of us can be summarized as follows. First, we believe there are more sources of complexity than the ones we have characterized so far. Examples include the inherent complexity of data access, dependencies of working with different spreadsheets, and federation of heterogenous data sources. Second, we would like to connect our methodology with business value chain for calculating value dissemination
within the IT service networks. Finally, our current approach to provide product capability mapping is in its early stage. We are investigating how to provide an automated decision system to guide a consultant through product decisions in the context of processes rather than assuming deep product knowledge. R EFERENCES [1] “COBIT 4.1,” IT Governance Institute , 2007. [2] “IT Infrastructure Library. ITIL Service Support, version 2.3,” Office of Government Commerce, June 2000. [3] A. Brown, A. Keller, and J. Hellerstein, “A Model of Configuration Complexity and its Application to a Change Management System,” in Proceedings of the 9th IFIP/IEEE International Symposium on Integrated Management (IM 2005), A. Clemm, O. Festor, and A. Pras, Eds. Nice, France: IEEE, May 2005, pp. 631–644. [4] Y. Diao and A. Keller, “Quantifying the Complexity of IT Service Management Processes,” in Proceedings of the 17th IFIP/IEEE International Workshop on Distributed Systems: Operations and Management (DSOM 2006), Dublin, Ireland, Oct. 2006, pp. 61–73. [5] ——, “Predicting Labor Cost through IT Management Complexity Metrics,” in Proceedings of the 10th IFIP/IEEE International Symposium on Integrated Management (IM 2007)), Munich, Germany, May 2007. [6] “IBM Tivoli Unified Process (ITUP): Connecting the Dots,” Enterprise Management Associates, 2006. [7] R. Camp, Benchmarking - The Search for Industry Best Practices that Lead to Superior Performance. ASQC Quality Press, 1989. [8] N. Kaka, S. Kekre, and S. Sarangan, “Benchmarking India’s Business Process Outsourcers,” The McKinsey Quarterly, July 2006. [9] J. A. Fitzsimmons and M. J. Fitzsimmons, Service Management: Operations, Strategy, and Information Technology. McGraw-Hill, 2001. [10] A. Hochstein, R. Zarnekow, and W. Brenner, “ITIL as common practice reference model for it service management: Formal assessment and implications for practice,” in Proceedings of the IEEE International Conference on e-Technology, e-Commerce and e-Service, Hong Kong, China, 2005, p. 704710. [11] V. Machiraju, C. Bartolini, and F. Casati, “Technologies for businessdriven IT management,” Extending Web Services Technologies: the Use of Multi-Agent Approaches, L. Cavedon et al. (eds.), Kluwer Academic, vol. 43, no. 1, pp. 1–28, 2005. [12] M. J. Buco, R. N. Chang, L. Z. Luan, C. Ward, J. L. Wolf, and P. S. Yu, “Utility computing SLA management based upon business objectives,” IBM System Journal, vol. 43, no. 1, pp. 159–179, 2004. [13] B. H. Reich and I. Benbasat, “Measuring the linkage between business and information technology objectives,” MIS Quarterly, vol. 20, no. 1, pp. 55–81, 1996. [14] T. Mukhopadhyay, S. Rajiv, and K. Srinivasan, “Information technology impact on process output and quality,” Management Science, vol. 43, no. 12, pp. 1645–1659, 1997. [15] G. Tennant, Six Sigma: SPC and TQM in Manufacturing and Services. Gower Publishing, Ltd., 2001. [16] B. El-Haik and D. Roy, Service Design for Six Sigma - A Roadmap for Excellence. Wiley Interscience, 2005. [17] A. B. Brown and A. Keller, “A best Practice Approach for Automating IT Management Processes,” in Proceedings of the 10th IEEE/IFIP Network Operations and Management Symposium (NOMS 2006), Vancouver, Canada, Apr. 2006. [18] J. Peppard and A. Rylander, “From value chain to value network: Lessons for mobile operators,” European Management Journal, vol. 24, no. 2, pp. 55–81, 2006. [19] H. Karkkainen and J. Hallikas, “Decision making in inter-organisational relationships: Implications from systems thinking,” International Journal of Technology Management, vol. 33, no. 2, 2006. [20] A. Couch, N. Wu, and H. Susanto, “Toward a Cost Model for System Administration,” in Proc. 19th Large Installation System Administration Conference, D. Blank-Edelman, Ed. San Diego, CA, USA: USENIX, Dec. 2005, pp. 125–141. [21] D. Patterson, “A Simple Way to Estimate the Cost of Downtime,” in Proc. 16th Large Installation System Administration Conference, A. Couch, Ed. Philadelphia, PA, USA: USENIX, 2002, pp. 185–188. [22] C. Kubicki, “The System Administration Maturity Model – SAMM,” in Proc. 7th Large Installation System Administration Conference (LISA ’93). Monterey, CA, USA: USENIX, Nov. 1993, pp. 213–225.
215 Authorized licensed use limited to: UNIVERSIDADE FEDERAL DO PARANA. Downloaded on October 28, 2009 at 16:49 from IEEE Xplore. Restrictions apply.