ESTIMATING RATES OF FAULT INSERTION ANDTEST EFFECTIVENESS IN SOFTWARE SYSTEMS John C. Munson Computer Science Department University of Idaho MOSCOW, 83844-1010 ID jmunson @cs.uidaho.edu
Allen P. Nikora Jet Propulsion Laboratory California Institute of Technology Pasadena, CA 91 109-8099
[email protected]
ABSTRACT In developing a software system, we would like to estimate the total number of faults inserted into a software system, the residual fault content of that system at any given time, and the efficacy of the testing activity in executing the code containing the newly inserted faults. Prior to test, however, there may be very little direct information regarding thenumber and location of faults. This lack of direct information requires the development of a fault surrogate from which the number of faults and their location can be estimated. We develop a fault surrogate based on changes in relative complexity, a synthetic measure which has been successfully used as a fault surrogate in previous work. We show that changes in the relative complexity can be used to estimate the rates at which faults are inserted into a system between successive revisions. These rates can be used to continuously monitor the total number of faults inserted into a system. Finally, we develop a method for determining test effectiveness based on the measuring the proportion of testing activity devoted to exercising those areas of the system that have changed since the last version.
1. INTRODUCTION Over a number of years of study, we can now establish a distinct relationship between software faults and certain aspects of software complexity. When a software system consisting of many distinct software modules is built for the first time, we have little or no direct information as to the location of faults in the code. Some of the modules will have far more faults in them than do others. We do, however, now know that the number of faults in a module is highly correlated with certain software attributes that may be measured. This means that we can measure the software on these specific attributes and have some reasonable notion as to the degree to which the modules are fault prone [Muns90, Muns961.
-2-
In the absence of information as to the specific location of software faults, we have successfully used a derived metric, the relative complexity measure, as a fault surrogate. That is, if the relative complexity value of a module is large, then it will likely have a large number of latent faults. If, on the other hand, the relative complexityof a module is small, then it will tend to have fewer faults. As the software system evolves through a number of sequential builds, faults will be identified and the code will be changed in an attempt to eliminate the identified faults. The introduction of new code, however, is a fault prone process just as was the initial code generation. Faults may well be injected during this evolutionary process. Code does notalways change just to fix faults thathavebeen
isolated in it. Some
changes to code during its evolution represent enhancements, design modifications or changes in the code in response to continually evolving requirements. These incremental code enhancements may also result in the injection of still more faults. Thus, as a system progresses through a series of builds, the relative complexity fault surrogate of each program module that has been altered must also change. We will see that the rate of change in relative complexity will serve as a good index of the rate of fault injection. Once the rate of fault insertion has been established, it becomes possible to estimate the number of faults remaining in the system at any point during the
development. Since we use
changes in relative complexity as an index of the fault insertion rate, it becomes possible to estimate number of residual faults at the module level, in which a module is takento be a procedure, function, or method. This information is useful to software development managers wishing to estimate the resources required to remove the remaining faults - not only can the number of remaining faults be estimated, but it is possible to direct fault detection and removal resources at those portions of the software estimated to have the highest
concentrations of residual faults.
However, this is only half of the picture - once the software is operating in the field, we wish to estimate its reliability. The estimated number of residual faults, a static measure, must be transformed into an estimate of the system’s dynamic behavior. The general notion of software test is that rate of fault removal will generally exceed the rate of fault injection. In most cases, this is probably true [Muns97]. Some changes are rather more heroic than others. During these more substantive change cycles, it is quite possible that the actual number of faults in the system will rise. We would be very mistaken, then, to assume that software test will monotonically reduce the number of faults in a system. This will only be the case when the rate of fault removal exceeds the rate of fault injection. The rate of fault re-
-3-
moval is relatively easy to measure. The rate of fault injection is much more tenuous. This fault injection process is directly related to two measures that we can takeon code as it evolves, code change and code churn. In this investigation wewill establish a methodology whereby code can be measured from one build to the next, a measurement baseline. We will use this measurement baseline to develop an assessment of the rate of change to a system as measured by our relative complexity fault surrogate. From this change process we will then be able to derive a direct measure of the rate of fault injection based on changes in the software from one build to the next. We examine data from an actual system on which faults may be traced to specific build increments to assess the predicted rate of fault injection with the actual. Finally, we will develop a method of measuring the efficiency of a test activity. To estimate rates of fault insertion, it is necessary to identify a complete software system on which every version of every module has been archived
together with the faults that have
been recorded against the system as it evolved. Of the two systems we analyzed for this study, the Cassini Orbiter Command and Data Subsystem at JPL met all of our objectives. On the first build of this system there were approximately 96K source lines of code in approximately 750 program modules. On the last build there were approximately 1 10K lines of source code in approximately 800 program modules. Asthesystemprogressedfromthe there were a total of 45,200 different versions of these modules.
first to the last build
On the average, then, each
module progressed through an average of 60 evolutionary steps or versions. For the purposes of this study, the Ada program module is a procedure or function. it is the smallest unit of the Ada language structure that may be measured. A number of modules present in the first build of the system were removed on subsequent builds. Similarly, a number of modules were added. The Cassini CDS does not represent an extraordinary software system. It is quite typical of the amount of change activity that will occur in the development of a system on the order of 100 FLOC. It is a non-trivial measurement problem to track the system as it evolves. Again,
there are two different sets of measurement activities that must occur at once. We are interested the changes in the source code and we are
interested in the fault reports that are being filed
against each module. To determine the efficiency of a test activity, it is necessary to have a system in which structural changes between one increment and its predecessor can be measured together with the execution profile observed during test. Since wewereunable
to accomplish this last for the
-4CASSINI CDS flight software, we studied the real-time
software for a commercial embedded
system.
2. A Measurement Baseline The measurement of an evolving software system through the shifting sands of time is not an easy task. Perhaps one of the most difficult issues relates to the establishment of a baseline against which the evolving systems may be compared. This problem is very similar to that encountered by the surveying profession. If we were to buy a piece of property, there are certain physical attributes that we would like to know about that property. Among
these properties is
the topology of the site. To establish the topological characteristics of the land, we will have to seek out a benchmark. This benchmark represents an arbitrary point somewhere on the subject property. The distance and the elevation of every other point on the property may then beestablished in relation to the measurement baseline. Interestingly enough, we can pick any point on the property, establish a new baseline, and get exactly the same topology for the property. The property does not change. Only our perspective changes. When measuring software evolution, we need to establish a measurement baseline for the same purpose described above [Niko97, Muns96aI. We need a fixed point against which all others can be compared. Our measurement baseline also needs to maintain the property that, when another point is chosen, the exact same picture of software evolution emerges, only the perspective changes. The individualpointsinvolved
in measuring software evolution are individual
builds of the system. Standardizing metrics for one particular build is simple. For each metric obtained for each module, subtract from that metric its mean and divide by its standard deviation. This puts all of the metrics on the same relativescale, with a mean of zero and a standard deviation of one. This works fine for comparing modules within one particular build. But when we
standardize
subsequent builds using the means and standard deviations for those builds a problem arises. The standardization masks the change that has occurred between builds. In order to place all the metrics on the same relative scale and to keep from losing the effect of changes between builds, all build data is standardized using the means and standard deviations for the metrics obtained
from the baseline system. This preserves trends in the data and lets measurements from different builds be compared.
-5For each raw metric in the baseline build, we may compute a mean and a standard deviation. Let us denote the vector of mean values for the baseline build as X B and the vector of standard deviations as sB . The standardized baseline metric values for any module j in an arbitrary build i, then, may be derived from raw metric valuesas Bi
z;' I
B,i
"B
= wj si"- x j n
The process of standardizing the raw metrics certain makes them more tractable. Among other things, it now permits the comparison of metric values from one build to the next. This standardization does not solve the main problem. There are too many metrics collected on each module over many builds. We need to reduce the dimensionality of the problem. We have successfully used principal components analysis for reducing the dimensionality oftheproblem [Muns90a, Khos921.
The principal components technique will reduce a set of highly correlated
metrics to a much smaller set of uncorrelated or orthogonal measures. One of the products of the principal components technique is an orthogonal transformation matrixT that will send the standardized scores (the matrix z) onto a reduced set of domain scores thusly, d = zT . In the same manner as the baseline means and standard deviations were used to transform
the raw metric of any build relative to a baseline build, the transformation matrix
TB derived
from the baseline build will be usedin subsequent builds to transform standardized metric values
T B. where obtained from that build to the reduced set of domain metrics as follows: dB*'= zB3'
zB9'are the standardized metric values from buildi baselined on build B . Another artifact of the principal components analysis is the set of eigenvalues that are generated for each of the new principal components. Associated with each of the new measurement domains is an eigenvalue, 2 . These eigenvalues are large or small varying directly with the proportion of variance explained by each principal component. We have successfully exploited these eigenvalues to create a newmetriccalledrelative
complexity, p , that is the
weighted sum of the domain metrics to wit: nr
pi = 5 0 + 1 0 ~ a , d j where rn is the dimensionality of the reduced metric set [Muns90a].
-6-
As was the case for the standardized metrics and the domain metrics, relative complexity may be baselined as well usingthe eigenvalues and the baselined domain values as follows:
If the raw metrics that are used to construct the relative complexity metric are carefully chosen for their relationship to software faults then the relative complexity metric will vary
in
exactly the same manner as the faults [Muns95]. The relative complexity metric in this context is a fault surrogate. Whereas we cannot measure the faultsin a program directly we can measure the relative complexity of the program modules that contain the faults. Those modules having a large relative complexity value will ultimately be found to be those with the largest number
of
faults [Muns92].
3.
SOFTWAREEVOLUTION
As a software system grows and modifications are made, the modules that comprise the system are recompiled and a new version, or build, is created. Each build is constructed from a distinct set of these software modules, though not always exactly the same ones.
The new ver-
sion may contain some of the same modules as the previous version, some entirely new modules and it may even omit some modules that were present in an earlier version. Of the modules that are common to both the old and new version, some may have undergone modification since the last build. The set of modules that constitute the system on any one build is subject to material change over the life of the system. 3.1
Module Sets and Versions When evaluating the change that occurs to the system between any two builds i, andj, we
are interested in three sets of modules. The first set, M:,’, is the set of modules present in both builds of the system. These modules may have changed since the earlier version but were
not
removed. The second set, M : ] , is the set of modules that were in the early build and were re. .
moved prior to the later build. The final set, M : ] , is the set of modules that have been added to the system sincethe earlier build. As an example, let build i consist of the following setof modules.
-7-
Between build i a n d j module m3 is removed giving
Then between builds j and k two new modules, m7 and m, are added and module m2is deleted giving
For the builds i, a n d j the set With a suitable baseline in place, and the module sets defined above, it is now possible to measure software evolution across a full spectrum of software metrics. We can do this first by comparing average metric values for the different builds. Secondly, we can measure the increase or decrease in system complexity as measuredby a selected metric, code delta, or we can measure the total amountof change the system has undergone between builds, code churn. We can now see that establishing the complexity of a system across builds in the face of changing modules and changing sets of modules is in itself a very complex problem. In terms of the example above, the relative complexity of the system RB3'at build i, the early build, is given by m,.tM
where p,"" is the relative complexity of module m, on this build baselined by buildB. Similarly, the relative complexity of the systemR"" at buildj, the later buildis given by
The later system build is said to be more complex if RB" > RE,' . Regardless of which metric is chosen, the goal is the same. We wish to assess how the system has changed, over time, with respect to that particular measurement. The concept of a code delta providesthisinformation.
A codedeltais,asthenameimplies,thedifferencebetweentwo
builds as tothe relative Complexity metric.
-8-
3.2
Code Churn and Code Deltas The change in the relative complexity in a single module between two
builds may be
measured in one of two distinct ways. First, we may simply compute the simple difference in the module relative complexity between build i and buildj. We will call this value the code delta for the module m u ,or
.~
fi;,’ = p,B , j - p ,B , i .
The absolute value of the code delta is a measure of
code churn. In the case of code churn, what is important is the absolute measure of the nature that code has been modified. From the standpoint of fault insertion, removing a lot of code is probably as catastrophic as adding a bunch. The new measure of code churn,
x , for module m,
The total net change of the system is the sum of the code delta’s for a system between two builds i a n d j is given by in,€
M‘
With a suitable baseline in place, and the modulesets defined above, it is now possible to measure software evolution across a full spectrum of software metrics. We can do this first by comparing average metric values for the different builds. Secondly, we can measure the increase or decrease in system complexity as measured by a selected metric, code delta, or we can measure the total amount of change the system has undergone between builds, code churn. A limitation of measuring code deltas is that it doesn’t give an indicator as to how much
change the system has undergone. If, between builds, several software modules are removed and are replaced by modules of roughly equivalent complexity, the code delta for the system will be close to zero. The overall complexity of the system, based on the metric used to compute deltas, will not have changed much. However, the reliability of the system could have been severely effected by the process of replacing old modules with new ones. What we need is a measure to accompany code delta that indicates how much change has occurred. Code churn is a measurement, calculated in a similar manner to code delta, that provides this information. The net code churn of the same system over the same buildsis
-9-
Whenseveralmodulesarereplacedbetweenbuilds
by modules of roughlythe same
complexity, code delta will be approximately zero but code churn will be equal to the sum of the value of p for all of the modules, both inserted and deleted. Both the code delta and code churn for a particular metric are needed to assess the evolution of a system. 4.
OBTAININGAVERAGEBUILDVALUES
One synthetic software measure, relative complexity, has clearly been establishedas a successful surrogate measure of software faults [Muns90a]. It seems only reasonable that we should use it as the measure against which we compare different builds. Since relative complexity is
a com-
posite measure based on the raw measurements, it incorporates the information represented LOC, V(g), q, , q 2, and all the other raw metrics
of interest. Relative complexity
by
is a single
value that is representative of the complexity of the system which incorporates all of the complexity attributes we have measured (e.g. size, control flow, style, data structures, etc.). By definition, the average relative complexity, p , of the baseline system will be
where N B is the cardinality of the set of modules on build B, the baseline build. Relative complexity for the baseline build is calculated from standardized values using the mean and standard deviation from the baseline metrics. The relative complexities are then scaled to have a mean of 50 and a standard deviation of 10. For that reason, the average relative complexity for the base-
line system will always be
a fixed point. Subsequent builds are standardized using
the means
and standard deviations of the metrics gathered from the baseline system to allow comparisons. The average relative complexityfor subsequent builds is givenby
where N k is the cardinality of the set of program modules in the k f hbuild and pBTkis the basePined relative complexity for the ith module of that set. The total relative complexity, RQ, of a system on its initial build is simply the sumof a11 relative complexities of each module of the initial system,
-10-
R0 =
N
Cpy. i=l
The principle behind relative complexity is that it serves as a fault surrogate. That is, it will vary in precisely the same manner as do software faults. The fault potential
of a particu-
lar module i is directly proportional its value of the relative complexity fault surrogate. Thus,
To derive a preliminary estimate for the actual number
of faults per module we may
make judicious use of historical data. From previous software development projects it is possible to develop a proportionality constant, say k, that will allow the total system relative complexity to map to a specific system fault count as follows: F 0 = kRo or Ro = k / F o . Substituting for R in the previous equation, we find that
Thus, our best estimate for the number of faults in module i in the initial configuration of the system is g i0
=r;.0 F 0 .
After an interval of testing a number of faults will be found and fixes made to the code to remedy the faults. Let F J be the total number of faults found in the total system up to and including the j'" build of the software. In a particular module i there will be J.' faults found in the first build that are attributable to this module. The estimated number of faults remaining in module i will then be 1
gi = g i
0
1 -.fi
7
assuming that we Rave only fixed faults in the code and not added any newones. Our ability to locate the remaining faults in a system will relate directly to our exposure to these faults. If, for example, atthe j"
build of a system there are g / remaining faults in
module i , we can not expect to identify any of these faults unless some test activity is allocated to exercising module i. As the code is modified over time, faults will be found and fixed. However, new faults will be introduced into the code as a result of the change. In fact, this fault injection process is
-I 1 -
directly proportional to change in the program modules from one version to the next. As a module is changed from one build to the nextin response to evolving requirements changes and fault reports, its complexity will also change. Generally, the net effect of a change is that complexity will increase. Onlyrarelywill
its complexity decrease. It is nownecessary to describe the
measurement process for the rate of change in an evolving system.
5. SOFTWARE EVOLUTION AND THE FAULT INJECTION PROCESS Initially, our best estimate for the number of faults in module i in the initial configuration of the system is g j0 = q 0 F 0 .
As the ith module was tested during the test activity of the first build, the number of faults found and fixed in this process was denoted by
f,‘ .
However, in the process of fixing this fault, the
source code will change. In all likelihood, so, too, will the relative complexity of this module. Over a sequence of builds, the complexity of this module may change substantially. Let,
represent the net change in relative complexity to the it* module over the firstj builds. Then the cumulative churn in the total system overthesej builds will be,
where N l is the cardinality of the set of all modules that were in existence over these j builds. The complexity of the ith module will have changed over this sequence of builds. Its new value
will be pi +A:,”. Some changes may increase the relative complexity of this module and others may decrease it. A much better (as will be demonstrated) measure of the cumulative change to the system will be pi + Vy*J. The system complexity, R, will also have changed. Its new value will be Ro +Ao*.’ (.
On the initial build of the system the initial burdenof faults in a module was proportional to the relative complexity of the module. As the build cycle continues the rate of fault injection
is most closely associate with the code churn. Thus, the proportion of faults in the i‘” module
-1 2will have changed over the sequence of j builds, related to its initial relative complexity and its subsequent code churn. Its new value will be
y.’ = (PO +vpq / ; / R o +VO*J) We now observe that our estimate of the number of faults in the system has nowchanged.
On the j t h build there will no longer be Fo faults in the system. New faults will have been introduced as the code has evolved. In all likelihood, the initial software development process and subsequent evolution processes will be materially different. This means that there will be a different proportionality constant, say k” representing the rate of fault injection for the evolving system. For the total system, then, there will have been FJ = kRo + k’Ao9j faults introduced into j r h build. Each module will
the system from the initial build through the h/
have had
= qJFjfaults introduced in it either from the initial build or on subsequent builds.
Thus, our
revised estimated of the number of faults remaining in module i on buildj will be g,/ = h l - A ’ .
The rate of fault insertion is directly related to the change activity that a module will receive from one build to the next. At the system
level, we can see that the expected number of
injected faults from buildj to buildj+l will be
FJ“ - FJ
= kRo
+
k’Vo*.j’’- kRo + k’Vo”
- k’(VOs.1” - Vo.1) - k‘VjJ+‘
At the module level, the rate of fault injection will, again, be proportional to the level of change activity. Hence, the expected number of injected faults between buildj to buildj+d on module i will be simply hi,’ - h i . The two proportionality constants k and k’ are the ultimate criterion measures of software development process and software maintenance processes. Each process has an associated fault injection proportionality constant. Ifwe institute a new software development process and observe a significant change downward in the constant k, then the change would have been a good one.
Very frequently, however, software processes are changedbecause
development fads
change and not because a criterion measure has indicated thata new process is superior to a pre-
-I 3'.
vious one. We will consider that an advance in software development process has occurred if either k or k' has diminished for that new process.
6. DEFINITION OF AFAULT Unfortunately there is no particular definition of just precisely what a software fault is. In the face of this difficulty it is rather hard to develop meaningful associative models between faults and metrics. In calibrating our model, we would like to know how to count faults in an accurate and repeatable manner. In measuring the evolution of the system to talk about rates of fault introduction and removal, wemeasure in units to thewaythat
the system changes over time.
Changes to the system are visible at the module level, andwe attempt to measure at that level of granularity. Since the measurements of system structure are collected at the module level (by module we mean procedures and functions), we would like information about faults at the same granularity. We would also like to know if there are quantities that are related to fault counts that can beused to make our calibration task easier. Following the second definition of fault in [IEEE83, IEEE881, we consider a fault to be a
structural imperfection in a software system that may lead to the system's eventually failing. In other words, it is a physical characteristic of the system of which the type and extent may be measured using the same ideas used to measure the properties of more traditional physical systems. Faults are introduced into a system by people making errors in their tasks - these errors may be errors of commission or errors of omission. In order to count faults, we needed to develop a method of identification that is repeatable, consistent, and identifies faults at the same level of granularity as our structural measurements. In analyzing the flight software for the CASSINI project the fault data and the source code change data were available from two different systems. The problem reporting information was obtained from the JPL institutional problem reporting system. For the software used in this study, failures were recorded in this system starting at subsystem-level integration, and continuing through spacecraft integration and test. Failure reports typically contain descriptions of the failure at varying levels of detail, as well as descriptions of what was done to correct the fault(s) that caused the failure. Detailed information regarding the underlying faults (e.g.>where were the code changes made in each affected module) is generally unavailable from the problem reporting system.
- 14-
The entire source code evolution could be obtained directly from the Software Configuration Control System (SCCS) files for all versions of the flight software. The way in which SCCS was used in this development effort makes it possible to track changes to the system at a module level in that each SCCS file stores the baseline version of that file (which may contain one or more modules) as well as the changes required to produce each
subsequent increment
(SCCS delta) of that file. When a module was created, or changed in response to a failure report or engineering change request, the file in which the module is contained was checked into SCCS as a new delta. This allowed us to track changes to the system at the module level as it evolved over time. For approximately 10% of the failure reports, we were able to identify the source file increment in which the fault(s) associated with a particular failure report were repaired. This information was available either in the comments inserted by the developer into the SCCS file as part of the check-in process, or as part of the set of comments at the beginning of a module that track its development history. Using the informationdescribedabove,
we performedthe following steps to identify
faults: For each problem report, search all of the SCCS files to identify all modules and the increment(s) of each module for which the software was changed in response to the problem report. For each increment of each module identified in step 1 , start with the assumption that all differences between the increment in which repairs are implemented and the previous increment are due solely to fault repair. Note that this is not necessarily a valid assumption
- developers may be making functional enhancements to the system in the same increment that fault repairs are being made. Careful analysis of failure reports for which there was sufficiently detailed descriptive information served to separate areas of fault repair from other changes. However, the level of detail required to perform this analysis was not consistently available. 0
Use a differential comparator (e.g., Unix d i f f ) to obtain the differences between the increment(s) in whichthe fault(s) wererepaired,and
the immediately preceding incre-
ment(s). The results indicated the areas to be searched for faults. After completing the last step, we still had to identify and count the faults - the results of the differential comparison cannot simply be counted up to give a total number of faults. In or-
-15der to do this, we developed a taxonomy for identifying and counting faults [Niko98]. This taxonomy differs from others in that it does not seek to identify the root cause of the fault. Rather, it is based on the types of changes made to the software to repair the faults associated with failure reports - in other words, it constitutes an operational definition of a fault. Although identifying theroot
causes of faults isimportant in improvingthe development process [Chi192,
IEEE931, it is first necessary to identify the faults. We do not claim that this is the only way to identify and count faults, nor do we claim that this taxonomy is complete. However, we found that this taxonomy allowed us to successfully identify faults in the software used in the study in a consistent manner at the appropriate level of granularity. 7.
THE RELATIONSHIP BETWEEN FAULTS AND CODE CHANGES
Having established a theoretical relationship between software faults and code changes, it is now of interest to validate this model empirically. This measurement occurred on two simultaneous fronts. First, all of the versions of all of the source code modules were measured. From these measurements, code churn and code deltas were obtained for every version of every module. The failure reports were sampled to lead to specific faults in the code. These faults were classified according to the above taxonomy manually on a case by case basis. Then we were able to build a regression model relating thecode measures to the code faults. The Ada source code modules for all versions of each of these modules were systematically reconstructed from the SCCS code deltas. Each of these module versions was then measured by the UX-Metric analysis tool for Ada [SETL93]. Not all metrics provided by
this tool
were used in this study. Only a subset of these actually provide distinct sources of variation [Khos90]. The specific metrics used in this study are shown in Table 1. To establish a baseline system, all of the metric data
for the module versions that were
members of the first build of CDS were then analyzed by our PCA-RCM tool. This tool is designed to compute relative complexity values either from a baseline system or from a system being compared to the baseline system. In that the first build of the Cassini CDS system was selected to be the baseline system, the PCA-RCM tool performed a principal components analysis on these data with an orthogonal varimax rotation. The objective of this phase of the analysis is to use the principal components technique to reduce the dimensionality of the metric set. As may been seen in Table 2, there are four principal components for the 18 metrics shown in Table
-1 61 . For convenience, we have chosen to name these principal components as Size, Structure,
Style and Nesting. From the last row in Table 2 we can see that the new reduced set of orthogonal components of the original 18 metrics account for approximately 85% of the variation in the original metric set.
Metrics
Definition Count of unique operators [Ha1771 Count of unique operands Count of total operators
771
777
N,
Count of total operands Purity ratio: ratio of Halstead’s to total program vocabulary McCabe’s cyclomatic complexity
N2
P/R Depth
Maximum nesting level
AveDeptk LOC Blk Cmt CmtWds Stmts
Averagenesting ‘level of programblocks Number of lines of code Number of blank lines
LSS PSS
I
/
of program blocks
Count of comments Total words usedin all comments Count of executable statements I
Number of logical source statements -
I Number of physical source statements
Table 1. Software Metric Definitions As is typical in the principal components analysis of metric data, the Size domain domi-
nates the analysis. It alone accounts for approximately 38% of the total variation in the original metric set. Not surprisingly, this domain contains the metrics of total statement count (Stmts), logical source statements (LSS), the Halstead lexical metric primitives of operator and operand count, but it also contains cyclomatic complexity (V(g)). In that we regularly
find cyclomatic
complexity in this domain we are forced to conclude that it is only a simple measure of size in the same manner as statement count. The Structure domain contain those metrics relating to the physical structure of the program such as non-executable
statements (NonEx) and the pro-
gram block count (Blk). The Style domain contains measures of attribute that are directly under
-17a programmer’s control such as variable length (VZ) and purity ratio (P/R). The Nesting domain consist of the single metric that is a measure of the average depthof nesting of program modules (AveDepth).
Table 2. Principal Componentsof Software Metries In order to transform the raw metrics for each module version into their corresponding relative complexity values, the means and the standard deviations must be computed. These are shown in Table 3. These values will be used to transform all raw metric values for all versions of all modules to their baselined z score values. The last four columns of Table 3 contain the actual transformation matrixthatwillmapthemetric
z score values onto their orthogonal
equivalents to obtain the orthogonal domain metric values used
in the computation of relative
complexity. Finally, the eigenvalues for the four domains are presented in the last row of this table.
-1 8Table 3, then contains all of the essential information needed to obtain baselined relative complexity values for any version of any module relative to the baseline build. As an aside, it is not necessary that the baseline build be the initial build. As a typical system progresses through hundreds of builds in the course of its life, it is well worth reestablishing a baseline closer to the current system. In any event, these baseline data are saved by the PCA-RCM tool for use in later computation of metric values. Whenever the tool is invoked referencing the baseline data it will automatically use these data to transform the raw metric values givento it.
I
Domain3 Domain4
I
Table 3. Baseline Transformation Data
In relating thenumber of faults inserted in an increment to measures of a module’s structural change, we had only a small number of observations with which to work. Problem reports could not be consistently traced back to source code, and there were numerous modules for which UX-Metric did not report measurements.
The net result was that of the over 100 faults
-19-
that were initially identified, there were only35 observations in which a fault could be associated with a particular increment of a module, and with that increment’s measures of code delta and code churn. For each of the 35 modules for which there was viable fault data, there were three data points. First, we had the number of injected faults for that module that were the direct result of changes that had occurred on that module between the current version that contained the faults and the previous version that did not. Second, we had code delta values for each of these modules from the current to the previous version. Finally, we had code churn values derived from the code deltas. Linear regression models were computedfor code churn and code deltas with code faults as the dependent variable in both cases. Both models were build without constant terms in that we surmise that if no changes were made to a module, then no new faults could be introduced. The results of theregressionbetween
faults and code deltas werenot at all surprising. The
squared multiple R for this model was 0.001, about as close to zero as you can get. This result is directly attributable to the non-linearity of the data. Change comes in two flavors. Change may increase the complexity of a module. Change may decrease the complexity of a model. Faults, on the other hand are not related to the direction of the change but to its intensity. Removing masses of code from a module is just as likely to introduce faults and addingcode to it. The regression model between code churn and faults is dramatically different. The regression ANOVA for this model are shown in Table 4. Whereas code deltas do not show a linear relationship with faults, code churn certainly does. The actual regression model is given in Table 5. In Table 6 the regressions statistics have been reported.
Of particular interest is the
Squared Multiple R term. This has a value of 0.649. This means, roughly, that the regression model will account for more that 65% of the variation in the faults of the observed modules based on the values of code churn.
Table 4. Regression Analysisof Variance
Table 5. Regression Model
-20-
N 35
Multiple R
Squared multiple R
0.806 0.649 Table 6. Regression Statistics
Standard error of estimate 2.296
Of course, it may be the case that both the amount of change and the direction in which the change occurred. The linear regression through the origin shown in Tables 7, 8, and 9 below illustrates this particular regression model.
Table 7. Regression Analysis of Variance t Coefficient Std Error P(2-Tail) 0.647 0.000 0.07 I 9.172 0.201 1 2.849 0.07 0.002 Table 8. Regression Model
Effect Churn Delta
N 35
Multiple R
Squared multiple R
348 .719 Table 9. Regression Statistics
Standard error of estimate 2.087
Tables 5 and 8 contain our estimates for the constant k relating the rate of fault insertion to the measured structural change, measured by code churn and code delta. We see that the model incorporating code delta as well as code churn performs significantly better than the model incorporating code churn alone, as measured by Squared Multiple R and Mean Sumof Squares.
8. TESTINGOBJECTIVES Deterministically testing a large software system is virtually impossible. Trivial systems, on the order of 20 or 30 modules, often havefar too many possible execution paths for complete deterministic testing. This being the case, we must revisit what wehope to accomplish by testing the system. Is our goal to remove all of the faults within the code? If this is our goal, how do we know when we have them all? What is it worth,
in terms of expense, to try to find one more
fault? Given unlimited time and resources, identification and removal
of all faults might be a
-21 -
noble goal, but real world
constraints make this largely unattainable.
The problem is that we
must provide an adequate level of reliability in light of the fact that we cannot find and remove all of the faults. Through the use of software measurement, we hope to identify which modules contain the most faults and, based on execution profiles of the system, how these potential faults can impact software reliability. The idea is that a fault that never executes, never causes a failure. However, a fault that lies along the path of normal execution will cause frequent failures. The majority of the testing effort should be spent
finding those faults that are most likely to
cause failure. The first step towards this testing paradigm is the identificationof those modules that are likely to contain the most faults. The objectives of the software test process are not clearly specified and sometimes not clearly understood.
An implicit objective of a deterministic approach to
testing is to design a systematic and deterministic test procedure that will
guarantee sufficient
test exposure for the random faults distributed throughout a program. By insuring, for example, that all possible paths have been executed, then any potential faults on these paths will have had the opportunity to have beenexpressed. We must, however, come to accept the fact that some faults will always be present in the code. We will not be able to eliminate them all. The objective of the testing process should be to find those faults that will have the greatest impact on the safety/survivability of the code. Under this view of the software testing process, the act of testing may be thought of as conducting an experiment on the behavior of the code under typical execution conditions. We will determine, a priori, exactly what we wish to learn about the
code in the test process and conduct the
experiment until this stopping condition has been reached. To know the loci of probable faults in a complex software system is not a sufficient condition for reliability modeling. A software system may be viewed asa set of program modules that are executing a set of mutually exclusive functions. If the system executes a functionality expressed by a subset of modules that are fault free, it will never fail. If, on the other hand, the system is executing a functionality expressed in a subset of fault laden modules, there is a very high probability that it will fail. Thus, failure probability is dependent upon the input data sets which drive the system into regions of code (Le., functionalities) of differing complexities (Le., fault proneness).
-22-
Each software test suite implements a subset of functionalities. As each test is run to completion it generates a test execution profile which represents the results of the execution of one or more functions. When a program begins the execution of a particular functionality we can describe this beginning as the start of a stochastic process. For the system, S, there is a call tree that shows the transition of program control from one program module to another. This transition can be modeled as a stochastic process, where we define an indexed collection of random variables {X,} , where the index t runs through a set of non-negative integers, t = 0,1,2,
e . .
repre-
senting the epochs of the process. At any particular epoch the software is found to be executing exactly one of its M modules. The fact of the execution occurring in a particular module is a state of the system. For a given software system, it may be found in exactly one of a finite num-
ber of mutually exclusive and exhaustive states, 1,2, M . In this representation of the system, there is a stochastic process {X,} , wheretherandomvariables t = 0,1,2, and where each random variable may take
are observed at epochs
on any one of the M integers, from the
state space A = 1,2,-.-M. The probability that a particular module may execute is a conditional probability. Let Y be a random variable defined on the
pjk’ = Pr[X,
indices of the set
= il Y = k ] where k = 1,2,.. . , # { F }
of elements of F.
Then
represents the execution profile for a set of
modules expressing function k exclusively. The distribution of the execution profile is multinomial for a software system consisting of more than two modules. In other words, for each functionality, f , , there is an execution profile represented by the probabilities P : ~ )p:), , p3( i )
, - e * ,
p ,U j .
9. TEST EFFICIENCY The test process for evolving software systems takes on a different measurement aspect than that of new systems. Existing systems are continually being modified as a normal part of the software maintenance activity. Changes will be introduced
into this system based on the
need for corrections, adaptations to changing requirements, and enhancements to make the system perform fasterhetter. The precise effects of changes to software modules in terms of number of latent faults is now reasonably well understood. From a statistical testing perspective, test effort should be focused on those modules that are most likely to contain faults. Each program
-23-
module that has been modified, then, should be tested in proportion
the number of anticipated
faults that might have beenintroduced into it. Each program module is usually closely linked to a specific functionality. That is, as we exercise a particular functionality a distinct execution profile emerges for that functionality. For each functionality, some modules have a high probability of being executed, while other have a low probability. Each test suite will express one or more of these functionalities. These execution profiles that generate from each test may be
P = { p ; I1 I i I n ) for the
characterized by the probability distribution
test.
In the face of the evolving nature of the software system, the impact of a single test may change from one build to the next. Each program module has a relative complexity value. This relative complexity is a fault surrogate. That is, the larger value of the relative complexity the greater fault potential that a module has. If a given module hasa large fault potential, but limited exposure ( small profile value) then the functional complexity of that module is also small. Our objective during the test phase is to maximize our exposure to the faults in the system. Another way to say this is that we wish to maximize functionalcomplexity, Cp , given by
where p f is the relative complexity of the j‘” module on the ifhsystem build and p y ) is the test profile of the k‘” test suite. The initial phase of the efficient testing of changed code is to identify the functionalities that will exercise the modules that have changed. Each of these functionalities so designated will have an associated test suite designed to exercise that functionality. With this information it is now possible to describe the efficiency of a test from a mathematical/statistical perspective. A regressiontestis
one specifically tailoredto exercise the functionalities thatwill
cause the
changed modules to be executed. A regression test will be efficient if it does a good Job of exercising changed code. It is worth noting, however, that
a regression test that is efficient on one
build may be inefficient on a subsequent build. The efficiency of a regression test, then, is given by the following formula.
u=l
-24-
where m represents the cardinality of { M , u M } as defined earlier. In this case, z , is simply the expected value for code churn under theprofile P ( k ) . This concept of test efficiency permits the numerical evaluation of a test on the actual changes that have been made to the software system. It is simply the expected value of the fault exposure from one release to another under a particular test. If the value of z is large for a given test then the test will have exercised the changed modules. If the set of z 's for a given release is low then it is reasonable to suppose that the changed modules have not been testedin proportion to the number of probable faults that were introduced during the maintenancechanges. For practical purposes, we need to know something about the upper bound on
test effi-
ciency. That is, if we were to execute the best possible test, what then would be the value of test efficiency. A best regression test is one that will spend the majority of its time in the modules that have changed the most from one build to the next.Let,
,=I
This is the total code churn between the i and j builds. To exercise each module in proportion to the change that has occurred in the module during its current revision, we will compute this proportion as follows:
This computation willyield a new hypothetical profile called the
best projiZe. That is, it all
modules were executed in proportion to the amount of change that they had received we would then theoretically have maximized our exposure to software faults that may have been introduced. Finally, we seek to develop a measure that will relate well to the difference between the actual profile that is generated by a test and the best profile. To this end, consider the following term, Ipi -
4i1.
This is the absolute value between the best
profile and the actual profile. This
value has a maximum value of P and a minimum of 0. The minimum value will be achieved when the module best and actual coverage are identical. A measure of the total coverage for a set of modules (task or program) is then,
-25This coverage value has a maximum value of 10 when the best and the actual profiles are identical and 0 when there is a complete mismatch of profiles.
10. REGRESSION TEST RESULTS The following discussion documents the results of the execution of 36 instrumented tasks on two sequential builds of a large embedded software system. The perspective of this discussion is strictly from the standpoint of regression testing. That is, certain program modules have changed across the two sequential builds. The degree of this change is measured by code churn. As has been clearly demonstrated on the Cassini spacecraft project, the greater the change in a program module, the greater the likelihood that faults will have been introduced into the code by the change. Each of the regression tests, then, should attempt toexercise these changed modules in proportion to the degree of change. If a changed module were to receive little or no activity during the test process, then we must assume that the
latent faults in the module will be ex-
pressed when the software is placed into service. All of the tasks in system were instrumented with our Clic 1.O tool. This tool would permit us to count the frequency of execution of each module in each of the instrumented tasks and thus obtain the execution profiles for these tasks for each of the tests. The execution profiles show the distribution of activity in each module of the instrumented tasks.
For each of the modules,
the code churn measure was computed. The code churn values for each modules reflected the degree of change of the modules during the most recent sequence
of builds. The cumulative
churn values for all tasks are shown in the second column of Table 10. A churn value of zero indicates that the module in question received nochanges during the last build sequence. A large churn value (>30) indicates that the module in question received substantialchanges. For the subsequent analysis, two profile values for each test will be compared. The actual
profile is the actual execution profile for each test. The best profile is the best hypothetical execution profile given that each module would be tested directly in proportion to its churn value. That is, a module whose churn value was zero would receive little or no activity during the regression test process. From Table 10 we can seen that the A and B tasks have received the greatest change activity. Associated with each task entry in this table is the Best Profile and the Actual Profile for the task across all tests. The last row in the table gives the total values for code churn for all
-26tasks. The last two columns of this table contain the expected value for the code churn of the task under the best
profile and also under the actual profile. These columns are labeled Best
Coverage and Actual Coverage. The total expected value for code churn under the best profile is 131 I . The total expected value for code churn under the actual profile is 89. The tests spent a disproportionate amount of time in modules that had notchanged during this build interval. The ratio of Total Actual Coverage to Total Best Coverage will yield a percent coverage index for the task, for the system, or for the test depending onthe granularity of the summary.
E F
150.71
4.43E-02
121.00 3.55E-02 2.79E-03 4.299957
6.67 1584 0.402485 2.67E-03 0.401035 4.697273 126.46 3.17E-03 3.71E-02 0.337566
-27-
AH AI AJ
I
I
0 O.OOE+OO 2.15E-04 4.57E-07 0 O.OOE+OO 0 O.OOE+OO 2.85E-06 3404.946) I Table 10. Test Summary by ' .'ask
0
0
0
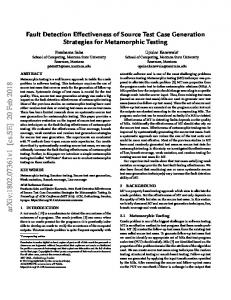
The change coverage index was computed by module for each task and then for the total system. In Figure 1 , these coverage data are presented for the total system and Tasks A, B, D, and E. For this figure, the values have been scaled
onto the interval from 0 to 10. Had there
been perfect best coverage, the total value would have been 10. The coverage values for the A and B tasks were the best out of all tasks. The E and D tasks, while having relatively high code churn values, did not fair so well. The test coverage of the D task was typicalof the total system, shown as the rightmost entry in this figure. Change Coverage Index
A
B
E
D
Total
Figure 1 - Change Coverage Index We would now like to look within a task to see why the A and B tasks showed better coverage than other tasks. The difference between the best profile and the actual profile is shown in Figure 2. Here, if the line is negative, this means tRat the module in question was exercise well out of proportion to the possible faults that it contained. On the other hand if the line is positive, then the module in question was not exercise in proportion to the faults that it might contain. A perfect line on this chart would be perfectly straight at zero on theprofile axis.
-29Table 1 1 summarizes the performance of the best 24 of
suite of 1 15 instrumented tests.
Only those tests whose performance index exceeded 10% of a theoretical total are shown here. Again the performance index shown in this figure was computed by forming the ratio of the actual profile to the best profile for that test. It must be remember that not all tests will exercise all modules. The performance index is computed only for those modules whose functionality was included in the test. From a regression test perspective, we now know that we
have a testing
problem. None of these tests do a really good job in executing the code most likely to contain the newly introduced faults.
Test # 28 18 14 12 47 49
I
Percent Coverage 20.6 19.0 18.2 16.9 14.8
#
Percent Test Coverage 177 11.7 31 11.6 11.5 3 11.5 167 59a 14.8 11.4 2 11.3
1 13.2 156 10.9 20 13.1 38 10.8 I80 12.9 10.7 39 10.6 33 9 12.2 158 12.2 1 137 I 10.2 Table 11. Individual Test Summaries
I
I
10. SUMMARY There is a distinct and a strong relationship between software faults and measurable software attributes. This is in itself not a new result or observation. The most interesting result of this current endeavor is that we also found a strong association between the fault injection process over the evolutionary history of a software system and the degree of change that is taking place in each of the program modules. We also found that the direction of the change had an effect on the number of faults inserted. Some changes will have the potential of introducing very few faults while others may have a serious impact on the number of latent faults. Different numbers of faults may be inserted, depending upon whether code is being added to or removed from the system.
-30-
In order for the measurement process to be meaningful, thefault data must be very carefully collected. In this study, the data were extracted ex post facto as a very labor intensive effort. Since fault data cannot be collected with the samedegree of automation as much of the data on software metrics being gathered by development organizations, material changes in the software development and software maintenance processes must be madeto capture these fault data. Among other things, a well defined fault standard and
fault taxonomy must be developed and
maintained as part of thesoftware development process. Further, all designers and coders should be thoroughly trained in its use. A viable standard is one that may be used to classify any fault unambiguously. A viable fault recording process is one in which any one person will classify a fault exactly the same as any other person. Finally, the whole notion of measuring the fault injection process is its ultimate value as a measure of software process. The software engineering literature is replete with examples of how software process improvement can be achieved through the use of some new software development technique. What is almost absent from the same
literature is a controlled study to
validate the fact that the new process is meaningful. The techniques developed
in this study can
be implemented in a development organization to provide a consistent method of measuring fault content and structural evolution across multiple projects over time. The initial estimates of fault insertion rates can serve as a baseline against which future projects can be compared to determine whether progress is being made in reducing the fault insertion rate, and to identify those development techniques that seem to provide the greatest reduction. Software test is not an intuitive process. Different modules are changed between builds. A regression test that was satisfactory for one build might well be totally
inadequate on a subse-
quent build. When a program is subjected to numerous testsuites to exercise differing aspects of its functionality, the test risk of a system will vary greatly as a result of the execution of these different test suites. Intuitively - and empirically - a program that spends a high proportion of its time executing a module set of high relative complexity will be more failure prone than one driven to executing program modules with complexity values.
Thus, weneed to identify the
characteristics of test scenarios that cause our criterion measures of
x
and7 to be Parge.
The importance of this research is that we can now have a clearer understanding of how to quantify and evaluate the effectiveness of the regression testingprocess. For this study, we were not able to perform an analysis of test effectiveness on the same system for which we estimated the rate of fault insertion. We are currently working with NASA and commercial software de-
c
-*
(.
-3 1velopment efforts to apply both typesof analysis to the sameproject, with the goal of improving our ability to estimate the number of faults remaining in the system after the completion of a test sequence and allocate them among those portions of the system that have changed since the last increment.
ACKNOWLEDGEMENTS The research described in this paper was carried out at the University of Idaho and the Jet Propulsion Laboratory, California Institute of Technology. Portions of the work performed at JPL were sponsored by the U. S. Air Force Operational Test and Evaluation Center (AFOTEC) and the National Aeronautics and Space Administration’s IV&VFacility.
REFERENCES [Chi1921
R. Chillarege, I. Bhandari, J. Chaar, M. Halliday, D. Moebus, B. Ray, M.-Y. Wong, “Orthogonal Defect Classification - A Concept for In-Process Measurement”, IEEE Transactions on Software Engineering, November, 1992,pp. 943-946.
[Ha1771
M. H. Halstead, Elements of Software Science. Elsevier, NewYork,1977
[IEEE83] “IEEE Standard Glossary of Software Engineering Terminology”, IEEE Std 7291983, Institute of Electrical and ElectronicsEngineers, 1983. [IEEE88]
“IEEE Standard Dictionary of Measures to Produce Reliable Software”, IEEE Std 982.1-1988, Institute of Electrical and ElectronicsEngineers, 1989.
[IEEE93] “IEEE Standard Classification for Software Anomalies”, IEEE Std 1044-1993, Institute of Electrical and Electronics Engineers,1994 [Kh0~90] T. M. Khoshgoftaar and J. C. Munson , “Predicting Software Development Errors Using Complexity Metrics,“ IEEE Journal on Selected Areas in Communications 8, 1990, pp. 253-261. [Khos92] T. M. Khoshgoftaar and J. C. Munson “A Measure of Software System Complexity and Its Relationship to Faults,” In Proceedings of the 1992 International Simulation Technology Conference, The Society for Computer Simulation, San Diego, CA, 1992, pp. 267-272. [Muns90] 9. C. Munson and T. M. Khoshgoftaar “Regression Modeling of Software Quality: An Empirical Investigation,” Journal of Information and Sofmare Technology, 32, 1990, pp. 105-1 14.
-32[Muns90a] J. C. Munsonand T. M. Khoshgoftaar “The Relative Software Complexity Metric: A Validation Study,” In Proceedings of the Software Engineering 1990 Conference, Cambridge University Press, Cambridge, UK, 1990, pp. 89-102. [Muns92] J. C. Munsonand T. M. Khoshgoftaar “The Detection of Fault-Prone Programs,” IEEE Transactions on Software Engineering, SE-18, No. 5, 1992, pp. 423-433. [Muns95] J. C. Munson, “Software Measurement: Problems and Practice,” Annals of Software Engineering, J. C. Baltzer AG, Amsterdam 1995. [Muns96] J. C. Munson, “Software Faults, Software Failures, and Software Reliability Modeling”, Information and Software Technology, December, 1996. [Muns96a] J. C. Munson and D. S. Werries, “Measuring Software Evolution,” Proceedings of the 1996 IEEE International Software Metrics Symposium , IEEE Computer Society Press, pp. 41 -5 I . [Muns97] J. C. Munson and G. A. Hall, “Estimating Test Effectiveness with Dynamic Complexity Measurement,” Empirical Sofiare Engineering Journal. Feb. 1997. [Niko97]
A. P. Nikora, N. F. Schneidewind, J. C. Munson, “IV&V Issues in Achieving High Reliability and Safety in Critical Control System Software”, proceedings of the International Society of Science and Applied Technology conference, March 10-12, 1997, Anaheim, CA, pp 25-30.
[Niko98]
A. P. Nikora, “Software System Defect Content Prediction FromDevelopment Process And Product Characteristics”,Doctoral Dissertation, Department of Computer Science, University of Southern California, May, 1998.
[SETL93] “User’s Guide for UX-Metric 4.0 for Ada”, SET Laboratories, Molino, OR, 0 SET Laboratories, 1987-I 993