Missing:
Vol. 138: 93-101,1996
MARINE ECOLOGY PROGRESS SERIES Mar Ecol Prog Ser
l
Published July 25
Estimating the abundance of benthic invertebrates: a comparison of procedures and variability between observers Lisandro Benedetti-Cecchi*, Laura Airoldi, Marco Abbiati, Francesco Cinelli Dipartimento di Scienze dell'Arnbiente e del Territorio, Universita di Pisa. Via A. Volta 6, 1-56126 Pisa, Italy
ABSTRACT. Different procedures for underwater sampling of epifaunal organisms were compared for their robustness to bias due to observers and precision using multifactonal sampling designs. Variability among 3 observers was tested in relation to: (1) the method employed to estimate the percent cover of organisms (visual vs point-intercept technique); ( 2 ) the size of quadrats (50 X 50 vs 20 X 20 cm); (3) stress (sampling at the b e g ~ n n i n gvs the end of the dive), and ( 4 ) random factors that were likely to change from dive to dive. Precision was expressed in terms of standard errors (over 3 replicates) obtained with each method a n d size. Two cnidarians (Astrojdes calycularis a n d Leptosarnmia pruvoti) a n d 2 sponges (Petrosia ficiforrnis and Geodia cydoniurn) w e r e considered in this study because of their abundance at the study site (a submarine cave). Much of the variability was related to significant differences between observers that changed from dive to dive for estimates of the cover of A. calycularis, and from dive to dive and with method for L. pruvoti. The small quadrats were more precise than the large ones when used to estimate the percent cover of A. calycularis a n d L. pruvoti, irrespective of method. In contrast, for P ficiformis the small quadrats were more precise if sampled with the visual method, while the reverse occurred for the large quadrats. A trend toward a greater precision of the large quadrats sampled with the visual method was evident for G. cydoniurn, although n o significant effects were found. Pilot studies a n d cost-benefit analyses were also used to determine the optimal allocation of resources (time) for sampling epifaunal organisms a t different spatial scales in the cave, for each method and size of quadrats. The small units in conjunction with the v ~ s u a method l were most efficient. This procedure offered the best compromise between repeatability among observers, precision and maxin~izationof replication for a fixed amount of resources. The large quadrats in conjunction wlth the visual method were probably more adequate for G. cydonium, given the apparent greater precision provided by this procedure for the large sponge. Caution is recommended in en~ployingdifferent researchers working on the same sampling project in extreme environments, at least before divergence among observers to c h a n g ~ n genvironmental conditions is accounted for. KEY WORDS: D e s ~ g nof sampling . Robustness . Precision . Efficiency . Submarine caves . Invertebrates Cost-benefit analyses
INTRODUCTION
Natural populations must be sampled in order to determine patterns of species distribution or the outcome of field experiments. Because of its central role in ecological research, there has been much theoretical and empirical concern about the methodology and the design of sampling (Green 1979, Greig-Smith 1983,
O Inter-Research 1996
Resale of full article not permitted
Andrew & Mapstone 1987). Procedures may vary according to the questions being asked, the complexity of the habitat under investigation, the spatial arrangement of the organisms and other features of the environment. In addition, logistic and economic considerations always impose constraints on the execution of sampling programs. Different methods may be compared in terms of accuracy and precision, and pilot studies have proved to be very helpful in determining the most efficient allocation of resources (Kennelly & Underwood 1984, 1985).
94
Mar Ecol Prog Ser 138: 93-101, 1996
The way organisms are quantified, the size of the sampling units and the number of replicates all affect the accuracy and precision of a given method and dictate the efficiency of a sampling program. Marine benthic ecologists often quantify the abundance of plants and sessile animals In terms of surface cover. Among the possible methods that can be used to obtain such estimates there are: (1) the point-intercept technique by means of grids of dots (either at fixed or random positions) scored directly in the field (e.g. Meese & Tomich 1992); (2) the point-intercept technique with estimates obtained by photographing or video recording the plots and projecting the images on a grid of dots in the laboratory (Littler & Littler 1985, Leonard & Clark 1993, Roberts et al. 1994); (3) visual estimates of cover (Dayton 1975, Dethier 1984, Meese & Tomich 1992, Dethier et al. 1993), and (4) electronic digitizing of images (Meese & Tornich 1992, Whorff & Griffing 1992). Studies have addressed questions about the relative precision and accuracy of some of these methods and have compared their robustness to bias due to observers (Foster et al. 1991, Meese & Tomich 1992, Dethier et al. 1993). There are advantages and disadvantages associated with each of these methods. For example, photographic and video techniques provide permanent records of a particular situation and reduce the time spent in the field, but cover estimates may be less accurate and precise than those obtained by direct inspection of the plots (Foster et al. 1991, Leonard & Clark 1993). Visual sampling is not a probabilistic method and can be subjective, but Dethier et al. (1993) found it more accurate, precise and rapid than the point-intercept technique with random points. These authors also found that visual estimates were less subject to bias due to observers than random points. Opposite conclusions were drawn by Meese & Tomich (1992) for estimates of cover of the red alga Endocladia muricata and for the aggregate cover of macroalgae in their plots. Inconsistency in results among the 2 studies might have arisen, in part, because of variability in species composition among the 2 assemblages, variability among observers and slight differences in the technique (Dethier et al. 1993 used small subdivisions in quadrats to help scoring). Perhaps the message from these studies is that no approach is generally valid, and the adequacy of a given method should be evaluated in any particular situation. This study was done in a submarine cave (Grotta Azzurra, Capo Palinuro. Italy), where multidisciplinary investigations are carried out on shallow-water thermal vents. Little attention has been paid to methods for sampling benthic fauna in submarine caves, and in most previous studies sampling is unreplicated (Cinelli et al. 1977, Balduzzi et al. 1985, Gili et al. 1986).These systems provide variable environmental conditions
affecting the distribution of organisms and the performance of observers. Absence of sunlight and turbidity may interfere with scoring of plots, and the closed environment may cause additional stress to the divers. Our aim was to compare different procedures commonly used on rocky shores for their robustness to bias due to observers and precision. In addition, pilot studies were done to determine spatial variation in the abundance of organisms between positions at 3 different distances from the entrance to the innermost part of the cave and among areas within each position. Cost-benefit analyses were done to determine optimal number of replicates and replicated areas for each method. Thus, the most adequate procedure of sampling was identified as the best compromise between repeatability among observers, precision and maximization of replication given a fixed amount of resources.
METHODS Study site. This study was done in May 1994 in the Grotta Azzurra Cave of Capo Palinuro, on the southwest coast of Italy (western Mediterranean). This is a large cavity of about 120000 m3 in volume and with a maximum depth of about 30 m (Alvisi et al. 1994). Below the main entrance, the cave opens in a wide chamber (also known as Central Hall) accessible by boat from the surface, extending to a secondary underwater entrance. Here light is reduced but still present, and currents create water exchanges with the open sea. A smaller inner hall (hereafter Snow Hall) opens on the left wall of Central Hall with respect to the main entrance. Snow Hall is shallower (about 15 m), completely dark and has a reduced hydrodynamic regime. A main feature of this part of the cave is the occurrence of sulphur water springs originating an oxic-anoxic interface at about 9 m depth, with the thermal water stratified above the sea water. Dense mats of sulphur oxidising bacteria are present on the rocky surfaces of the vault and the sides above the chemocline. In contrast, all the hard substrata below the chemocline support a rich assemblage of epifaunal organisms. The most conspicuous organisms in these areas are sponges (particularly Geodia cydonium and Petrosia ficiformis) and cnidarians (Astroides calycularis and Leptosammia pruvoti).A detailed description of patterns of distribution of these organisms will be reported in a separate paper. Further information on the fauna1 assemblages of this cave can be found in Southward et al. (1996). Comparison of methods. This study was designed to compare percent cover estimates of sponges and cnidarians obtained with different methods of sam-
Benedettl-Cecchi et al.: Sampling benthlc invertebrates
pling and different sizes of the sampling units, for their robustness to bias due to observers and precision. Sampling was done on the outer part of the vault of Snow Hall, where the complexity of the assemblage was high (authors' unpubl. data). Three divers participated in the sampling program. Twelve dives were done, and 6 plots, distributed at random on the vault, were sampled by all the observers during each dive. Different plots were located during different dives. Each time, 3 of these plots were sampled with plexiglass sheets supporting 100 evenly spaced dots, while in the other 3 quadrats percent cover values were obtained by visual estimates. In this case a plexiglass sheet divided into 25 small quadrats was used, and a score from 0 to 4 O/o was given to each species in each small square (Dethier et al. 1993). For each method, quadrats of 2 different sizes were used: 0.25 and 0.04 m'. Sampling was done with the larger quadrat for 6 dives (chosen at random) and with the smaller one in the other 6. In addition, to account for differences in estimates d u e to stress, sampling was done at 2 different times (again assigned at random to dives): at the beginning of the dive or after some time (usually 45 min) spent working on something else. In summary, there were 3 replicated dives for each combination of sample size X stress a n d 2 different methods employed in each dive. Three replicated quadrats were sampled with each method by all the observers (Table 1). These data were analysed using repeated-measures analysis of variance (ANOVA),with dives and plots as random factors and the other variables considered fixed. Observers were fixed (but see 'Discussion') because they had different experiences with nondestructive sampling, ranging from high training (5 yr) to medium training (2.5 yr) and no training. Dives were nested within each combination of stress and size of quadrats, while method (visual vs point-intercept) was
95
orthogonal to these factors. The assumption of 'compound symmetry' was tested by the sphericity test using Mauchly's criterion (Crowder & Hand 1990). Interactions between observers and the other terms provided tests for the robustness of the different methods to bias d u e to observers. A central assumption of these analyses is that the differences among observers are constant in magnitude and direction from plot to plot (Winer 1971). In other words the observer X plot interactions should provide a n estimation of the residual variance. If this assumption is violated, there a r e no hypotheses related to the other sources of variation in the model (Underwood 1981). Unfortunately, there is no direct way to test for this assunlption with non-independent data. However, results from pilot studies in the same habitat and on the same species (see below) provided independent estimates of residual mean squares (for each method a n d size of quadrat) similar to, or higher than, those obtained with the repeated-measures design (compare Tables 2 & 4 for Astroides calycularis). This suggests that the observer X plot interactions were probably negligible. In addition, it should be stressed that there is no interest at all in testing for these interactions, as no plot will be sampled by more than 1 observer during the real sampling (i.e. in any future sampling program). The relative precision of the different methods a n d size of quadrats was assessed by comparing the standard errors (Andrew & Mapstone 1987) calculated for each observer from the 3 replicated plots sampled during each dive with each of the 2 methods. Two-way ANOVAs were used for these comparisons. Variability among dives a n d levels of stress were not considered in these analyses, a s it is likely that sampling activity will encompass a wide range of environmental conditions in any real program. Thus, the main interest here is in the overall performance of each Table 1. Scheme of the sampling design used to compare differ'ent Sizes ~rocedure. of sampling units (50 X 50 vs 20 X 20 cm) a n d different methods (visual vs Pilot studies. Pilot studies were done to point-intercept) for their repeatibility among observers and precision. determine 'patia1 variation in the abundance Six plots were randomly sampled during each dive with quadrats of a of e ~ i f a u n aspecies between 3 Positions from particular size just at the beginning (low stress) or a t the end (high stress) of the dive. There were 3 replicate plots for each of the 2 methods and the entrance towards the innermost part of every plot was sampled by the 3 observers Snow Hall (10 to 20 m apart), and among areas within each position (4 to 5 m apart). Size of Stress Dive Method of Replicated ObThe relative abundance of sponges a n d quadrats (cm) sampling plots servers cnidarians was determined bv a sinqle " observer for each method a n d size of 50 X 50 High 1, 2 & 3 Visual 1,2&3 1,2&3 quadrats. Two areas (3 to 4 m* each) were 1, 2 & 3 High 1 , 2 & 3 Point-intercept 1, 2 & 3 50 X 50 Low 1, 2 & 3 Visual 1,2&3 1,2&3 50 X 50 located at each position, and 3 replicate plots Low 1, 2 & 3 1, 2 & 3 Point-intercept 1, 2 & 3 50 X 50 were sampled in each area. High 1, 2 & 3 Visual 20 X 20 1,2&3 1,2&3 Nested ANOVAs and cost-benefit analyses 20 X 20 High 1, 2 & 3 Po~nt-intercept 1, 2 & 3 1, 2 & 3 were used to determine the optimal number 20 X 20 Low 1, 2 & 3 Visual 1,2&3 1,2&3 of replicate plots a n d areas for each method. 20x20 Low 1 . 2 & 3 Point-intercept 1 . 2 & 3 1,2&3 Standard procedures (Snedecor & Cochran
M a r Ecol Prog Ser 138: 93-101, 1996
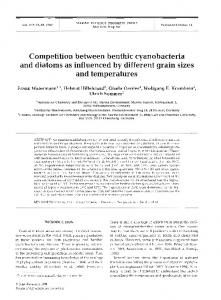
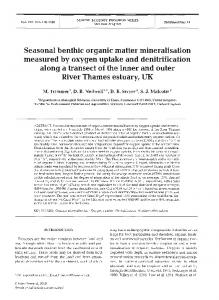
significantly from dive to dive. Differences ranged from a minimum of 0.7 % to a maximum of 14.3%. Also, variability between observers changed in relation to - -the method employed, as indicated by the significant interaction observer X method. However, although the n = ,1 s,'.c, (1) h % ( P , . Cr rank of divers changed with method, overall differences in the estimates of cover were very similar (2% where S: is the estimated variance among replicates, with the point-intercept technique and 3.2% with the is the C, is the cost (in terms of time) per area, visual method). No other source of variation was sigestimated variance among areas and C, is the cost (in nificant in this analysis. terms of time) per replicate. The variances for estiVariability also occurred for estimates of the mean mated means were determined from the appropriate mean squares resulting from the nested ANOVAs abundance of Leptosainnua pruvoti. In this case the (Winer 1971, Underwood 1981). The optimal number second-order interaction observer X method X dives (nested in each combination of size of quadrat X stress) of areas ( a ) was determined as: was significant (F16,96 = 1.9, p = 0.0296). Differences Cost of each position '1 = from dive to dive ranged from 0.7 to 7 % with the point(2) nC, t C, intercept technique and from 0.7 to 11 % with the visual method. In addition, the large quadrats produced greater mean estimates of cover than the small RESULTS = 17, p = 0.0033). sampling units for this species (F1,8 Estimates of the mean percent cover of the sponges Comparison of methods Petrosia ficiformis and Geodia cydonium were not affected by observers nor by interactions between An illustrative repeated-measures ANOVA is reobervers and any other term in the model. Significant ported in Table 2 for estimates of the cover of Astroides effects due to the size of quadrats were found for l? calycularis. Observers produced different estimates of ficiformis (F1,8= 5.5, p = 0.0478), with the large units the mean abundance of this cnidarian that changed producing higher means. The data for Table 2. Repeated-measures ANOVA on the effects of size of quadrats ( Q ) ,stress G. cydonium did not conform to the (S),d ~ v e (s D ) ,method of sampling ( M ) ,observers (0)a n d plots (P) on the estimaassumption of ~ c o m p o u nsymmetryf ~ t ~ o nof the percentage cover (angular transformed) of the cnidarian Astroides (Mauchly's test: W = 0.869, X* = 6.6, calyculans. The assumption of 'compound symmetry', a s tested by the sphericdf = p = 0.0369), since ity test using Mauchly's criterion (Crowder & Hand 1990), was satisfied. Bold the effects was significant, this did not numbers indicate significance a t p < 0 05 compromise the interpretation of the analysis. Source of df MS F P Fratio variation versus The small quadrats were more precise than the large ones when used to Between subjects estimate the percent cover of Astroides Q 1 0.6889 4.98 0.0561 D(Q X S ) calycularis and Leptosammia pruvoti, l 0.0875 0.63 0.4492 D(Q X S ) S QxS L 0.1740 1.26 0.2943 D(Q X S ) irrespective of the method employed 8 0.1382 1.29 0.2715 P(M(Q X S ) ) D(Q x S) (Fig. 1). These differences were sigM 1 0.0815 0 36 05647 M x D ( Q x S] nificant in both cases (Table 3). In MXQ 1 0.0068 0.03 0.8664 M X D(Q X S) particular, the highly significant effect i 0.0005 0.00 0.9619 M X D(Q X S) MXS MxQxS 1 0.0301 0.13 0.7245 M X D(Q X S ) observed for A. calycularis makes the M X D(Q X S) 8 0,2261 2.11 0.0531 P[M X D(Q X S ) ] result robust to the slight heterogeneP[M X D(Q X S ) ] 48 0.1072 ity of vanances revealed by Cochran's Within subjects C-test (C,, = 0.43). In contrast, a sig0 ! 0.0072 1.27 0.3085 0 X D(Q X S ) nificant interaction between method 0x Q I 0.0002 0.04 0.9590 0 X D(Q X S ) 0X S 2 0.0052 0.91 0.4208 0 x D ( Q x S) and size was observed for Petrosia ficiOxQxS 2 0.0026 0.45 0.6460 0 X D(Q X S ) formis, the precision of the method 0 xD(Q X S) 16 0.0057 3.03 0.0004 0 X P[M X D(Q X S ) ] depending upon the size of the 2 0.0113 5.90 0.0120 OxMxD(QxS) OxM OxMxQ 2 0.0009 0.49 0.6234 0 X M X D(Q X S ) quadrat being sampled (Table 3). In 2 0.0054 2.83 0.0885 0 X M X D(Q X S) OxMxS this case the small quadrats were more OxMxQxS 2 0.0040 2.10 0.1550 0 X M X D(Q X S) precise if sampled with the visual 0 X IM X D(Q X S) 16 0.0019 1.02 0.4443 0 X P[M X D(Q X S ) ] method, while the reverse occurred for 0 X PIM X D ( Q X S ) ] 96 0.0019 the large quadrats (Fig. 1, Table 3). 1967, Winer 1971, Underwood 1981) were used for calculations. In particular, the number of replicate plots per area ( n )was determined as:
2l
Benedetti-Cecchi et al.. Sampling benthic invertebrates
"
Astroides Leptocalycular~s sammia pruvoti
97
with the point-intercept technique, and for Astroides calycularis and Geodia cydonium when used in conjunction with the visual method (Table 4 ) . Note that variances were heterogeneous for G. cydonium In 2 out of 4 analyses (Table 4 ) . Results of cost-benefit analyses are summarized in Table 5 for each species, method of sampling and size of quadrats. The cost per replicate plot (i.e. the time needed to sample a quadrat) was determined during the previous sampling program for each procedure. On average, 2 min were necessary to sample a plot of 20 X 20 cm with the point-intercept technique, 1.8 min for a plot of the same size but with the visual method, 3.5 min for a quadrat of 50 X 50 cm with the pointintercept technique, and 2.3 min for a large quadrat with the visual method. The cost per area (i.e. the cost to manoeuvre among areas) was 1 min. The optimal number of replicate plots per area (determined from Eq. 1) was in most cases less than 1 and always less than 2. This resulted because the variability among areas was large, in agreement with the results of more extensive sampling programs in the same habitat (Benedetti-Cecchi et al. unpubl.), and C, was always lower than C,. To provide a minimum of replication in each area, we set the number of replicate plots at 2 for any method and size (Table 5). Increasing the number of plots also enhances protection from possible overestimations of S&P,due to the low number of areas in each position. Because of logistic constraints and according to our previous experience, the total time available to sample this cave in the future (considering all 3 positions) cannot exceed 120 min per field trip. Thus, 40 min will be available for each position. From Eq. (2) and using the optimal number of replicate plots, the optimal number of replicate areas for each position was determined. The anticipated standard errors are also reported (Table 5). As a result, the small quadrats in conjunction with the visual method will maximize replication of areas in any future sampling program on this cave.
Petrosia Geod~a ficiformfs cydonium
Fig. 1 Precision of estimates of the coverage of sponges and cnidarians sampled with different methods and using quadrats of different size. Plotted values are mean standard errors ( + lSE, n = 18) which are inversely related to precision
Finally, estimates of percent cover of Geodia cydonium were not affected by the size of quadrats nor by the method employed (Table 3), although a trend toward a greater precision of the large units when sampled with the visual method was evident (Fig. 1).
Pilot studies
Data on the spatial distribution of a given species were analysed independently for each method and size of sampling unit. There was considerable variability in the distribution of sponges and cnidarians among areas within each position from the entrance of Snow Hall. Significant differences were found for all organisms, but not all methods and quadrats produced the same results (Table 4). For example, the pointintercept technique in conjunction with the large quadrats produced significant effects for all species but Leptosammia pruvoti. In contrast, no effect was detected using quadrats of the same size as before but using the visual method instead (Table 4). Units of small size yielded significant differences among areas for L. pruvoti and Petrosia ficiformis when sampled
Table 3. Results of ANOVAs on the effects of method and size of the sampling unit on the precision of estimates (standard errors) of coverage for sponges and cnidarians. Bold numbers indicate significance at p < 0.05 Source of variation Method Size Method X Size Residual Transformation Cochran's C-test
df Astroides calycularis MS F p 1 1 1 68
1491 3.128 0.262 0.433
3.4 7.2 0.6
0.068 0.009 0.440
Square root C = 0 45, p < 0.05
Species Leptosammia pruvoti Petrosia ficiformis MS F p MS F p 0.021 2.218 1.635 0.537
0.0 0.845 4.1 0.046 3.0 0.086
Square root C = 0.37, p > 0.05
8.562 0.129 111.840 13.75
0.6 0.0 8.1
0.433 0.923 0.006
None C = 0.37, p > 0.05
Geodia cydonium MS F p 0.371 0 142 1815 0.698
0.5 0.2 2.6
0.469 0.653 0.111
Mar Ecol Prog Ser 138: 93-101, 1996
Table 4. Results of nested ANOVAs on the effects of positions and areas within positions for each species, method of sampling and size of quadrats. Data entries are percent coverage values. Bold numbers ind~cateslgnlficance at p < 0.05 Method and size
Source of variation
df
Point-intercept 20 X 20 cm
Position Areas(Position) Residual
2 3 12
Transformation Cochran's C-test Point-intercept 50 X 50 cm
Position Areas(Posit1on) Residual
2
3 12
Position Areas(Position) Residual Transformation Cochran's C-test
Visual 50 X 50 cm
Position Areas(Position) Residual
322.7 0.4 0.712 847.2 8.0 0.004 106.6
160.1 0.4 0.707 410.1 3.1 0.065 130.6
None C = 0.39, p > 0.05
None C = 0.44, p > 0.05
None C = 0.57, p > 0.05
1567 2.4 0.241 6 5 9 5.9 0.011 11.2
158.2 0.6 0.608 268.5 2.3 0.133 118.2
0.085 0 5 0.649 0.169 6 2 0.009 0.028
0.023 0.2 0.802 0.099 4.8 0.021 0.021
None
None C = 0.53, p > 0.05
Angular C = 0.43, p > 0.05
Angular C = 0.66, p < 0.05
263.6 1.5 0.352 168.2 1.4 0.278 116.8
957.7 2.7 0.211 357.4 2.5 0 112 144.7
0.052 0.3 0.767 0.180 12.4 0.001 0.015
None C=0.44,p>0.05
None C=0.61,p>0.05
Angular C-0.76, p 0.05
None C = 0.49, p > 0.05
Angular C = 0.59, p > 0.05
C = 0.48, p > 0.05
2 3 12
0.105 1.6 0.340 0.067 8.7 0.003 0.008
Angular C=0.38,p>0.05 2 3 12
Transformation Cochran's C-test
Geodia cydonium MS F p
81.6 0.2 0.841 444.0 5.8 0.011 76.3
0.044 2.07 0.272 0.021 1.53 0.257 0.014
Angular C = 0.37, p > 0.05
Transformation Cochran's C-test Visual 20 X 20 cm
Species Astroldes calycularis Leptosammia pruvoti Petrosia ficiformis MS F p MS F p MS F p
109.1 1.2 0.424 94.1 3.1 0.069 30.7
None C = 0.49, p > 0.05
Table 5. Summary of cost-benefit analyses for sampling percent coverage of sponges and cnidanans in a submarine cave
Astroides calycularis Method: Point Visual Size:
Leptosammia pruvoti Point Visual
e
( 7 40 9 L O+e 43 0 6 ' %LO 4 4 (309 ( 7 0 3 0 LOS9 9
Variancemong 18.2 0.002 21.1 0.020 areas Optunal number 2 2 2 2 of rephcates Optimal number L J of areas Estimated SE 2.2 0.034 2.3 0.05
LO9
0.028 106.6
165.7 144.7
0.021 130.6
0.044 0.015
17.1
0.047 246.9
130.3 70.9
0.026 93.2
0.025 0.055
2
2
2
2
I
,
J
J
U
7.4
2.9
0.110
6.1
50.1122.6 223.5
2 4.7
2 8 45
LOe 4 -
(306'
118.2 76.3 323.8 116.8
2
9 9
Geodia cydonjum Point Visual
( 3 043 (309
4
~$,",~~smOng 11.2 0.014 30.7 0.008
Species Petrosia ficif0m.s Point Visual
DISCUSSION
In this study, different procedures for sampling benthic invertebrates have been evaluated in terms of repeatibility among observers, precision and maxirnization of replication for a fixed amount of resources. As stated by other authors (Meese & Tomich 1992), no approach is free of problems, and our results are consistent with thls view. In particular, the performance of
@
%
CL0
4
( I : +
4
2
5.5
4-
2
4
%
2
2
2 J
J
J
U
7
4.0
0.085
4.5
0.082 0.083
the procedures tested here changed from species to species, and the procedure most adequate for a given criterion did not necessarily meet the requirements of the others. Thus, the optimal strategy of sampling is a compromise between relative advantages and disadvantages. Results showed that: (1)there was a significant observer X method interaction for Astroides calycularis, but although the rank of observers changed with method, the overall d~fferencesin the estimates of
Benedetti-Cecchi et a1 Samp#lingbenthic invertebrates
cover were similar; (2) divergence among observers was not constant from dive to dive for A. calycularis (observer X dive interaction) and also in relation to the method employed for Leptosammia pruvoti (observer X method X dive interaction); (3) the small quadrats were more precise than the large ones in determining the abundance of cnidarians irrespective of method. In contrast, precision depended upon the t e c h n ~ q u eused to score the quadrats for Petrosia ficiformis, the small sampling units being more preclse if used in conjunction wlth the visual method. Apparently, visual estimates from large quadrats were more precise than any other procedure to sample the cover of Geodia cydonium; (4) cost-benefit analyses allocated more resources to replication of areas rather than to plots per area, given the great variability occurring at the larger scale. The small quadrats in conjunction with the visual method provided the best procedure to maximize replication of areas given a fixed amount of resources. Dethier et al. (1993) found the visual method more robust to bias due to observers than the point-intercept technique, when used to sample macroalgae in the intertidal. In contrast, Meese & Tomich (1992) found greater variability among observers with the visual method in a similar environment. These differences have been discussed in terms of relative sensitivity of methods to variability in experience and training between observers. However, results are often inconclusive (e.g. Meese & Tomich 1992), and comparisons between observers with different experience are confused with intrinsic differences among individuals (there must be replicate observers for each level of training to avoid this sort of confusion). This problem also occurred in the present study; therefore divergence among observers will not be discussed in terms of experience. However, it is worth noting that although divers changed their order of rank in relation to the method employed, only slight differences occurred. Further, variability due to observers in relation to some other factors (e.g. method or dlves) was not observed for sponges. This may have come about because of the different size and spatial arrangement of sponges and cnidarians in the cave, the former being larger and less dispersed in quadrats than the latter. The visual method, as used in this study and in Dethier et al. (1993), is based on the mental grouping of organisms In subquadrats. If the size of the 'biological unit' being sampled is very small relative to the subquadrat, grouping may become problematic (also recognized by Dethier et al. 1993) and the procedure more prone to bias d u e to observers. The results of this study also suggest that the performance of observers may be affected by environmental factors, as indicated by the significant interactions observer X dive for Astroides calycularis and observer X
99
method X dive for Leptosammia pruvoti. Again, these interactions were not found for sponges, possibly because of their relatively large size. An additional problem with A. calycularis was that this species might have been confused with another cnidarian, Cariophyllia inornata, because of similarities in size, shape and colour (although A. calycularis is colonial and C. inornata is not). Differences among observers from dive to dive ranged from a minimum of 0.7 % to a maximum of 14.3% for A. calycularis, and from 0.7 to 11% for L. pruvoti. These results suggest that local environmental factors that are likely to change through time (e.9, turbidity of the water, general conditions of the sea) may have important effects on the performance of a diver, also influencing his (her) psychological and emotional status. These factors are obviously interrelated and there is no reason to assume homogeneity across observers. Of course, training may reduce this variability. Logistic problems may also interfere with the sampling activity. For example, on 2 occasions the main source of light for a particular observer stopped working before the e n d of the dive. In this case, sampling was completed using a secondary, less powerful light. This may have increased the differences among observers, particularly for estimates of cover of small organisms (i.e,cnidanans). Few studies have explicitly investigated the robustness of a given method of sampling to b ~ a sd u e to observers (e.g.Meese & Tomich 1992, Dethier et al. 1993, Inglis & Lincoln Smith 1995) a n d whether a given sampling program is completed by a single researcher or by a team is rarely reported in published papers. Thls study demonstrates that divergence among observers may change significantly in different environmental circumstances, a n d this might occur in other subtidal systems as well (e.g. kelp forests and seagrasses). This suggests caution in employing different researchers in the same sampling project, at least before this source of variation is accounted for. Although changes on the order of 10 % may be unimportant in many cases, they may be critical if the size of the effect under investigation is small. The size of the unit of sampling may have a strong effect on the precision of the estimates being collected (Elliot 1977, Southwood 1978, Dowing & Anderson 1985, Dowing & Cyr 1985, Morin 1985, Andrew & Mapstone 1987). The concept of size here is relative to the scale of aggregation of the organisms. Var~ation among replicates is expected to be large when the size of the unit of sampling is close to the average distance among aggregations (Andrew & Mapstone 1987). In contrast, estimates coming from large units are likely to be less affected by patterns in the spatial arrangement of populations (Elliot 1977, Southwood 1978, Green 1979). Surprisingly, the small quadrats gave more precise estimates of the cover of cnidarians than
100
lMar Ecol Prog Sc
the large ones in this study. This result is counterintuitive a n d difficult to explain. Even more difficult is to explain why precision was affected interactively by size and method for Petrosia ficiformis. A potential explanation for cnidarians is offered by the results of the pilot study. Spatial variation in the distribution of organisms was very large among areas (Table 4), while variability within areas (Le, among replicates) was low. This suggests that the scale of aggregation of organisms was large relative to the size of both units. Thus, sampling a plot of 50 X 50 cm or a plot of 20 X 20 cm made little difference with respect to the patterns of spatial arrangement of cnidarians. In contrast, differences in size might have been important with respect to the heterogeneity of the substratum. In general, the small quadrats fitted better than the large ones among the asperities of the substratum. In some cases the large quadrats were kept at a distance of 20 to 30 cm from the substratum because of the presence in the sampling area of a rock or a sponge (Geodia cydonium) protruding from the vault. In these circumstances a n observer might have erroneously scored organisms well beyond the limits of the quadrat, because the surface perceived as the area of sampling was greater than the real one, the former being positively related to the distance between the quadrat and the substratum. Thus, the large units might have introduced a greater bias than the small ones, resulting in reduced precision and probably overstimating the abundance of organisms. This might also explain why estimates of the cover of Leptosammia pruvoti a n d P ficiformis obtained with the large quadrats were significantly greater than those obtained with the small ones. With regard to the question of which procedure provides the optimal strategy of sampling, overall results suggest the use of small quadrats in conjunction with the visual method is appropriate for all species but Geodia cydonium. This procedure should provide the best combination of precision a n d efficiency (cost of obtaining a given level of precision) for both cnidarians a n d Petrosia ficiformis, allowing maximization of replication of areas in future studies. The use of large quadrats sampled with the visual method is probably the best solution for G. cydonium, glven the apparent greater precision of this procedure for the large sponge (Fig. 1).The disadvantage due to the lower repeatability associated with the visual method is considered irrelevant. Divergence among observers was very similar for the 2 methods, a n d it was very low with respect to the background of variation occurring in the system. In contrast, the effects due to variability in the response of observers to changing environmental conditions must b e considered carefully in future studies, particularly if hypotheses about temporal variation are of concern.
Acknowledgements. We thank M. S Foster and A J Underwood for c r ~ t ~ ccomments al on the manuscript. We also thank A. J. Underwood, M. G. Chapman and the participants in the course of experimental design held in Evora (Portugal) in May 1995, for stimulating discussion. This study was funded in part by the EC under MAST programme contract MAS2CT93-0058.
LITERATURE CITED Alvisi M, Barbieri F, Bruni R, Cinelli F, Colantoni P. Grandi GF, Maltoni P (1994) La Grotta Azzurra di cap0 Pallnuro (Salerno).Mem 1st It Spel2nd Ser 651-56 Andrew NL, Mapstone BD (1987) Sampling and the description of spatial pattern In marine ecology. Oceanogr Mar Biol A Rev 25:39-90 Balduzzi A, Pansini M, Pronzato R (1985) Estimation par relevements photographiques de la distribution d e spongiaires et bryozoaires dans un grotte sous-marine du Golfe de Naples. Rapp C o ~ m Int Mer Medlt 29:13!-134 Cinell~F, Fresi E, Mazzella L, Panslni M. Pronzato K, Svoboda A (1977) Distribution of benthic phyto- and zoocoenoses along a light gradient in a superficial marine cave of the Sorrentlne Peninsula. In. Keegan BF, Leidingh 0, Boaden PJS (eds) Biology of benthic organisms. Pergamon Press, London, p 173-184 Crowder MJ. Hand DJ (1990) Analysis of repeated measures. Chapman and Hall, London Dayton PK (1975) Expenmental studies of algal canopy interactions in a sea otter-dominated kelp community at Amchitka Island, Alaska. Fish Bull US 73:230-237 Dethier MN (1984) Disturbance and recovery in intertidal pools: maintenance of mosaic patterns. Ecol Monogr 54: 99-118 Dethier M N , Graham ES, Cohen S, Tear LM (1993) Visual versus random-point percent cover estimations: 'objective' is not always better. Mar Ecol Prog Ser 110:9-18 Dowing JA. Anderson MR (1985) Estimating the standing biomass of aquatic macrophytes. Can J Fish Aquat Sci 42: 1860-1869 Dowing JA, Cyr H (1985) Quantitative estimation of epiphytic invertebrate populations. Can J Fish Aquat Sci 42: 1570-1579 Elliot JM (1977) Some methods for the statistical analysis of samples of benthic invertebrates, 2nd edn. Freshwater Biological Association, Ambleside Foster MS, Harrold C, Hardin DD (1991) Point vs. photo quadrat estimates of the cover of sessile marine organisms. J Exp Mar Biol Ecol 146:193-203 G111JM, Riera T, Zabala M (1986)Physical and biological gradients in a submarine cave on the Western Mediterranean coast. Mar Biol 90:291-297 Green RH (1979) Sampling design and statistical methods for environmental biolog~sts.John Wiley & Sons, New York Grelg-Smith P (1983) Quantitative plant ecology. University of California Press, Berkeley Inglis GJ, Lincoln Smith MP (1995) An examination of observer bias a s a source of error in surveys of seagrass shoots. Aust J Ecol 20:273-281 Kennelly SJ, Underwood AJ (1984) Underwater microscope sampling of a sublittoral kelp community. J Exp Mar Biol Ecol 76:67-78 Kennelly SJ, Underwood AJ (1985) Sampling of small invertebrates of natural hard substrata in a sublittoral kelp forest. J Exp Mar Biol Ecol 89:55-67
Benedetti-Cecchi et al. Sampling benthic invertebrates
101
Leonard GH, Clark RP (1993) Polnt quadrat versus video transect estimates of the cover of benthic red algae Mar Ecol Prog Ser 101 203-208 Littler MM, Littler DS (1985) Nondestructive sampllng In Littler MM, Littler DS (eds) Handbook of phycological methods-field methods macroalgae C a m b n d g e Universlty Press, C a m b n d g e , p 161-175 Meese RJ Tomlch PA (1992) Dots on the rocks a companson of percent cover estlrnation methods J Exp Mar Biol Ecol 165 59-73 Monn A (1985) Vanability of density estimates and the optimization of sampling progranls for stream benthos C a n J Fish Aquat Sci 42 1530-1534 Roberts DE, Fitzhenry SR, Kennelly SJ (1994) Quantifying subtidal macrobenthic assemblages on hard substrata using a jump camera method J Exp Mar Biol Ecol 177 157-170
Snedecor GW Cochran WG (1967) Statlstlcal methods, 6th e d n Iowa State University Press, Ames Southward AJ, Kennicutt M C , Alcala-Herrera J , Abbiati M , Airold1 L , Cinelli F, Bianchi CN, Morn C, Southward E C (1996) O n the biology of s u b m a n n e caves wlth sulphur s p n n g s appraisal of I3C/l2C ratios as a guide to trophic relations J Mar Biol Ass UK 76 265-285 Southwood TRE (1978) Ecological methods, 2nd e d n Chapman and Hall, New York Underwood AJ (1981) Techniques of analysis of vanance In experimental m a n n e biology a n d ecology Oceanogr Mar B101 A Rev 19 513-605 Whorff JS, Grlffing L (1992) A video recording and analysis system used to sample intertidal communities J Exp Mar B101 E C O160 ~ 1-12 W ~ n e BJ r (1971) Statistical pnnciples In experimental designs, 2nd e d n McGraw-Hi11 Kogakusha, Tokyo
Thls article was submitted to the edit01
Manuscnpt first received: November 20, 1995 Revised version accepted: March 18, 1996