The Astrophysical Journal, 806:13 (11pp), 2015 June 10
doi:10.1088/0004-637X/806/1/13
© 2015. The American Astronomical Society. All rights reserved.
ESTIMATING THE HEIGHT OF CMEs ASSOCIATED WITH A MAJOR SEP EVENT AT THE ONSET OF THE METRIC TYPE II RADIO BURST DURING SOLAR CYCLES 23 AND 24 P. Mäkelä1,2, N. Gopalswamy2, S. Akiyama1,2, H. Xie1,2, and S. Yashiro1,2 1
The Catholic University of America, Washington, DC 20064, USA;
[email protected] 2 NASA Goddard Space Flight Center, Greenbelt, MD 20771, USA Received 2014 October 31; accepted 2015 April 7; published 2015 June 3
ABSTRACT We studied the coronal mass ejection (CME) height at the onset of 59 metric type II radio bursts associated with major solar energetic particle (SEP) events, excluding ground level enhancements (GLEs), during solar cycles 23 and 24. We calculated CME heights using a simple flare-onset method used by Gopalswamy et al. to estimate CME heights at the metric type II onset for cycle 23 GLEs. We found the mean CME height for non-GLE events (1.72 R☉) to be ∼12% greater than that (1.53 R☉) for cycle 23 GLEs. The difference could be caused by more impulsive acceleration of the GLE-associated CMEs. For cycle 24 non-GLE events, we compared the CME heights obtained using the flare-onset method and the three-dimensional spherical-shock fitting method and found the correlation to be good (CC = 0.68). We found the mean CME height for cycle 23 non-GLE events (1.79 R☉) to be greater than that for cycle 24 non-GLE events (1.58 R☉), but statistical tests do not definitely reject the possibility of coincidence. We suggest that the lower formation height of the shocks during cycle 24 indicates a change in the Alfvén speed profile because solar magnetic fields are weaker and plasma density levels are closer to the surface than usual during cycle 24. We also found that complex type III bursts showing diminution of type III emission in the 7–14 MHz frequency range are more likely associated with events with a CME height at the type II onset above 2 R☉, supporting suggestions that the CME/shock structure causes the feature. Key words: shock waves – Sun: corona – Sun: coronal mass ejections (CMEs) – Sun: radio radiation 1. INTRODUCTION
type III bursts are much higher than those of type II bursts. Type III radio bursts are caused by beams of electrons propagating along interplanetary magnetic field lines. Type-IIIproducing electrons are accelerated in flares, i.e., in the region of the magnetic field reconnection close to the solar surface. A special subgroup of type III bursts known as complex type III bursts is known to be connected with SEP events (Cane et al. 2002; MacDowall et al. 2003). However, Gopalswamy & Mäkelä (2010) analyzed a sequence of three complex type III bursts in 2008 April and found that only the two complex type III bursts accompanied by a type II burst actually resulted in an SEP event. Gopalswamy et al. (2000) noted that all observed complex type III events are associated with type II radio bursts in their study of 25 radio-rich CMEs. Reiner & Kaiser (1999) analyzed complex type III bursts in the frequency range of 1–14 MHz. They found that all events typically showed reduced radio emission around 7 MHz, which corresponds to a height of 2.5 R☉ in the solar corona. They speculated that the 7 MHz level corresponds to a disturbed coronal region that suppresses the propagating electron beam from emitting radiation because turbulence prevents the formation of a well-defined beam. Gopalswamy (2004) suggested that the existence of the diminution depends on the CME location with respect to the electron acceleration site and the observer because of possible effects on the propagation of electrons or radio waves by the intervening CME. In this study we estimate the height of the shock at the onset of the type II radio bursts. We assume that coronal shocks producing metric type II radio bursts are driven by CMEs. We calculate the CME height at the type II onset using a simple model that relies on the observational fact that the CME acceleration phase and the impulsive phase of the flare occur simultaneously (e.g., Zhang et al. 2001; Cliver et al. 2005). The CME height is estimated by assuming that the CME accelerates
Type II radio bursts occurring at metric wavelengths are known to be associated with coronal shocks (e.g., Wild & McCready 1950; Uchida 1960; Nelson & Melrose 1985). The type II radio bursts are identified as slowly drifting features in radio dynamic spectra. The frequency of type II emission decreases as the shock propagates away from the Sun because the plasma density decreases as a function of radial distance. However, the temporal evolution and frequency characteristics of metric type II bursts can be quite complex due to variation of the plasma density in the low corona. The exact nature of the drivers of metrictype-II-producing shocks, i.e., whether they are flare blast waves or bow shocks ahead of a coronal mass ejection (CME), has been debated (e.g., Gopalswamy 2006; Vršnak & Cliver 2008), but it is generally accepted that type II radio bursts are caused by beams of shock-accelerated electrons that excite Langmuir waves that are converted into radio waves at the fundamental and second harmonic of the local electron plasma frequency (e.g., Nelson & Melrose 1985). Recently, Schmidt & Cairns (2014) have demonstrated an excellent agreement between observed type II bursts and the results of their magnetohydrodynamic simulations that incorporate a realistic three-dimensional (3D) CME model with an analytic kinetic radiation theory of type II emission. Their results give support to the interpretation adopted here that CME-driven shocks produce type II bursts. Because radio emission does not propagate along magnetic field lines, unlike solar energetic particles (SEPs), the onset of a metric type II burst anywhere on the visible solar disk can be readily observed. Therefore, metric type II bursts are suitable for analyzing the height of shock formation and the onset of particle acceleration by shocks in the corona. Solar eruptions with a type II radio burst are associated with other radio bursts like type III radio bursts. The drift rates of 1
Type II Date and Time (UT)
2
Nov 04 Apr 20 May 09 May 03 Jun 06 Jun 10 Jul 22 Sep 12 Oct 16 Nov 08 Nov 24 Mar 29 Apr 02 Apr 10 Apr 12 Sep 15 Oct 19 Oct 22 Nov 17 Nov 22 Nov 22 Dec 28 Jan 14 Feb 20 Mar 22 Apr 17 Apr 21 Aug 14 Aug 22 Sep 05 Nov 09 May 28 May 31 Jun 17 Oct 26 Nov 04 Nov 07 Nov 10 Jan 15 May 13 Dec 14 Aug 14 Mar 07 Jun 07 Aug 04 Aug 09
05:58 09:56 03:26 05:50 15:16 16:55 11:25 11:43 07:08 23:15 15:07 10:03 21:52 05:13 10:18 11:29 16:24 14:53 05:00 20:22 22:31 19:59 06:08 06:15 10:47 08:08 01:19 01:57 01:55 16:35 13:17 00:26 02:20 22:48 17:35 19:42 15:59 02:07 22:34 16:38 22:09 09:52 19:54 06:25 03:54 08:01
1997 Nov 04 1998 Apr 20 1998 May 09 1999 May 03 2000 Jun 06 2000 Jun 10 2000 Jul 22 2000 Sep 12 2000 Oct 16 2000 Nov 08 2000 Nov 24 2001 Mar 29 2001 Apr 02 2001 Apr 10 2001 Apr 12 2001 Sep 15 2001 Oct 19 2001 Oct 22 2001 Nov 17 2001 Nov 22 2001 Nov 22 2001 Dec 28 2002 Jan 14 2002 Feb 20 2002 Mar 22 2002 Apr 17 2002 Apr 21 2002 Aug 14 2002 Aug 22 2002 Sep 05 2002 Nov 09 2003 May 28 2003 May 31 2003 Jun 17 2003 Oct 26 2003 Nov 04 2004 Nov 07 2004 Nov 10 2005 Jan 15 2005 May 13 2006 Dec 14 2010 Aug 14 2011 Mar 07 2011 Jun 07 2011 Aug 04 2011 Aug 09
06:10 10:07 03:35 06:06 15:54 17:08 11:54 11:54 07:27 23:06 15:30 10:26 22:06 05:30 10:31 11:54 16:50 15:06 05:30 20:30 23:30 20:30 05:35 06:30 11:06 08:26 01:27 02:30 02:06 16:54 13:31 00:50 02:30 23:18 17:54 19:54 16:54 02:26 23:06 17:12 22:30 10:12 20:00 06:49 04:12 08:12
Speed (km s−1)
Width (deg)
Loc
993 1863 2331 1824 1348 1228 1476 1946 1336 1783 1532 1130 2609 2940 1294 586 1051 1603 1525 1472 1577 2216 1492 965 1750 1417 2422 1617 1034 2074 2159 1701 1888 1918 2491 2662 2218 3656 3682 2171 1139 1280 2223 1321 1477 1640
360 165 178 360 360 360 105 360 360 >170 360 360 244 360 360 130 360 360 360 360 360 360 360 360 360 360 241 133 360 360 360 360 360 360 >171 360 360 360 360 360 360 360 360 360 360 360
S14W33 S43W90 S11W90 N15E32 N20E18 N22W38 N14W56 S19W06 N03W90 N10W77 N22W07 N20W19 N19W72 S23W09 S19W43 S21W49 N15W29 S21E18 S13E42 S25W67 S17W36 S24E90 S28W90 N12W72 S10W90 S14W34 S14W84 N09W54 S07W62 N09E28 S12W29 S07W20 S07W65 S07E55 N02W38 S19W83 N09W17 N09W49 N15W05 N12E11 S06W46 N17W52 N31W53 S21W54 N19W36 N17W69
Flare Onset Date and Time (UT) 1997 Nov 04 1998 Apr 20 1998 May 09 1999 May 03 2000 Jun 06 2000 Jun 10 2000 Jul 22 2000 Sep 12 2000 Oct 16 2000 Nov 08 2000 Nov 24 2001 Mar 29 2001 Apr 02 2001 Apr 10 2001 Apr 12 2001 Sep 15 2001 Oct 19 2001 Oct 22 2001 Nov 17 2001 Nov 22 2001 Nov 22 2001 Dec 28 2002 Jan 14 2002 Feb 20 2002 Mar 22 2002 Apr 17 2002 Apr 21 2002 Aug 14 2002 Aug 22 2002 Sep 05 2002 Nov 09 2003 May 28 2003 May 31 2003 Jun 17 2003 Oct 26 2003 Nov 04 2004 Nov 07 2004 Nov 10 2005 Jan 15 2005 May 13 2006 Dec 14 2010 Aug 14 2011 Mar 07 2011 Jun 07 2011 Aug 04 2011 Aug 09
05:52 09:38 03:16a 05:36 14:58 16:40 11:17 11:23a 06:40 23:04a 15:05a 09:57 21:32 05:06 10:13a 11:04 16:21a 14:27 04:49 20:18 22:28a 19:46a 05:29 06:06a 10:34a 07:46 00:43 01:47 01:47 16:18 13:08 00:17 02:13 22:27 17:21 19:38a 15:56a 01:59 22:25 16:30a 21:58a 09:38 19:43 06:16 03:49a 07:59a
Flare Peak Date and Time (UT)
Class
a4 −2 (km s )
h4 (R☉)
fit_h (R☉)
1997 Nov 04 1998 Apr 20 1998 May 09 1999 May 03 2000 Jun 06 2000 Jun 10 2000 Jul 22 2000 Sep 12 2000 Oct 16 2000 Nov 08 2000 Nov 24 2001 Mar 29 2001 Apr 02 2001 Apr 10 2001 Apr 12 2001 Sep 15 2001 Oct 19 2001 Oct 22 2001 Nov 17 2001 Nov 22 2001 Nov 22 2001 Dec 28 2002 Jan 14 2002 Feb 20 2002 Mar 22 2002 Apr 17 2002 Apr 21 2002 Aug 14 2002 Aug 22 2002 Sep 05 2002 Nov 09 2003 May 28 2003 May 31 2003 Jun 17 2003 Oct 26 2003 Nov 04 2004 Nov 07 2004 Nov 10 2005 Jan 15 2005 May 13 2006 Dec 14 2010 Aug 14 2011 Mar 07 2011 Jun 07 2011 Aug 04 2011 Aug 09
X2.1 M1.4 M7.7 M4.4 X2.3 M5.2 M3.7 M1.0 M2.5 M7.4 X2.3 X1.7 X20 X2.3 X2.0 M1.5 X1.6 M6.7 M2.8 M3.8 M9.9 X3.4 M4.4 M5.1 M1.6 M2.6 X1.5 M2.3 M5.4 C5.2 M4.6 X3.6 M9.3 M6.8 X1.2 X28 X2.0 X2.5 X2.6 M8.0 X1.5 C4.4 M3.7 M2.5 M9.3 X6.9
2.76 0.72 1.62 1.17 0.83 0.93 1.45 0.65 0.46 1.24 3.19 1.05 2.29 2.45 1.44 0.41 1.95 0.65 0.71 1.36 0.42 0.63 0.43 2.68 0.73 0.62 0.59 1.08 1.72 0.72 2.40 2.83 2.86 1.14 0.72 2.96 3.70 4.35 1.66 1.34 1.12 0.79 1.28 0.88 3.08 4.56
1.51 1.86 1.67 1.84 1.95 1.79 1.49 1.92 2.19 1.64 1.28 1.35 3.61 1.56 1.34 1.91 1.30 2.39 1.47 1.31 1.26 1.52 2.94 1.75 1.57 2.03 3.24 1.53 1.54 1.79 1.75 1.84 1.61 2.55 1.61 1.37 1.34 1.97 1.60 1.47 1.60 1.65 1.65 1.43 1.45 1.30
L L L L L L L L L L L L L L L L L L L L L L L L L L L L L L L L L L L L L L L L L 1.69 1.84 1.49 1.61 L
05:58 10:21 03:40 06:02 15:25 17:02 11:34 12:13 07:28 23:28 15:13 10:15 21:51 05:26 10:28 11:28 16:30 15:08 05:25 20:36 23:30 20:45 06:27 06:12 11:14 08:24 01:51 02:12 01:57 17:06 13:23 00:27 02:24 22:55 18:19 19:53 16:06 02:13 23:02 16:57 22:15 10:05 20:12 06:41 03:57 08:05
Mäkelä et al.
1997 1998 1998 1999 2000 2000 2000 2000 2000 2000 2000 2001 2001 2001 2001 2001 2001 2001 2001 2001 2001 2001 2002 2002 2002 2002 2002 2002 2002 2002 2002 2003 2003 2003 2003 2003 2004 2004 2005 2005 2006 2010 2011 2011 2011 2011
CME Date and Time (UT)
The Astrophysical Journal, 806:13 (11pp), 2015 June 10
Table 1 Event Data
Type II Date and Time (UT)
3
2011 2012 2012 2012 2012 2012 2012 2012 2012 2013 2013 2013 2014 a
Sep 22 Jan 27 Mar 07 Mar 13 Jul 06 Jul 12 Jul 19 Aug 31 Sep 27 Apr 11 May 15 May 22 Jan 07
10:39 18:10 00:17 17:15 23:09 16:25 05:25 19:48 23:44 07:02 01:37 12:59 18:17
CME Date and Time (UT) 2011 Sep 22 2012 Jan 27 2012 Mar 07 2012 Mar 13 2012 Jul 06 2012 Jul 12 2012 Jul 19 2012 Aug 31 2012 Sep 28 2013 Apr 11 2013 May 15 2013 May 22 2014 Jan 07
10:48 18:27 00:24 17:36 23:24 16:48 05:24 20:00 00:12 07:24 01:48 13:25 18:24
Speed (km s−1) 1905 2541 3146 1931 1611 1358 1631 1479 1376 1120 2127 1702 2410
Width (deg) 360 360 360 360 360 360 360 360 360 360 360 360 360
Loc
N09E89 N27W71 N17E27 N17W66 S13W59 S15W01 S13W88 S19E42 N06W34 N09E12 N12E64 N15W70 S15W11
Flare Onset Date and Time (UT) 2011 Sep 22 2012 Jan 27 2012 Mar 07 2012 Mar 13 2012 Jul 06 2012 Jul 12 2012 Jul 19 2012 Aug 31 2012 Sep 27 2013 Apr 11 2013 May 15 2013 May 22 2014 Jan 07
10:29 18:03a 00:13a 17:12 23:01 16:00a 05:07a 19:38a 23:36 06:55 01:16a 12:58a 18:04
Flare Peak Date and Time (UT)
Class
a4 −2 (km s )
h4 (R☉)
fit_h (R☉)
2011 Sep 22 2012 Jan 27 2012 Mar 07 2012 Mar 13 2012 Jul 06 2012 Jul 12 2012 Jul 19 2012 Aug 31 2012 Sep 27 2013 Apr 11 2013 May 15 2013 May 22 2014 Jan 07
X1.4 X1.7 X5.4 M7.9 X1.1 X1.4 M7.7 C8.4 C3.7 M6.5 X1.2 M5.0 X1.2
0.99 1.25 4.77 1.11 3.84 0.46 0.53 0.38 1.09 0.89 1.11 0.83 1.42
1.51 1.41 1.45 1.28 1.88 2.00 1.70 1.35 1.43 1.36 2.51 1.27 1.88
L 1.51 1.79 1.69 1.74 2.01 2.48 2.29 2.05 1.52 1.87 2.22 L
11:01 18:37 00:24 17:41 23:08 16:49 05:58 20:43 23:57 07:16 01:48 13:32 18:32
The Astrophysical Journal, 806:13 (11pp), 2015 June 10
Table 1 (Continued)
Flare onset time adjusted based on the logarithmic time derivative of the GOES soft X-ray flux.
Mäkelä et al.
The Astrophysical Journal, 806:13 (11pp), 2015 June 10
Mäkelä et al.
be located at the flank region of the CME-driven shock (e.g., Claßen & Aurass 2002; Zucca et al. 2014), but here we use the height of the leading edge. In addition, we briefly discuss the correlation between the properties of complex type III radio bursts and the estimated CME height. 2. EVENT SELECTION The initial data set consists of all major SEP events with a reported metric type II burst, excluding all GLE events, during the study period extending from 1997 November to 2014 January (see http://cdaw.gsfc.nasa.gov/CME_list/sepe/). We have followed the suggestion made by Thakur et al. (2014) and excluded the 2014 January 6 SEP event as a GLE event even though there is some discussion of whether or not this event fulfills the formal definition of a GLE event (e.g., Bazilevskaya et al. 2014). Major SEP events are defined as those with a peak proton intensity in the GOES > 10 MeV channel equal to or exceeding 10 pfu (1 pfu = 1 particle sr−1 cm−2 s−1). In principle, it is possible that our selected set of SEP events still includes GLE-like events because the detection of a GLE event depends on the observerʼs magnetic connection of the nose region (Gopalswamy et al. 2014b). However, GLE events are rare and hence the number of SEP events where the GeV-range particles remained undetected because the GOES spacecraft was not magnetically connected to the nose region of the shock is low. From the list of major SEP events with a metric type II burst, we selected all those events for which adequate GOES data of the associated soft X-ray flare was available. We used GOES 1–8 Å X-ray profiles and the daily NOAA Solar Event Reports (Edited Events) (http://www.swpc.noaa.gov/ftpmenu/warehouse.html) to determine the magnitude and the onset and peak times of the associated GOES X-ray flare. Flare locations are taken from NOAA reports or determined from images of the EIT (Delaboudinière et al. 1995) on board the Solar and Heliospheric Observatory (SOHO). The associated CMEs were identified using the Large Angle and Spectrometric Coronagraph (LASCO; Brueckner et al. 1995) CME catalog (http://cdaw.gsfc.nasa.gov/ CME_list/index.html; Yashiro et al. 2004; Gopalswamy et al. 2009b). Our final data set consists of 59 SEP events listed in Table 1. The columns in Table 1 are: the type II date (1) and time (2), the first observation date (3) and time (4) of the associated CME, the CME space speed (5) and width (6), the location of the associated flare (7), the flare-onset date (8) and time (9), the flare peak date (10) and time (11), the magnitude of the flare (12), the calculated constant acceleration of the CME (13), and the height of the CME (14) at the type II onset calculated using the flareonset method. The last column (15) of Table 1 gives the measured height of the CME at the type II onset obtained by 3Dfitting a spherical shock model to CME images. The onset times of the metric type II bursts listed in Table 1 are the earliest reported times compiled from the NOAA Solar Event Reports except for the onset times of the 2000 June 6 and November 8 events that are from Gopalswamy (2003). Often different observatories report different onset times for the same metric type II burst; therefore, by selecting the earliest onset times we guarantee that our estimation is the lowest CME height consistent with the radio observations. Some additional details of the entries in Table 1 are given in Sections 3 and 5 discussing data analysis methods.
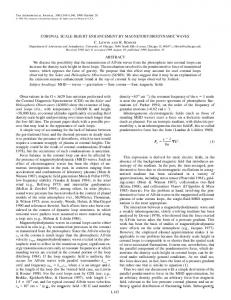
Figure 1. GOES soft X-ray light curves (red and blue lines) and time derivative of the 1–8 Å curve (green line) during the 2002 February 20 event. The horizontal dotted line marks the zero value of the time derivative shown on the right Y-axis and the vertical line marks the revised onset time of the flare at 06:06 UT.
at a constant rate from rest to the projection-corrected CME speed (i.e., the space speed of the CME) between the onset and peak time of the associated flare as explained in Gopalswamy et al. (2012b). The assumed constancy of the CME acceleration is naturally a simplification. Recent studies suggest that the peak times of hard X-ray emission (HXR) of the flare and the CME acceleration occur nearly simultaneously (e.g., Temmer et al. 2008; Berkebile-Stoiser et al. 2012). Gopalswamy et al. (2012b) used this flare-onset method to estimate the height of the CME at the onset of the metric type II burst for cycle 23 ground level enhancement (GLE) events. They found that the mean and median distances of the CME were 1.53 R☉ and 1.47 R☉, respectively. We expand their analysis to include all major non-GLE SEP events that occurred during 1997 November–2014 January. We also compare the CME heights between the previous cycle 23 and the ongoing cycle 24. For cycle 24 SEP events, we also estimate the shock formation height by fitting a spherical shock model to the extreme-ultraviolet (EUV) and white-light images of the CME and compare the heights with the results of the flare-onset method. This 3D spherical-shock fitting method differs from the wave-diameter method used by Gopalswamy et al. (2013), which uses only two-dimensional images taken from a single viewpoint. We assume that the radial distance where the CMEdriven shock forms corresponds to the height of the leading edge of the bright disturbance visible in the coronagraphic running difference images at the onset time of the type II radio bursts. Even though the shock propagates ahead of the CME, the distance between the shock nose and the driving CME is sufficiently small near the Sun. During some events, the shock sheath can be seen as a faint layer followed by the brighter driving CME (e.g., Sheeley et al. 2000; Vourlidas et al. 2003; Gopalswamy & Yashiro 2011). In these cases, the location of the shock is measured as the leading edge of the sheath. There is some evidence that the radio source of a metric type II could 4
The Astrophysical Journal, 806:13 (11pp), 2015 June 10
Mäkelä et al.
3. FLARE-ONSET METHOD FOR THE CME HEIGHT ESTIMATION Because we cannot accurately measure the radial height of a CME if its propagation direction deviates considerably from the sky plane, other indirect methods for estimating the CME height have been suggested. Recently, Gopalswamy et al. (2012b) described four different methods, which they used to estimate the CME heights of cycle 23 GLE events. Here we use the flare-onset method where the CME is assumed to be launched at the flare-onset time. The flare-onset and peak times are compiled from the online NOAA solar event reports. Occasionally solar flares occur in a close sequence and hence their light curves will overlap in GOES X-ray measurements. In such cases the onset time listed in the NOAA solar event report might correspond to a wrong flare. In order to verify the flareonset times, we analyzed the logarithmic time derivatives of GOES soft X-ray flare light curves (see Figure 1) and adjusted the flare onset time if necessary. The moment when the time derivative of the X-ray flux becomes positive is taken to be the new corrected onset time of the flare. This correction reduces the error in the flare timing, but the corrected onset time will be delayed relative to the true onset time because the flare onset is partially masked by another overlapping flare. At the onset time of the flare, the CME is assumed to be launched from a height of 1.25 R☉. This initial height for the CME launch was chosen because it corresponds to the upper boundary of the cavity above the prominence (Gibson et al. 2006, 2010). The CME accelerates from rest to the final speed, which is reached at the flare peak time (see e.g., Zhang & Dere 2006). Hence the CME acceleration during the flare rise phase can be calculated as a = VCME (tFlarePeak − tFlareOnset ) ,
Figure 2. CME heights at the type II onset calculated using the flare-onset method. The horizontal dotted line marks the assumed CME starting height of 1.25 R☉. The CME heights at the type II onset for GLEs (including the 2014 January 6 event as a GLE72) are shown for comparison.
Gopalswamy et al. (2012b). GLE-associated CMEs are faster on average than CMEs associated with a non-GLE SEP event (e.g., Gopalswamy et al. 2010). Therefore, the more impulsive acceleration of GLE-associated CMEs could result in a lower shock formation height because the shock speed will exceed the ambient Alfvén speed sooner. The peak of CME acceleration coincides with the HXR peak of the associated flare, but the maximum speed of the CME is reached well after the HXR peak (Berkebile-Stoiser et al. 2012). Gopalswamy et al. (2012b) estimated that the assumed initial CME height of 1.25 Rs could introduce a small error of 10% in the calculated CME heights. They estimated the error by assuming that in some events the initial CME height could be as low as 1.13 Rs (Gopalswamy et al. 2012a). If we use as the lower limit the more extreme value by Gallagher et al. (2003), who obtained a best fit to the EUV and white-light observations of the CME on 2002 April 21 with an initial CME height of 25 ± 2 Mm (∼1.04 R☉), the estimated error in the CME heights becomes ∼17%. The horizontal dashed lines in Figure 2 indicate the mean CME height averaged over cycle 23 (1.79 R☉) and cycle 24 (1.58 R☉) CMEs, respectively. The respective median values were 1.61 R☉ and 1.45 R☉. For comparison, we have also plotted the CME heights at the type II onset for GLE events (red circles). Cycle 23 GLE events were analyzed by Gopalswamy et al. (2012b). For GLE71 in cycle 24, we calculated the CME height at the type II onset using the flareonset method and for GLE72, we took the estimated value from Thakur et al. (2014). The significance of the difference between the mean CME heights in cycles 23 and 24 was estimated using Studentʼs t test. The calculated p values were 0.129 (equal variances) and 0.071 (unequal variances). The Mann–Whitney U test (Mann & Whitney 1947) for median values gave a p value equal to 0.048. The U test also assumes that the variances of the two distributions are equal. Because the p values are larger than or very close to the 95% confidence threshold of 0.05, we cannot definitely reject the null hypothesis that the mean or median values are equal. However,
(1)
where VCME is the estimated space speed of the CME and tFlarePeak and tFlareOnset are the flare peak and onset times, respectively. Previous studies have provided observational evidence for contemporaneity of the CME acceleration with the flare impulsive phase (e.g., Zhang et al. 2001). After the peak time of the flare, the CME propagates with a constant speed VCME. In most cases the type II onset occurs during the acceleration phase of the CME. The CME space speed VCME is estimated using a cone model for halo CMEs (Xie et al. 2004; see also the CDAW halo CME list, http://cdaw.gsfc.nasa.gov/ CME_list/halo/halo.html) and a geometrical projection correction for non-halo CMEs. The geometrical correction simply multiplies the measured sky plane speed by 1 sin θ , where θ is the angular distance of the CME source from the solar disk center. The site of the associated flare is used as the location of the CME source region. 4. AVERAGE CME HEIGHT AT THE ONSET OF A TYPE II BURST In Figure 2 we have plotted the estimated CME heights (column 14 in Table 1) for all 59 events as a function of type II onset time. The CME heights are estimated using the flareonset method. The mean (1.72 R☉) and median (1.60 R☉) heights for all events are marked in the upper right corner. The mean and median CME heights for non-GLE SEP events are respectively ∼12% and ∼9% higher than the mean (1.53 R☉) and median (1.47 R☉) heights for cycle 23 GLEs obtained by 5
The Astrophysical Journal, 806:13 (11pp), 2015 June 10
Mäkelä et al.
Figure 3. Schematic depiction of the 3D shock model showing the definitions of the parameters. The five parameters used in fitting are: h = height, k = selfsimilarity coefficient, e = eccentricity, the longitude and latitude of the radial axis of the shock model on the solar surface. Because we were fitting a spherical shock, the eccentricity e was set equal to zero.
Figure 4. Comparison of CME heights at the onset of the type II bursts estimated using the flare-onset method and the spherical-shock method. The dashed line shows a linear fit to the 11 blue filled circles. The four outliers that were excluded from the fit are marked by black filled circles. Type II events that are listed as having a starting frequency below 160 MHz in the NOAA solar event report are marked by red circles. The equation of the regression line and the correlation coefficients for data points including (black) and excluding (blue) outliers are plotted in the upper right corner.
the result suggests that the coronal conditions during cycles 23 and 24 are possibly different.
5. CME HEIGHT ESTIMATION BY FORWARD-FITTING A SPHERICAL SHOCK MODEL
Figure 4 shows the 15 events for which we were able to fit a spherical shock model. The deduced CME heights are listed in the column 15 of Table 1. The correlation between the flareonset and spherical-shock methods is reasonably good, with the correlation coefficient CC = 0.68. In calculating the correlation we have excluded four events, namely the 2012 July 19, 2012 August 31, 2012 September 27, and 2013 May 22 events. The four excluded outliers are marked by black filled circles in Figure 4. We will discuss these events later in the following section. The dashed line representing the linear fit between the estimated heights shows that the estimates from the flare-onset method are slightly lower than those of the spherical-shock method at the lower range of the CME heights where most of the events are clustered. The mean difference between the CME height estimates from the two methods for the 11 included events (blue circles in Figure 4) is 0.20 R☉. Considering that the flare-onset method assumes a constant initial height and acceleration for the CME, obtained results are reasonably good.
In order to estimate the validity of the flare-onset method, we estimated the CME heights for 15 cycle 24 events by fitting a spherical shock model to near-simultaneous EUV and whitelight running difference images of the CME provided by the Atmospheric Imaging Assembly (AIA; Lemen et al. 2012) on board the Solar Dynamics Observatory (SDO) and by the COR1 and COR2 coronagraphs of the Sun Earth Connection Coronal and Heliospheric Investigation (SECCHI; Howard et al. 2008) on board the Solar TErrestrial RElations Observatory (STEREO). Images closest to the onset time of the metric type II burst from as many spacecraft as possible were used for the model fitting. The number of viewpoints used in fitting depends on the location of the eruption relative to the spacecraft at the time of the type II onset. For the 3D spherical shock model fitting we used the RTCLOUDWIDGET.PRO program available in the SolarSoft IDL library (http://www. lmsal.com/solarsoft/). The spheroidal shock model is defined by three parameters (see Figure 3): the height h (the height of the spheroid from the solar center in units of solar radii), the self-similarity coefficient κ (b = (h − 1)κ), where b is the azimuthal semi-axis of the spheroid, and the eccentricity e. We assume that shock fronts are spherical, i.e., we fix the eccentricity e = 0. In addition to the three parameters of the spherical model, we need to set the latitude and longitude of the CME source region, i.e., set the intersection point of the radial axis of the spherical model on the solar surface. The parameters are adjusted manually in order to achieve the best match for the wire-grid model of the shock front plotted over each CME image by the program. Because each near-simultaneous image shows the same CME imaged from a different viewpoint, the projection effects in the 3D model fitting are significantly reduced.
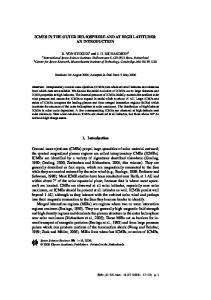
6. STARTING FREQUENCY OF THE TYPE II BURST We can further evaluate the consistency of the CME height estimates plotted in Figure 4 by using radio observations of the associated type II bursts. The starting frequencies of the type II bursts depend on the heights of the radio sources: a higher starting frequency indicates a radio source closer to the solar surface because the frequency of type II emission is proportional to the square root of the plasma density and the plasma density decreases as a function of radial distance. Several models describing the density in the corona as a function of radial distance have been suggested over the years (e.g., Saito et al. 1977; Leblanc et al. 1998). Because the density of the ambient plasma in the low corona varies from 6
The Astrophysical Journal, 806:13 (11pp), 2015 June 10
Mäkelä et al.
event to event, the radio frequency corresponding to a given coronal height varies accordingly. Generally, this density variation is accounted for by multiplying the density model by a factor that is obtained by matching the frequency calculated using the density model with the measured type II frequency at the time when we also have the measurement of the CME height available, usually based on a coronagraph image. In our study we cannot rely on CME height measurements because we are interested in the validity of our CME height estimates. However, we still are able to make some conclusions based on the starting frequencies of the type II bursts. In the NOAA reports, the measurement range of the most observatories reporting type II burst detections is limited to frequencies in the range 25–180 MHz. The reported maximum frequency most likely corresponds to harmonic emission. Only two or three of the type II bursts plotted in Figure 4 did not have a clear fundamental harmonic structure at metric wavelengths. Therefore, we divided the 15 data points plotted in Figure 4 into two sets: those with a reported starting frequency between 160 and 180 MHz and those with a starting frequency (fs) below 160 MHz. For the six bursts with fs < 160 MHz the reported maximum frequencies were 120, 82, 100, 131, 60, and 41 MHz. Assuming that harmonic emission was observed, fs = 120 MHz corresponds to a height of ∼1.25 R☉ according to the Saito density model (Saito et al. 1977). The height range of 2.0–2.5 R☉ corresponds to harmonic emission at frequencies 16–30 MHz. These numbers are only assumed because we do not know the exact density levels of the corona at the time of each type II burst. If the actual coronal densities are two times the Saito model values then the corresponding radio frequency at a specific distance will be ∼1.41 higher. In Figure 4 the events with a starting frequency below 160 MHz are marked by red circular rings. For all events except one that have the CME height measured using the sphericalshock method around or above 2 R☉, the type II starting frequency is below 160 MHz confirming that the radio source must have been at larger distances; all excluded outliers (marked by black circles in Figure 4) are among these events. This corroborates the results from the spherical-shock method. Correspondingly it also indicates that for some reason the flareonset method must have underestimated the CME heights in the four excluded events. There is one event, the 2011 June 7 event, which has an unexpectedly low starting frequency compared to the estimated height of the associated CME, ∼1.5 R☉. Next we look the details of the 2011 June 7 event.
Figure 5. Dynamic spectrum of the onset of the 2011 June 7 radio burst observed by the Learmonth Solar Radio Spectrograph.
flare-onset method and the spherical-shock method estimated the CME height to be ∼1.5 R☉. These estimates are in accordance with the estimated CME height by Cheng et al. (2012, their Figure 2). In Figure 5 we have plotted the onset of the radio burst reported by the Learmonth Solar Radio Spectrograph. The type II burst was reported to have occurred between 06:25 and 06:50 UT in the frequency range of 25–120 MHz, but we have plotted a shorter time period for studying the onset of the type II emission. A strong burst of radio emission is clearly observed below 120 MHz, but this radio burst has a fractured structure with several narrow-band short-duration features showing varying drift slopes. These short-duration bursts could be due to flare-accelerated electrons propagating in the complex loop structures of the low corona. The highest-frequency feature around 120 MHz even appears to exhibit a reverse drift indicating an electron beam propagating toward the Sun. There is a short-duration downward drifting feature starting around 42 MHz that resembles a type II burst. However, this feature has a relatively high drift rate (∼0.21 MHz s−1), corresponding to a shock speed of ∼1800 km s−1. This shock speed seems to be too fast because the CME was still accelerating around 06:26 UT (see Cheng et al. 2012). In addition, the space speed of the CME was estimated to be 1321 km s−1 (CDAW HCME list), well below 1800 km s−1. However, the CME probably was fast enough to drive a shock. The Wind/WAVES (Bougeret et al. 1995) observed a decameter-to-kilometer range type II starting at ∼06:45 UT. Type II emission faded around ∼07:25 UT at ∼4 MHz and reappeared sporadically after ∼07:43 UT below 1 MHz. Based on the above considerations, we conclude that the decameter type II burst observed by Wind/WAVES could have been the extension of the metric type II burst but the exact onset time of the metric type II burst is uncertain. Dorovskyy et al. (2012) estimated that the type II onset time was 06:36 UT based on measurement by the UTR-2 and URAN-2 radio telescopes. This start time coincides with the estimated time of the CME maximum speed (Cheng et al. 2012). A further complication is that there are indications that the type II source was at first in the flank region
6.1. The 2011 June 7 Event The only exception among the events with a type II starting frequency below 160 MHz is the 2011 June 7 event. Various aspects of this filament eruption have been extensively analyzed (see, e.g., Cheng et al. 2012; Dorovskyy et al. 2012; Innes et al. 2012; Li et al. 2012; Williams et al. 2012; Gilbert et al. 2013; Inglis & Gilbert 2013; van Driel-Gesztelyi et al. 2014). The metric type II burst was associated with a halo CME (HCME) at 06:49 UT that had an estimated space speed of 1321 km s−1. The reported type II starting frequency for this event is 120 MHz, clearly suggesting that the CME height at the onset of the type II bursts should be similar to those of the four excluded events. The associated M2.5 flare at S21W54 started at 06:16 UT. However, both the 7
The Astrophysical Journal, 806:13 (11pp), 2015 June 10
Mäkelä et al.
and later shifted into the nose region of the shock (A. Bemporad, presentation at SCOSTEPʼs 13th Quadrennial Solar-Terrestrial Physics Symposium in Xi’An, China).
STEREO-B/WAVES instruments detected an intermittent single-tone DH type II burst starting at 23:55 UT at a frequency of 16 MHz. Also in this event the preceding type III burst intensified at 6 MHz and below, although type III emission is also visible at higher frequencies. The intensification of the type III burst near 7 MHz is not as clear in this event as it was in the previous two events and also the duration of the type III burst above frequencies of 6 MHz is longer than in the previous two events. The 2013 May 22 event was associated with a M5.0 flare eruption at 12:58 UT at N15W70. The onset of this flare was overlapped by two preceding flares. The eruption was associated with an HCME observed 13:25 UT with an estimated space speed of 1702 km s−1. Cheng et al. (2014) also studied the height of this flux rope eruption. They measured the shock height to be 2.7 R☉ at 13:05 UT, which is consistent with our estimated height of 2.22 R☉ at the onset of the metric type II burst at 12:59 UT. Based on a 3D flux rope fitting they estimated the maximum speed of the shock front to be around 1900 km s−1, slightly higher than our estimated space speed. Their measurements also indicate that the CME reached the maximum speed about 5–10 minutes after the peak time of the X-ray flare, but the cadence of flux rope observations is 5–6 minutes. The type II burst started at 12:59 UT and again the type III burst visible in the Wind/WAVES dynamic spectrum shows a clear intensification below 6 MHz. As was the case in the 2012 September 27 event, the type III event is visible above 6 MHz and the duration is longer than in the 2012 July 19 and August 31 events. Both the 2012 July 19 and 2013 May 22 events had a flare onset obscured by a preceding flare, which explains why the flare-onset method underestimated the CME height. For the other two events on 2012 August 31 and September 27, the flare eruptions were isolated and the underestimation could not be due to erroneous onset time. We also looked at the time difference between the flare onset time and the type II onset time. The time differences for the four outliers are: 2012 July 19 (18 minutes), 2012 August 31 (10 minutes), 2012 September 27 (8 minutes), and 2013 May 22 (1 minute). The mean (median) for the 59 events is 11 minutes (10 minutes). The range of the time differences is 1–39 minutes. Therefore, only the 2013 May 22 event corresponds to the extreme of the time range. In this case, the onset time of the flare could be too late, even though we have shifted it to 10 minutes earlier to 12:58 UT. The onset of the M5.0 flare is masked by two preceding flares. If we use the onset time of the first flare 12:30 UT, then the CME height at the type II onset is 2.44 R☉. The 2012 July 19 event is marginally extreme. There are 11 events with a time difference larger than 18 minutes. Therefore, we conclude that the flare and type II onset times do not provide a good explanation for the underestimation of the CME height in the 2012 August 31 and September 27 events. The other possibility is that the estimated space speeds of the CMEs, 1479 and 1376 km s−1 respectively, were too low. Because the acceleration of the CME was assumed to be constant, doubling the final CME velocity doubles the distance the CME travels in a fixed time period. However, in order to match the CME heights of the flare-onset method with those of the spherical-shock method we would need to multiply the space speed by factors of 10.4 and 4.4 respectively. These correction factors obviously result in unrealistically high CME space speeds. Therefore, we conclude that the CME
7. THE FOUR EVENTS WITH CME HEIGHT DISCREPANCIES BETWEEN THE FLARE-ONSET AND SPHERICAL-SHOCK METHODS The four events for which the flare-onset method gave significantly lower CME heights compared to the sphericalshock method were the 2012 July 19, 2012 August 31, 2012 September 27, and 2013 May 22 events. Next we describe briefly the details of these events and then summarize possible reasons for the CME height discrepancies. The onset of the 2012 July 19 type II event was reported by the Culgoora Solar Observatory radiospectrograph to be 05:24 UT at 100 MHz, but after inspecting the Culgoora dynamic spectra, we shifted the onset 1 minute later to 05:25 UT. The Culgoora dynamic spectrum reveals relatively faint and shortduration (