information on a system and its components, e.g., energy quality, energy
hierarchies, efficiency and even economic ... However, it is nearly impossible to
track back all the energetic conversion ..... 007 Crude petroleum and natural gas
075.
65 Estimating Transformity (UEV) with Economic Input-Output Models Lixiao Zhang, Zhifeng Yang, Guoqian Chen, Gengyuan Liu
ABSTRACT Accurate and sufficient information on unit emergy values (UEVs) is very fundamental for emergy calculations and is also essential for the broad acceptance, application and further development of the emergy method. As an extension of matrix methods, an input-output model based framework was built in this paper, for estimating transformity (UEV) of products and services of a certain economy. Then UEVs of the Chinese economy in 2007 were calculated and analyzed with a 135-sector inventory, which can be transformed into transformities with the aid of corresponding prices. The results show that estimating transformity (UEV) with economic input-output models can achieve results relatively consistent with values reported in the literature. The input-output model based approach proposed in this study could produce reliable results and provide a sound and dynamic source of UEVs for emergy accounting that also contains necessary information on renewable and nonrenewable emergies and can be easily updated.
INTRODUCTION Out of a creative combination of energetics and systems ecology, the emergy method was first presented by H.T. Odum in 1983, in order to fully integrate the values of energy, materials, and information in a common unit, which provides a way to understanding the behavior of self-organized systems, valuing ecological goods and services, and jointly analyzing ecological and economic systems (Odum and Odum, 1983; Hau and Bakshi, 2004). Emergy, especially solar emergy is ‘‘the available solar energy used up directly and indirectly to make a service or product’’ (Odum, 1996). It assumes the earth to be driven by three primary energy sources: the solar energy, deep earth heat and tidal energy. And it purports that all living systems sustain one another by participating in a network of energy flow by converting low quality energy into both higher quality energy and degraded heat energy. Among the theories and methodologies of emergy, the concept of transformity is possibly the most important concept (Li et al., 2010). H.T. Odum argues that the “energy flows of the universe are organized in an energy transformation hierarchy” and that “the position in the energy hierarchy is measured with transformity” (Odum, 1996; Hau and Bakshi, 2004). Therefore, the ratio of the emergy required to make a product to the available energy of the product is defined as the solar transformity of the product. The units of the solar transformity are solar emjoules J-1, abbreviated as sej J-1; other unit emergy values (UEVs) are the specific emergy, solar emjoules kg-1 (sej kg -1) and the emergy to money ratio, solar emjoules $-1(seJ $-1). The emergy to money ratio is used in the emergy calculation procedures to convert, into emergy units, the money inputs associated with labor and services. It is very important to reemphasize that transformity is expressed in sej J-1 while others are unit emergy values, not transformities, which can be named as UEV, Unit Emergy Value. Transformity provides 575
information on a system and its components, e.g., energy quality, energy hierarchies, efficiency and even economic usefulness (Odum, 1996). In practice, transformity is used to determine the emergy of commonly used resources and commodities by multiplying units of energy (or other units) by its appropriate transformity (or other UEV). To derive solar emergy of a resource or commodity, it is very necessary to trace back through all resource and energy that are used to produce it and express each in the amount of solar energy that went into their production chain. However, it is nearly impossible to track back all the energetic conversion routes connecting solar energy to the inputs of concern with regard to a specific system boundary, which is a huge network and spatially and temporally related. In fact, most case studies in the literature rely on the transformities calculated by Odum and co-workers to calculate the emergy of their inputs. It should be noted that the available transformities have been calculated from processes that are spatially and temporally separated, e.g., different transformities for the same product in particular, which certainly has its limitations and adds some uncertainty (Brown and McClanahan, 1996). H.T. Odum does recognize that there is no single transformity for any class of products or processes and that when viewed in greater detail, each production pathway for a given product (rain, wind, waves, oil, etc.) represents a unique transformation process that will result in a different transformity (Hau and Bakshi, 2004) . In fact, it is quite well known that there is no single transformity for most commodities, but a range of transformities. Nevertheless, there are still a lot of goods and services without transformities, although the transformities for some renewable energies, minerals and commercial goods are available in the literature. Therefore, the prices ($) of related products and emergy/money (sej/$) ratio of the region/country are usually multiplied to get a rough estimation of the emergy of some commodities (sej) in such cases. What’s more, estimating transformities on the basis of emergy/money ratios alone only captures the part thereof that is due to labour and services. While this may be a good first approximation for some highly processed products, it clearly defeats the original purpose of Emergy Synthesis, namely to comprehensively account for all inputs with a unified measurement. The very generalized representation of the relationship between the production system and economic system assumed with the emergy/money ratio value could definitely increase the possibility of inaccuracy and double counting. As a result, accurate information on the transformities is fundamental for calculating emergy and is also essential for the broad acceptance, application and further development of emergy method (Li et al., 2010). However, the available transformities cannot be easily updated for new production technologies or with regard to temporal and spatial diversity, due to the complexity of transformity calculations. The partial renewability of resources was first considered by Ulgiati et al. (1994), and then further explored by Ortega et al. (2005), Lu et al. (2006, 2009) and Zhang et al. (2011), which is considered an evolution in emergy methodology, as a significant step forward to a better assessment of system sustainability based on its renewable emergy basis (Cavalett et al., 2006). In other words, the flows of materials and services that enter the system are multiplied by their corresponding renewability factors, in order to divide them into their renewable and non-renewable fractions that are used for a more accurate calculation of the performance indicators that depend on the renewability of supporting flows. However, published transformities often provide no information on resource structure, i.e., the renewable and nonrenewable proportion of the transformity. Thus, the renewability factors are often unavailable for products. Since components of the system are usually coupled, double counting errors are unavoidable, because of the necessary decoupling of network energy flows for linear computation. The issues of splits, co-products and feedbacks are quite confusing and challenging, since the decisions of whether multiple outputs are co-products or splits may not always be obvious either. Therefore, accurate and reproducible determinations of transformities have been pursued by many scientists performing emergy evaluations (Odum, 2000; Odum et al., 2000; Brown and Bardi, 2001; Brandt-Williams, 2002; Zhang et al., 2007). In addition to the 10 methods proposed by Odum (1996) for determining an unknown transformity, matrix methods have been explored for determining the transformities of 576
energy flows in an ecosystem network by several authors including Collins and Odum (2000), Bardi et al. (2005) and Li et al.(2010). In fact, the dynamics and transformation of energy flows in economic systems is a complex network of interactions, which is inversely coupled with monetary flow. This paper provides an extension of the matrix method to calculate transformity (UEV), i.e., estimate the transformity (UEV) of the products and services of industrial sectors, using an economic input-output table for the economy in mainland China in 2007 divided into 135 industrial sectors. The algorithms for this new method are elaborated, which could provide a framework for determining transformities (UEVs) of economic products with regard to different space - time ranges. What’s more, such values associated with a certain economy are more accurate and can be updated easily. Given the transformities of renewable and non-renewable flows in nature, it is easier to perform an emergy valuation with respect to the renewability factor.
METHOD Ecological Input-Out Table The economic input-output table was developed by Wassily Leontief by considering monetary transactions among economic sectors. Table 1 illustrates the basic structure of an economic inputoutput table in China. Recently this I-O based technology has been widely adopted to track both direct and indirect effects as embodiments in an economic system, e.g., to calculate embodied consumption of energy resources and water resources and greenhouse gas(GHG) emission in national economy accounts (Costanza, 1980; Lenzen, 1998; Ukidwe and Bakshi, 2007;Zhou, 2008;Chen et al, 2010;Chen and Chen, 2010), international trade (Shui, 2006; Zhao, 2009) and specific industrial sectors or regional economies (Ukidwe and Bakshi, 2008). Nomenclature used in the I-O model:
zjL,i
z
I j ,i
d
L i
inputs to Sector i from Sector j in monetary terms inputs to Sector i that are imported with a category, i.e., virtually from Sector j in monetary terms , local products from Sector i to satisfy domestic use
ei , local products from Sector i to satisfy foreign use w i non-industrial products contributed to Sector i EjL,i
E
I j ,i
Ti
L
emergy input to Sector i from Sector j emergy input to Sector i that is imported with a category , i.e., virtually from Sector j emergy flow from Sector i to satisfy domestic use
Gi emergy flow from Sector i to satisfy foreign use Si service emergy flow contributed to Sector i
jL
UEV of the emergy flow for local products from Sectors j,
jI
UEV of exported products as assigned virtually from Sector j REi renewable emergy input for Sector i
NREi non-renewable emergy input for Sector i 577
re
renewable part of UEV
ne
nonrenewable part of UEV
ci average price of the sector product i
i
transformity of product from Sector i
The economic input–output table in use matrix for the Chinese economy 2007 to be adopted in this study is compiled by the Department of National Accounts, National Bureau of Statistics of China and initially released in September, 2009. In the table, the Chinese economy is divided into 135 industrial sectors, including 5 sectors for agriculture; 5 for mining; 81 for manufacture; 3 for electricity, gas, and water production and supply; 9 for transportation, storage, and mail; 2 for construction and real estate; and 30 for other services, as listed in the Appendix. The economic flows are expressed in producers’ prices in 2007 with a unit of ten thousand Chinese Yuan’s (CNY hereafter).
Emergy Diagram and Algorithm Shown in Figure 1 is an aggregated diagram of ecological-economic system with the Chinese economy as the system boundary. The economy is represented as a subsystem of the larger system via an inputoutput model, which represents the flows of money between a variety of economic sectors.
Table 1. Basic structure of an economic input-output table in China. Industrial use
z1L, n
d1L
e1
Sector 2
z2L,1
z2L, 2
z2L, n
d 2L
e2
Sector n
znL,1
znL, 2
znL, n
d nL
en
Sector 1
I 1,1
z
I 1, 2
z
I 1, n
z
d1I
Sector 2
z2I ,1
z2I , 2
z2I , n
d 2I
znI ,1
znI , 2
znI , n
d nI
w1
w2
wn
Export
z1L, 2
Gross capital formation
z1L,1
Consumptive
Sector n
Sector 2
Sector 1
…
Sector 1
Intermediate inputs
Final use Domestic use Foreign
…
Imported industrial inputs
… Sector n
Net economic Inputs (Value added)
Wages, taxes, surplus, etc.
578
Figure 1. Aggregated emergy diagram of Chinese economy in terms of the industrial sectors.
Figure 2. Input-output emergy flows of a typical industrial sector (according to Chen and Chen, 2010). 579
The information of the input-output model is used in allocating emergy flow between industry sectors (Ukidwe and Bakshi, 2007). Exogenous emergy flows include renewable energies, mineral mining products and goods and services imported from foreign countries. The external environmental inputs are the only inputs as primary resources to the economy and all imported inputs are economic products divided into domestic intermediate use categories. As in conventional input–output studies, it is assumed: (a) The unit emergy values are assumed to be equal for all commodities from the same industrial sector. (b) Storages have the same UEV as the commodities produced in the current year. (c) Imported commodities have the same UEV as domestic ones. L
z Lj ,i , z Ij ,i , diL , ei , and w i
Shown in Fig.2(a) are the monetary flows with denotations of zi , j ,
referred to in the economic input–output table as a sub-domain in Table 1 to stand for the industrial or non-industrial deliveries measured in monetary units, and in Fig. 2(b) are corresponding physical flows with denotations of
EiL, j , E Lj , i , E Ij ,i , Ti L , Gi , and Si , and the emergy inputs denoted by REi
(Renewable emergy) and NEi (non-renewable emergy) without monetary counterpart as it is free of charge. The emergy flows embodied in industrial product deliveries can be expressed as UEV multiplying monetary values, as illustrated in Fig. 2(c), with
jL
and
jI
representing the UEV of the
emergy flow for local products from Sectors i and j, and represents the UEV of imported products as assigned virtually from Sector j, and the non-industrial inputs are not accounted for as in many other studies (see Costanza (1980) for detailed discussions). Besides, the global emergy baseline used in this study is 15.83E+24 sej/yr. Based on Fig.2 (c), an emergy balance can be induced as follows:
REi NEi j 1 Lj z Lj ,i j 1 Ij z Ij ,i iL n
n
n
z ei d iL
L j 1 i , j
(1)
According to the third assumption, it is assumed that when divided into the same sector, imported products have the same embodied intensities as domestic ones, i.e.,
Lj Ij
(2)
Then equation (1) can be rewritten as follow:
REi NEi j 1 Lj ( z Lj ,i z Ij ,i ) iL n
n
z ei diL
L j 1 i , j
(3)
For the national economy complemented with concerned emergy flows as an economic– ecological integration, an aggregate matrix equation can be induced as:
RE NE X Y
(4)
With properly given emergy matrix RE and NE, economic input–output matrix X, and total domestic output matrix Y, the concerned UEVs matrix is obtained as:
( RE NE )Y X 1
(5)
And correspondingly, the renewable part of transformity ( r e ) and nonrenewable part of transformity ( ne ) can be calculated as follows:
r e RE Y X
1
(6) 580
ne NE Y X
1
(7)
If we assume the ci is the average price of the sector product i, then we can have the value of transformity or specific emergy value of this product i i ci (8)
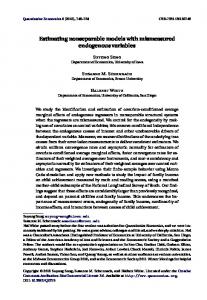
RESULTS Shown in Figure 3 are the UEVs for the sector products and services associated with the 135 divisions of Chinese economy in 2007, which closely coincide with the results of the embodied energy analysis of Chinese economy 2007 by Chen and Chen (2010), though with certain differences due to different system boundaries. In monetary terms, coal has the highest UEV of 6.19E+16 sej/1E4 CNY. If the average price of coal in China in 2007 was considered, i.e., 310 CNY/t, the transformity of coal produced in China in 2007 can be calculated as 6.54E+04 sej/J. On the whole, relatively higher values of the UEVs can be found in the mineral sectors, e.g., from sector 1 to sector 8, basic industrial production as manufacturing of petroleum and nuclear fuel, coke, basic chemical products and fertilizers (from sector 37 to sector 40 respectively), steel industries as iron-smelting, steelmaking, and steel casting and forging, and energy production as electric power and heat power and fuel gas in sectors 92 and 93. In contrast, relatively lower UEVs are found for service sectors as sector 91(scrap and waste), sector 111 (banking, security and other financial activities) and sector 113 (real estate) with a UEV one or two orders of magnitude lower than those of the others. In general, the sectors following sector 104 have a relatively lower UEV in monetary terms, since they are all service sectors. Nevertheless, these values are very essential for more accurate accounting for those systems involving these services, since they are more pertinent to the general national emergy/money ratios. 7E+16
Unit Emergy Value(sej/1E14 yuan)
RE
NE
6E+16
5E+16
4E+16
3E+16
2E+16
1E+16
0 1 4 7 10 13 16 19 22 25 28 31 34 37 40 43 46 49 52 55 58 61 64 67 70 73 76 79 82 85 88 91 94 97 100 103 106 109 112 115 118 121 124 127 130 133
Sector Figure 3. Unit emergy values for sectoral products. 581
Figure 3 also showed the source structures of Unit emergy values for sectoral products, with regard to renewable emergy and non-renewable emergy. This structure of aggregated input provides us with sufficient information on the renewable and non-renewable proportion of specific products with regard to its UEV, which is very essential for further accurate environmental accounting of a given transformation system.
DISCUSSION Three issues associated with the framework for estimating transformity and other UEVs are put forward in this paper and should be further clarified. First, it is meaningful to compare the tranformities estimated in this study to those available in literature to check the consistency of the results with existing values. However, it is not an easy task to get accurate values for all the information on price, mass or energy content for sectoral products. Therefore, we selected some typical UEVs of agricultural products and mineral products computed in this study and compared them with those from the literature. As shown in Table 2, the transformities or specific emergies calculated from the input-output model are comparable to those from the literature, at least with the same magnitude, which provides a 1st order validation for this model. Secondly, in the conventional calculation of transformity from network production systems, double counting errors usually occur because of errors in estimating the emergies of feedbacks, splits and co-products. In this input-output model for estimating transformity (UEV), the issue of co-products is nonexistent because emergy is allocated to sectors based on their total economic value. As to splits and feedback, they do exist if we regard the sector domestic output as the final products. However, if we only focus on the final use of a certain sector, the splits or feedbacks are only regarded as the inputs of related sectors. As the second assumption explains, the feedback or split can also be regarded as the storages necessary for the production of certain sectors, see Figure 4. Thirdly, we recognize that the IO analysis has unavoidable limitations. The latent limitations of the IO table used in this analysis are price distortion at the process of unit conversion, aggregation error in composing a sector, and missing necessary product or service in the candidate sector (Chung, et al., 2009). In addition, it is also impossible to consider every product and service of the national economy although 135 sectors have been covered, since the input-output table could not possibly cover all the economic divisions without aggregations. Despite the limitations in the conventional IO approach, an ecological input-output model proposed in this study can be successfully used in estimating transformity (UEV) to produce reliable results, which could provide a sound and dynamic database for emergy accounting.
Table 2. Comparison between transformities calculated in this study with those from literature. Items Grain Wood Livestock Fishery Coal Oil Iron ore
sej/g
UEV (sej/1E4 yuan)
This study
4.63E+15 1.12E+16 9.60E+15 2.08E+15 6.19E+16 1.74E+16 3.74E+16
7.03E+08 5.03E+08 1.54E+10 1.67E+09 1.92E+09 4.07E+09 2.24E+09
sej/J
UEV from literature
This study 4.85E+05 4.19E+04 2.94E+06 3.55E+05 6.54E+04 9.73E+04
1.68E+09
582
UEV from literature 3.36E+05 3.09E+04 3.36E+06 5.23E+05 6.69E+04 8.90E+04
References Jiang et al, 2008 Brown et al. 1992 Jiang et al, 2008 Zhang et al., 2011 Jiang et al, 2008 Jiang et al, 2008 Odum, 1996
n
E j i j ,
1
n
E i j ,
j 1
RE i
NEi
Figure 4. Split and feedback issues in input-output model.
CONCULISIONS As an extension of matrix methods, an economic input-output model based framework was established for estimating transformity and other unit emergy values. The UEV of products and services of the Chinese economy in 2007 were systematically presented with a 135-sector inventory to provide a basic database for future emergy accounting works. The results show that relatively higher values of the emergy per yuan can be found in the mineral sectors, e.g., from sector 1 to sector 8, basic industrial production such as manufacturing of petroleum and nuclear fuel, coke, basic chemical products and fertilizers (from sector 37 to sector 40 respectively), steel industries as iron-smelting, steelmaking, and steel casting and forging, and energy production as electric power and heat power and fuel gas in sector 92 and 93. In addition, this accounting framework could provide us with sufficient information on the renewable and non-renewable proportion of specific products with regard to their UEVs, which is very essential for further accurate environmental accounting of a given transformation system. What is more important is that the transformities or specific emergies calculated from the input-output model are similar to those from literature, at least they are of the same order of magnitude, which provides a certain validation for this model. Nevertheless, the method proposed in this study suffers from several limitations derived from the limitations of input-output analysis.
REFERENCES Bardi, E., Cohen, M.J., Brown, M.T., 2005. A linear optimization method for computing transformities from ecosystem energy webs. In: Brown, M.T., Bardi, E., Campbell, D.E., Comar, V., Huang, S.L., Rydberg, T., Tilley, D., Ulgiati, S. (Eds.), Emergy Synthesis 3: Theory and Application of the Emergy Methodology. University of Florida, Center for Environmental Policy, Gainesville, Florida, USA, pp. 63–74. Brown, M.T., Bardi, E., 2001. Folio 3: emergy of ecosystems. In: Handbook of Emergy Evaluation. Center for Environmental Policy, Environmental Engineering Science, University of Florida, Gainesville, Florida, USA. Brown, M.T., Green, P., Gonzalez, A., Venegas, J., 1992. EMERGY Analysis Perspectives, Public Policy Option, and Development Guidelines for The Coastal Zone of Nayarit, Maxico. EMERGY Analysis and Public Policy Options. Center for Wetlands and Water Resources, University of Florida, Gainesville FL
583
Brown, M.T., McClanahan, T.R.,1996. Emergy analysis perspectives of Thailand and Mekong River dam proposals. Ecological Modelling, 91: 105-130 Brandt-Williams, S.L., 2002. Folio 4: emergy of Florida agriculture (2nd printing). In: Handbook of Emergy Evaluation. Center for Environmental Policy, Environmental Engineering Science, University of Florida, Gainesville, Florida, USA. Cavalett, O., Queiroz, J.F., Ortega, E., 2006. Emergy assessment of integrated production systems of grains, pig and fish in small farms in the South Brazil. Ecological Modelling, 193: 205-224. Chen, G.Q., Chen, Z.M. Carbon emissions and resources use by Chinese economy 2007: A 135-sector inventory and input-output embodiment. Commun Nonlinear Sci Numer Simulat, 15: 3647-3732 Chen, Z.M., Chen, G.Q., Zhou, J.B., Jiang, M.M., Chen, B., 2010.Ecological input-output modeling for embodied resources and emissions in Chinese economy 2005. Commun Nonlinear Sci Numer Simulat, 15: 1942-1965 Chung, W. S., Tohno, S., Shim, S.Y. 2009. An estimation of energy and GHG emission intensity caused by energy consumption in Korea: An energy IO approach. Applied Energy, 86: 1902–1914 Collins, D., Odum, H.T., 2000. Calculating transformities with an eigenvector method. In: Brown, M.T., Brandt-Williams, S., Tilley, D., Ulgiati, S. (Eds.), Emergy Synthesis 1: Theory and Applications of the Emergy Methodology. Center for Environmental Policy, University of Florida, Gainesville, Florida, USA, pp. 265–280. Costanza, R.1980. Embodied energy and economic valuation. Science 210, 1219–24. Hau, J.L., Bakshi, B.R., 2004. Promise and problems of emergy analysis. Ecological Modelling, 178:215-225. Jiang, M.M., Zhou, J.B., Chen, B., Chen, G.Q. 2008. Emergy-based ecological account for the Chinese economy in 2004. Communications in Nonlinear Science and Numerical Simulation, 13(10): 2337-2356. Lenzen M. 1998.Primary energy and greenhouse gases embodied in Australian final consumption: an input–output analysis. Energy Policy, 26: 495–506. Li, L.J., Lu, H.F., Campbell, D.E., Ren, H.2010. Emergy algebra: Improving matrix methods for calculating transformities. Ecological Modelling, 221: 411–422 Lu, H.F., Campbell, D.E., Li, Z.A., Ren, H., 2006. Emergy synthesis of an agro-forest restoration system in lower subtropical China. Ecological Engineering, 27: 175-192. Lu, H.F., Kang, W., Campbell, D.E., Ren, H., Tan, Y., Feng, R., Luo, J. and Chen, F., 2009. Emergy and economic evaluations of four fruit production systems on reclaimed wetlands surrounding the Pearl River Estuary, China. Ecological Engineering, 35: 1743-1757. Odum, H.T., Odum, E.C. 1983. Energy Analysis Overview of Nations. Working Paper, WP-83-82, International Institute for applied systems Analysis, A-2361, Laxenburg, Austria. Odum, H.T., 1996. Environmental Accounting: Emergy and Decision Making. Wiley, New York. Odum, H.T., 2000. Folio 2: emergy of global processes. In: Handbook of Emergy Evaluation. Center for Environmental Policy, Environmental Engineering Science, University of Florida, Gainesville, Florida, USA Odum, H.T., Brown, M.T., Brandt-Williams, S.L., 2000. Folio 1: introduction and global budget. In: Handbook of Emergy Evaluation. Center for Environmental Policy, Environmental Engineering Science, University of Florida, Gainesville, Florida, USA. Ortega, E., Cavalett, O., Bonifacio, R.,Watanabe, M., 2005. Brazilian soybean production: emergy analysis with an expanded scope. Bull. Sci. Technol. Soc., 25 (4): 323–334. Shui, B., Harriss, R.C., 2006. The role of CO2 embodiment in US–China trade. Energy Policy, 34: 4063–4068. Ukidwe, N.U., Bakshi, B.R.,2007.Industrial and ecological cumulative exergy consumption of the United States via the 1997 input–output benchmark model. Energy, 32: 1560–92. Ukidwe, N.U., Bakshi, B.R.2008. Resource intensities of chemical industry sectors in the United States via input–output network models. Comput Chem Eng, 32: 2050–2064.
584
Ulgiati, S., Odum, H.T., Bastianoni, S., 1994. Emergy use, environmental loading and sustainability: an emergy analysis of Italy. Ecological Modelling,73: 215-268. Zhang, L.X., Ulgiati, S., Yang, Z.F., Chen B., 2011. Emergy evaluation and economic analysis of three wetland fish farming systems in Nansi Lake area, China, Journal of Environmental Management, 92: 683-694 Zhang, L.X., Yang, Z.F., Chen, G.Q., 2007. Emergy analysis of cropping-grazing system in Inner Mongolia Autonomous Region, China. Energy Policy 35, 3843-3855. Zhou, J.B.,2008.Embodied ecological elements accounting of national economy. PhD dissertation. Peking University, Beijing; [in Chinese]. Zhao, X. 2009.Water footprint accounting in an input–output framework—modeling and application at different spatial scales. PhD dissertation, Beijing Normal University, Beijing;[in Chinese].
APPENDIX Sector Sector content code 001 Crop cultivation 002 003 004 005 006 007 008 009 010 011 012 013 014 015 016 017 018 019 020 021 022 023 024 025 026 027 028
Sector Sector content code 069 Machinery special mining, metallurgy and construction Forestry 070 Machinery special for chemical industry, processing of timber and nonmetals Livestock 071 Machinery special for agriculture, forestry, animal husbandry and fishery Fisheries 072 Machinery special for other purpose Agricultural services 073 Railway transport equipment Coal mining 074 Automobiles Crude petroleum and natural gas 075 Boats and ships and floating devices ferrous metal ores 076 Other transport equipment Non-ferrous metal ores 077 Generators Non-metallic ores 078 Equipment for power transmission and distribution and control Grain products 079 Wire, cable and optical cables Forage products 080 Household electric and non-electric appliance Vegetable oil 081 Other electric machinery and equipment Sugar 082 Communication equipment Meat products 083 Radar and broadcasting equipment Aquatic products 084 Computer Other food products 085 Electronic component Convenience food 086 Household audiovisual apparatus Liquid milk and dairy products 087 Other electric equipment Flavoring and ferment products 088 Measuring instruments Other foods 089 Machinery for cultural activities & office work Alcohol and wine 090 Artworks Soft drinks and purified tea 091 Scrap and waste Tobacco 092 Electric power and heat power Spinning and weaving products 093 Fuel gas of cotton and chemical fibers Spinning and weaving products 094 Tap water of wool Spinning and weaving products 095 Construction of hemp and tiffany Textile products 096 Railway transport 585
Sector Sector content code 029 Knitted fabric and its products 030 Textile wearing apparel, footwear and caps 031 Leather, fur skins and miscellaneous leather products 032 Timber and wooden products 033 Furniture and fixtures 034 Paper products 035 Publishing, printing 036 Stationery and sporting goods 037 Petroleum and nuclear fuel 038 Coke 039 Basic chemical products 040 Fertilizers 041 Pesticides 042 Paints, printing inks, pigments and similar products 043 Synthetic materials 044 Special chemical products 045 Chemical products for daily use 046 Medicines 047 Chemical fiber 048 Rubber 049 Plastic 050 Cement,lime and plaster 051 cement products 052 Brick, stone and other building materials 053 Glass and glass products 054 Pottery and porcelain 055 Fire-resistant materials 056 Graphite and other nonmetallic mineral products 057 Iron-smelting products 058 Steelmaking products 059 Cast and forged steel products 060 Ferroalloy smelting products 061 Non-ferrous metals 062 Non-ferrous metal rolling 063 Other metal products 064 Boiler and prime mover 065 Metalworking machinery 066 Lifters 067 Pump, valve and similar 068 Other general purpose
Sector Sector content code 097 Road transport 098 Urban public traffic 099
Water transport
100 101 102 103 104 105 106 107 108 109 110
Air transport Pipeline transport Material handling services Storage services Mail services Telecom services Computer services Software products Wholesale and retail trades Hotels Catering services
111 112 113 114 115 116 117 118 119 120
Bank, security and other financial activities Insurance Real estate Leasing Commerce Tourism Research and experimental development Professional technical services Services of science and technology exchanges and Geological prospecting
121 122 123 124
Water conservancy services Environmental management services Public facilities management services Services to household
125 126 127 128 129 130 131 132 133 134 135
Other services Education Medical service and health Social security Social welfare Press and publication sector Broadcasting, movies, televisions and audiovisual Cultural and art activities Sports activities Entertainment Public administration
586