Progress In Electromagnetics Research, PIER 99, 53–70, 2009
ESTIMATION OF CORE TEMPERATURE ELEVATION IN HUMANS AND ANIMALS FOR WHOLE-BODY AVERAGED SAR A. Hirata, H. Sugiyama, and O. Fujiwara Nagoya Institute of Technology Gokiso-cho, Showa-ku, Nagoya 466-8555, Japan Abstract—Biological effects due to whole-body radio-frequency exposure may be induced by core temperature elevation. According to the international safety guidelines/standards for human protection, the whole-body averaged specific absorption rate (WBA-SAR) is used as a metric. In order to understand the relationship between WBA-SAR and core temperature elevation, a theoretical solution or a closed formula for estimating core temperature elevation is essential. In the present study, we derived a formula for simply estimating core temperature elevation in humans and animals due to whole-body radio-frequency exposure. The core temperature elevation estimated with the formula is found to be in reasonable agreement with the computational results of finite-difference timedomain computation incorporated in anatomically-based models Based on the formula, the WBA-SAR is found to be a good metric for estimating core temperature elevation. The main factors influencing the core temperature elevation are the perspiration rate and the body surface area-to-weight ratio.
1. INTRODUCTION There has been increasing public concern about the adverse health effects of human exposure to electromagnetic waves. In radiofrequency (RF) regions, elevated temperature (1–2◦ C) resulting from energy absorption is known to be a dominant factor inducing adverse health effects such as heat exhaustion and heat stroke [1]. Thermophysiological response, such as perspiration, vasodilatation, etc., is induced mainly by temperature elevation in the body core. Corresponding author: A. Hirata (
[email protected]).
54
Hirata, Sugiyama, and Fujiwara
Typical scenarios for RF whole-body exposures are patients in a magnetic resonance diagnostic device and workers at basestation antennas of wireless communications and broadcasting transmitters. In the international safety guidelines/standards [2, 3], the wholebody averaged specific absorption rate (WBA-SAR) is used as a metric of human protection for RF whole-body exposure. The threshold of the WBA-SAR is noted as 4–8 W/kg. This threshold is based on the fact that RF exposure of laboratory animals in excess of approximately 4 W/kg has revealed a characteristic pattern of thermoregulatory response [4]. In addition, decreased task performance by rats and monkeys has been observed at WBA-SAR in the range of 1–3 W/kg [5] According to Adair and Black [6], the physiological heat loss mechanisms are different for different species. In particular, small animals would be poor models for human beings. However, the relationship between WBA-SAR and core temperature elevation in humans for RF whole-body exposures has not been discussed sufficiently, nor has the difference due to species. Although the limit of WBA-SAR in the international standards/guidelines is not applied to patients in magnetic resonance diagnostic devices, the relationship between SAR and core temperature elevation is of interest. For example, some criteria have been regulated by the Food and Drug Administration in the USA [7]. We have developed an electromagnetic-thermal simulation code based on a finite-difference time-domain (FDTD) scheme with anatomically-based body phantoms for humans [8] and rabbits [9]. The unique aspect of our computational code is that it can take into account the time evolution of core or blood temperatures. A theoretical solution or a closed-form expression for estimating core temperature elevation is essential for a greater understanding of the relationship between WBA-SAR and core temperature elevation, since such computational schemes take a long time to analyze the time course of core temperature elevation Semi-analytical expressions of the thermoregulatory response in humans have been proposed in several studies (e.g., [10, 11]) and its applicability for RF exposures has been discussed by comparative measurements [12]. In these models, the human body is divided into several parts and their corresponding parameters are required. Although these models can be extensively applied, a simpler formula can be derived by focusing on the estimation of core temperature elevation from RF energy absorption. In the present study, we derive a formula for simply estimating the core temperature elevation in humans by RF whole-body exposure. The validity of the formula is confirmed by comparing to the results with the FDTD scheme. Based on the obtained formula, we discuss
Progress In Electromagnetics Research, PIER 99, 2009
55
the main factors influencing core temperature elevation due to RF exposure, together with its applicable range. 2. MODELS AND METHODS 2.1. Computational Phantoms The computational phantoms used in the present study are illustrated in Fig. 1, together with their dimensions in Table 1. Whole-body voxel phantoms for a Japanese adult male and a Japanese adult female were developed by Nagaoka et al. [13]. Volunteers were selected whose dimensions were close to the average values of Japanese. The male volunteer was 22 years old, 1.73 m tall and weighed 65.0 kg; the female volunteer was 22 years old, 1.6 m tall and weighed 53.0 kg. The numeric phantoms were developed based on the magnetic resonance images of these volunteers. The resolution of the phantoms was 2 mm segmented into 51 anatomical regions. A phantom for children three years of age was developed by applying a freeform deformation algorithm to the male phantom [14]. In this model, a total of 66 body dimensions were taken into account, and then shrunk with different scaling factors. Manual editing was applied in order to maintain their anatomical validity. The resolution of these phantoms was kept to 2 mm. The height and weight of the child phantom are 0.9 m and 13 kg. A voxel phantom for a rabbit has been developed in [15]. The resolution of the phantom was 1 mm segmented into 12 anatomical regions. This was constructed on the basis of X-ray CT images taken
22 years Female
22 years Male
3 years Rabbit
Figure 1. Anatomically-based human and rabbit phantoms.
56
Hirata, Sugiyama, and Fujiwara
Table 1. Parameters of human and rabbit models. Female 22 years Tissues Height [m] Weight [kg] Surface area [m2 ]
Male 22 years 3 years
51 1.60 53 2.30
51 1.73 65 2.85
51 0.90 13 0.90
Rabbit 12 2.0 0.21
at Kanazawa Medical University, Japan. The width, depth, and height of this model were 123 mm, 260 mm, and 152 mm, respectively The weight of the rabbit phantom was 2.0 kg. 2.2. Electromagnetic Dosimetry The FDTD method [16] is used for investigating the RF power absorbed in the numeric phantoms. For a truncation of the computational region, we adopted perfectly matched layers as the absorbing boundary. To incorporate the numeric phantoms into the FDTD scheme, the dielectric properties of tissues were required. These properties were determined by 4-Cole-Cole extrapolation [17]. For harmonically varying fields, the SAR is defined as µ ¶ σ ¯¯ ˆ ¯¯2 σ ¯¯ ˆ ¯¯2 ¯¯ ˆ ¯¯2 ¯¯ ˆ ¯¯2 SAR = (1) ¯Ex ¯ + ¯Ey ¯ + ¯Ez ¯ ¯E ¯ = 2ρ 2ρ ˆx , E ˆy , and E ˆz are the peak values of the electric field where E components, σ and ρ, which denote the conductivity and the mass density of the tissue, respectively. 2.3. Thermal Dosimetry Our FDTD code for the temperature calculation was given in our previous studies for humans [8] and rabbits [9], which validate our code by comparison with measurements. Note that heat exposure only was considered for humans [8], unlike [9] in which RF exposure was considered. This is due to ethical reasons. As expected from [12], core temperature elevation in humans exposed at the allowable limit in the safety guidelines/standards is comparable to a fluoroptic thermometer resolution of 0.1◦ C. The computational method of our thermal dosimetry is given briefly, since it is based on our formula. The air temperature is 28◦ C as a thermoneutral condition, and thus we do not need to consider
Progress In Electromagnetics Research, PIER 99, 2009
57
metabolic adjustments [6]. Note that computational thermal dosimetry in humans has been conducted extensively for whole-body exposures in different scenarios [18–20]. 2.3.1. Bioheat Equation For calculating temperature elevations in the numeric phantoms, a bioheat equation was used [21]: C(r)ρ(r)
∂T (r, t) = ∇ · (K(r) ∇T (r, t)) + ρ (r) SAR(r) + A(r) ∂t −B(r, t)(T (r, t) − TB (t)) (2)
where T (r, t) and TB (t) denote the respective temperatures of tissue and blood, C represents the specific heat of tissue, K represents the thermal conductivity of tissue, A represents the basal metabolism per unit volume, and B represents the term associated with blood perfusion. The blood temperature is considered to be spatially constant over the whole body since the blood circulates throughout the human body in one minute or less [22]. Thus, the blood temperature could be simplified as TB (r, t) = TB (t) as shown in (2). In rabbits, it takes far less time due to their smaller dimensions and higher blood perfusion rate than those of humans. The boundary condition between air and tissue Eq. (2) is given by the following equation: ∂T (r, t) = h(r) · (Ts (r, t) − Te ) + SW (t) (3) ∂n where h, Ts , and Te denote, respectively, the heat transfer coefficient, surface temperature, and air temperature. The heat transfer coefficient h is given by the summation of radiative heat loss hrad and convective heat loss hconv . SW represents the perspiration rate which will be discussed in the next subsection. The thermal constants of tissue used in the present study have also been summarized [8, 9]. Different heat transfer coefficients between the tissue and air are used depending on the body part. Specifically, the heat transfer coefficient between the skin and air and that between tissue and internal air for human models are 4.0 W/m2 /◦ C and 13 W/m2 /◦ C. On the other hand, for the rabbit model, the respective values of the heat transfer coefficients between the skin (excluding ear lobe) and air, that between internal air and tissue, and that between ear lobe and air are 0.65 W/m2 /◦ C, 13 W/m2 /◦ C, and 2.5 W/m2 /◦ C, respectively [23]. The blood temperature changes with time according to the −K(r)
58
Hirata, Sugiyama, and Fujiwara
following equation in order to satisfy thermodynamic laws [8, 18, 24]: Z QBTOT (t) TB (t) = TB0 + dt (4) t CB ρB VB Z QBTOT (t) = B(t)(TB (t) − T (r, t))dV (5) V
where QBTOT is the rate of heat acquisition of blood from body tissues. CB (= 4000J/kg·◦ C), ρB (= 1050 kg/m3 ), and VB denote the specific heat, mass density, and total volume of blood, respectively. In the following discussion, the blood temperature is considered as the core temperature. It has been shown that the blood temperature elevation in computation is reasonably considered as the core temperature, rather than the rectum and hypothalamus [8, 9]; the difference of the temperature elevations in blood and the hypothalamus was 5% or less. Since our interest concentrates on the temperature elevation in the body core that may induce a thermophysiological response, see the temperature distribution [8, 9] for RF whole-body exposures Note that the thermal modeling for localized exposure can be found in [25–27]. 2.4. Thermoregulatory Responses For a temperature elevation above a certain level, blood perfusion was activated in order to carry away the excess heat produced [20, 28]. As to the blood perfusion for all tissues except the skin, the regulation mechanism was governed by the local tissue temperature. Blood perfusion was equal to its basal value when that temperature remained below a certain level. Once the local temperature exceeded a given threshold, blood perfusion increased almost linearly with the temperature in order to carry away the heat produced. The formula proposed in [29] was applied in our model. The variations of blood perfusion in the skin through vasodilatation are expressed in terms of the temperature increase in the hypothalamus and the average temperature increase in the skin as given in [30]. The main difference between humans and rabbits in the thermoregulatory response is that the sweat glands in rabbits are virtually nonfunctional, allowing us to neglect this mechanism [31]. Then, the perspiration rate in (3) was simplified to be zero in the rabbit. The perspiration coefficients in the humans are assumed to depend on the temperature elevation in the skin and/or hypothalamus [10, 30]: ½ ¾ [α11 tanh(β11 (TS (t)−TS,0 )−β10 )+α10 ](TS (t)−TS,0 ) SW(t) = /S + [α21 tanh(β21 (TH (t)−TH,0 )−β20 )+α20 ](TH (t)−TH,0 ) (6)
Progress In Electromagnetics Research, PIER 99, 2009
59
where S is the surface area of the human body, and α and β are the coefficients associated with perspiration, whose values can be found in our previous study [7]. Ts and TH are the temperatures at the body surface and at the hypothalamus, respectively, and their subscript 0 corresponds to those at the thermally-steady state without heat load. The hypothalamus is located around the center of the head, and one of the main functions of the hypothalamus is to control the thermophysiological response. In (6), the coefficient of the perspiration rate associated with the temperature elevation in the hypothalamus is much larger than that for the body surface temperature [10, 30]. The difference in the perspiration rate between adults and children is marginal, as has been reported in [7]. 3. FORMULA DERIVATION In this section, we derive a formula for simply estimating the core temperature elevation with WBA-SAR. Let us consider the heat balance of a biological body as given in [6, 32]: M + PRF − Pt = Ps
(7)
where M is the rate at which thermal energy is produced through metabolic processes, PRF is the RF power absorbed in the body, Pt is the rate of heat transfer at the body surface, and PS is the rate of heat storage in the body. From (7), the total heat balance between the body and air is essential to characterize the core temperature elevation. More specific expression for (7) is given in the following equation based on (2) and (3). Z tZ Z tZ (A(r, τ ) − A0 (r)) dV dτ + SAR(r)·ρ(r)dV dτ 0 V 0 V ¾ ½Z tZ Z tZ h(r) (T (r, τ ) − T0 (r)) dSdτ + SW (τ )dSdτ − 0 S 0 S Z = (T (r, τ ) − T0 (r))·ρ(r)·C(r)dV (8) V
where To and Ao are the thermal steady temperature and basal metabolic rate without RF exposures. The first term of (8) represents the energy due to the metabolic increment caused by the temperature elevation. In the present study, this term is ignored for simplicity, since that energy evolves secondarily via the temperature elevation due to RF energy absorption [11]. Then, we obtained the following equation, as (7) suggests that the SAR and temperature distributions can be assumed to be uniform over
60
Hirata, Sugiyama, and Fujiwara
the body: (T (t)−T0 )·W ·CWBave Z t Z = SARWBave ·W·t − (T (τ )−T0 )dτ · (h(r) + sw(t))dS 0
(9)
S
where W = ρWBave · V is the weight of the model [kg], SARWBave is the WBA-SAR [W/kg], and CWBave is the mean value of the specific heat [J/kg ◦ C]. sw(t) is a coefficient identical to SW (t) except that the temperature is assumed to be uniform. Thus, SW (t) = sw(t)(T (t) − T0 ) where
½
sw(t) =
(10)
[α11 tanh (β11 (T (t) − T0 ) − β10 ) + α10 ] + [α21 tanh (β21 (T (t) − T0 ) − β20 ) + α20 ]
¾ /S.
(11)
By differentiating (9), the following equation is obtained: R (h(r)+sw(t))dS d (T (t)−T0 ) + S (T (t)−T0 ) = SARWBave ·W· t (12) dt W ·CWBave From this equation, the temperature elevation is obtained as T (t) = ∼ =
R µ µ R ¶¶ h(r)dS + S sw(t)dS W ·SARWBave S R 1−exp − T0 + R t W ·CWBave h(r)dS + S sw(t)dS S µ µ ¶¶ S(Heff + sw(t)) W · SARWBave T0 + 1−exp − t S(Heff + sw(t)) W · CWBave
(13) (14)
The difference between (13) and (14) is that an effective heat transfer coefficient was introduced for the surface area of the human body model, since the area of the body that is close to the internal air is difficult to define. The surface area integral of the heat transfer coefficient in (13) can be estimated from [33]. Table 2 lists the parameters for the numeric phantoms in the present study. Table 2. Parameters calculated for the formula (13).
R
Female 22 years [W/◦ C] [J/kg·◦ C]
s H(r)dS
CWBave
13.2 3440
Male 22 years 3 years 16.2 3510
7.3 3460
Rabbit 0.97 3570
Progress In Electromagnetics Research, PIER 99, 2009
61
4. FORMULA EFFECTIVENESS AND DISCUSSION In this section, we discuss the effectiveness of formula (13) derived in the above section. We chose three values of WBA-SAR: 4.0 W/kg
Temperature Elevation [oC]
3.5 Eq. (13) FDTD
3.0 2.5 2.0
Rabbit
1.5 1.0
Male
Female
0.5
3 years
00
1000
2000 Time [s]
3000
(a) Temperature Elevation [oC]
0.35 Eq. (13) FDTD
0.30 0.25
Rabbit
0.20 Male
0.15 0.10
Female
0.05 0
3 years 0
1000
2000 Time [s]
3000
(b) Temperature Elevation [oC]
0.07 Eq. (13) FDTD
0.06
Rabbit
0.05 0.04
Male
0.03 0.02
Female
0.01
3 years
0 0
1000
2000 Time [s]
3000
(c)
Figure 2. Time course of core temperature elevation in human and rabbit models: (a) 4 W/kg, (b) 0.4 W/kg, and (c) 0.08 W/kg.
62
Hirata, Sugiyama, and Fujiwara
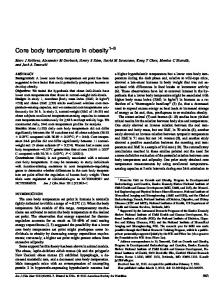
which approximately induces core temperature elevation of 1◦ C [7], 0.4 and 0.08 W/kg which are the basic restriction for occupational exposure and public exposures in the standards/guidelines [2, 3]. Figure 2 shows the time course of the core temperature elevation for different WBA-SARs in adult male and female models, and 3-yearold child model. The RF frequency is 2 GHz. From Fig. 2, the FDTDderived and estimated core temperature elevations in less than a few minutes are in good agreement for the different models and/or WBASAR values. On the other hand, some difference can be observed from a few minutes until reaching the thermally-steady state. The main reason for this difference can be attributed to our assumption that the temperature elevation in the body is spatially constant over the whole body. Specifically, the perspiration rate is determined by the temperature elevations in the skin and hypothalamus, although they are assumed to be the same. The point to be stressed here is that the core temperature elevates almost linearly in the rabbit model although it becomes saturated in the human models. This difference is due to the difference in the perspiration rate. Heat dissipation due to the perspiration rate is not sufficient in the rabbit, leading to excess temperature elevation. This result coincides with the claim in [6]. Figure 3 shows the difference in the core temperature elevations between FDTD results and results with (13) at 6, 30, and 60 mins. The reason for choosing these durations is that 6 min and 30 min are the times over which WBA-SAR should be averaged in the safety standards/guidelines [2, 3]. Note that the averaging time in [3] depends on the situation and frequency. The duration of 60 min is the time when the core temperature elevation almost reaches the thermallysteady state. The time courses of the core temperature elevations between these two schemes roughly coincides with each other. The differences between the two schemes at arbitrary times were within 30%. In particular, the formula (13) is relatively effective for higher WBA-SARs since the perspiration rate becomes almost saturated, and thus (10) becomes reasonable. Core temperature elevation due to (13) is larger than that by the FDTD method at 6 min. As seen in Fig. 2, the main reason for the former is caused by the thermal time constant which is governed by the specific heat of tissue. In the formula (13), the average specific heat of 3400– 3500 J/kg/◦ C was used, while those in the body core and blood are 3800–4100 J/kg/◦ C [8, 9]. On contrary, core temperature elevation due to (13) becomes closer to or smaller than that by the FDTD method with time. The reason for this would be the total amount of sweat. As mentioned in Sec. 2.4.2, the coefficient of the perspiration rate associated with the skin temperature elevation is smaller than
Progress In Electromagnetics Research, PIER 99, 2009
63
(a)
(b)
(c)
Figure 3. Difference of core temperature elevation between human and rabbit models at (a) 4 W/kg, (b) 0.4 W/kg, and (c) 0.08 W/kg.
64
Hirata, Sugiyama, and Fujiwara
that in the body core. Thus, the perspiration rate in the formula becomes larger than that in the FDTD method, resulting in a lower temperature elevation. When compared to the rabbit model, the difference between the FDTD results and the estimated values in the human model is rather large since the sweat glands in the rabbit are virtually nonfunctional. We discuss the effect of the RF frequency on the core temperature elevation estimated with (13) in the human models. In this discussion, we chose respective resonance frequencies in the human models and 2 GHz [34]. The reason for this choice is that the WBA-SAR has two peaks for plane-wave exposure at the ICNIRP reference level; more precisely, it becomes maximal at 60 MHz and 2 GHz in the adult male phantom; 70 MHz and 2 GHz in the adult female phantom and 130 MHz and 2 GHz in the 3-year-old child phantom. The point to be stressed here is that the SAR distributions at these frequencies have been reported to be quite different. A human behaves like a half-wave dipole at the resonance frequency and thus the SAR distribution at the frequency is relatively uniform over the body as compared with 2 GHz. At 2 GHz, the skin depth of the electromagnetic wave is at most a few centimeters and thus the SAR distribution is concentrated at the body surface. Fig. 4 shows the time course of the core temperature elevation at WBA-SAR of 4.0 W/kg for adult male and child. Note that the core temperature elevation in the adult male model was comparable to that of the female and thus not shown here to avoid complexity. From this figure, the time course of the core temperature estimated with (12) and computed with the FDTD method are in better agreement with each other at the respective resonance frequencies than those at 2 GHz.
Temperature rise [o C]
1.0
Simplified Eq. FDTD (70 or 130 MHz) FDTD (2000 MHz)
0.8 0.6
Female 0.4 0.2
3 years
0 0
1000
2000
3000
Time [s]
Figure 4. Time course of core temperature elevation in human models at respective resonance whole-body resonance frequency and 2 GHz.
Progress In Electromagnetics Research, PIER 99, 2009
65
The reason for this is that the differences between the core and skin temperature elevations at resonance frequencies are smaller than those at 2 GHz, which is mainly caused by the SAR distribution. Therefore, the approximation of (10) is relatively reasonable at the resonance frequencies. For WBA-SARs of 0.4 and 0.08 W/kg, the maximum difference was less than 30% compared to the FDTD computed values. Figure 5 shows the frequency dependence of the difference in core temperature elevation between values estimated with (13) and FDTD-computed values. The time duration is 60 min. As is evident from this figure, the difference between the estimated and FDTDcomputed values is less than 30% over RF. This frequency dependency is caused by the SAR distribution. At 500 MHz, the difference becomes maximal in the adult male, since the SAR in the brain or hypothalamus is relatively larger than the other frequencies, and therefore, the assumption of (10) is not sufficient. Finally, let us discuss the dominant factors influencing the core temperature elevation based on (14), which is further approximated from (13). In that formula, there are the terms associated with perspiration in the coefficient and decay factor. Therefore, the heat loss is due to the perspiration influences the steady-state core temperature elevation and the thermal time constants. This is confirmed from the comparison of the core temperature elevations between the human phantoms and the rabbit phantom since the sweat gland of the latter is virtually nonfunctional (see Fig. 3). This tendency can also be confirmed from the results computed with the FDTD method. From (14), the steady-state core temperature elevation is largely influenced by the body surface area-to-weight ratio S/W [m2 /kg]. Note
Difference [%]
40
20
0
4 W/kg 0.4 W/kg Male 0.08 W/kg
-20
4 W/kg 0.4 W/kg Rabbit 0.08 W/kg
-40 0.01
0.1
1
10
Frequency [GHz]
Figure 5. Frequency dependency of the difference in core temperature elevation when estimated with (13) and FDTD result.
66
Hirata, Sugiyama, and Fujiwara
that the body surface area-toweight ratio was 0.041 m2 /kg for the adult male, 0.043 m2 /kg for the adult female, and 0.060 m2 /kg for the three-year-old child. The dominant factor influencing the thermal time constant is also the same as that of the steady-state core temperature elevation, since the specific heat marginally depends on the human models of different genders and/or ages (see Table 1). These can be confirmed in Fig. 2, in which the steady-state temperature elevation and thermal time constant in the three-year-old child model are smaller than those of the adult models. The FDTD-computed results given in these figures also support the conclusion based on the proposed formula. 5. SUMMARY In the present study, we proposed a formula which estimates the core temperature elevation in the human models with the WBA-SAR. As a result, the core temperature elevations estimated with the formula are in reasonable agreement with the results obtained with the FDTD computation (at most 30%), which takes much longer. Based on the formula, the WBA-SAR, which is a metric of international safety standard/guidelines, is shown to be a good measure for estimating core temperature elevation. However, it depends on the species, as pointed out in [6]. We clarified the main factors influencing the core temperature elevation as the body surface area-to-weight ratio and perspiration rate. The difference between the estimated value with the formula and the FDTD computation was mostly 10% for the frequencies in the RF region. The difference is caused by our precondition that the total heat balance between the body and air is essential to characterize the core temperature elevation From the formula derived, one can estimate the core temperature elevation in different human models, such as children and pregnant woman as suggested in [35]. This formula would give reasonable estimate for such human beings. ACKNOWLEDGMENT This work was supported in part by Strategic Information and Communications R&D Promotion Programme (SCOPE) and International Communications Foundation, Japan.
Progress In Electromagnetics Research, PIER 99, 2009
67
REFERENCES 1. Threshold Limit Values for Chemical Substances and Physical Agents and Biological Exposure Indices, American Conference of Government Industrial Hygienists (ACGIH), Cincinnati, OH, 1996. 2. ICNIRP, “International commission on non-ionizing radiation protection guidelines for limiting exposure to time-varying electric, magnetic, and electromagnetic fields (up to 300 GHz),” Health Phys., Vol. 74, No. 4, 494–522, Apr. 1998. 3. IEEE, “IEEE standard for safety levels with respect to human exposure to radio frequency electromagnetic fields, 3 kHz to 300 GHz,” C95-1, 2005. 4. Michaelson, S. M., “Biological effects and health hazard of RF and MW energy; fundamentals and overall phenomenology,” Biological Effects and Dosimetry of Nonionizing Radiation, 337–357, Plenum Press, New York, 1983. 5. D’Andrea, J. A., J. R. DeWitt, O. P. Gandhi, S. Stensaas, J. L. Lords, and H. C. Neilson, “Behavioral and physiological effects of chronic 2450-MHz microwave irradiation of the rat at 0.5 mW/cm2 ,” Bioelectromagnetics, Vol. 7, 45–56, 1986. 6. Adair, E. R. and D. R. Black, “Thermoregulatory responses to RF energy absorption,” Bioelectromagnetics Suppl., Vol. 6, S17–S38, 2003. 7. “Guidance for the submission of paremarket notifications for magnetic resonance diagnostic devices,” Center for Devices and Radiologic Health, Food and Drug Administration, Rockville, MD, 1998, http://www.fda.gov/cdrh/ode/guidance/793.html. 8. Hirata, A., T. Asano, and O. Fujiwara, “FDTD Analysis of bodycore temperature elevation in children and adults for whole-body exposure,” Phys. Med. Biol., Vol. 53, 5223–5238, 2008. 9. Hirata, A., H. Sugiyama, M. Kojoma, H. Kawai, Y. Yamashiro, O. Fujiwara, S. Watanabe, and K. Sasaki, “Computational model for calculating body-core temperature elevation in rabbits due to whole-body exposure at 2.45 GHz,” Phys. Med. Biol., Vol. 53, 3391–3404, 2008. 10. Fiala, D., K. J. Lomas, and M. Stohrer, “Computer prediction of human thermoregulation and temperature responses to a wide range of environmental conditions,” Int. J. Biometeorol., Vol. 45, No. 3, 143–159, 2001. 11. Stolwijk, J. A. J. and J. D. Hardy, “Control of body temperature,” Handbook of Physiology, Section 9, Reactions to Environmental
68
12. 13.
14.
15.
16. 17. 18.
19.
20.
21.
Hirata, Sugiyama, and Fujiwara
Agents, H. K. Douglas (ed.), 45–69, American Physiological Society, Bethesda, MD, 1977. Foster, K. R. and E. R. Adair, “Modeling thermal responses in human subjects following extended exposure to radiofrequency energy,” Biomed. Online, Vol. 3, 4, 2004. Nagaoka, T., S. Watanabe, K. Sakurai, E. Kunieda, S. Watanabe, M. Taki, and Y. Yamanaka, “Development of realistic highresolution whole-body voxel models of Japanese adult male and female of average height and weight, and application of models to radio-frequency electromagnetic-field dosimetry,” Phys. Med. Biol., Vol. 49, 1–15, 2004. Nagaoka, T., E. Kunieda, and S. Watanabe, “Proportioncorrected scaled voxel models for Japanese children and their application to the numerical dosimetry of specific absorption rate for frequencies from 30 MHz to 3 GHz,” Phys. Med. Biol., Vol. 53, 6695–6711, 2008. Wake, K., H. Hongo, S. Watanabe, M. Taki, Y. Kamimura, Y. Yamanaka, T. Uno, M. Kojima, I. Hata, and K. Sasaki, “Development of a 2.45-GHz local exposure system for in vivo study on ocular effects,” IEEE Trans. Microwave Theory & Tech., Vol. 55, 588–596, 2007. Taflove A. and S. Hagness, Computational Electrodynamics: The Finite-difference Time-domain Method, 3rd edition, Artech House, Norwood, MA, 2003. Gabriel, S., R. W. Lau, and C. Gabriel, “The dielectric properties of biological tissues: III. Parametric models for the dielectric spectrum of tissues,” Phys. Med. Biol., Vol. 41, 2271–293, 1996. Bernardi, P., M. Cavagnaro, S. Pisa, and E. Piuzzi, “Specific absorption rate and temperature elevation in a subject exposed in the far-field of radio-frequency sources operating in the 10-900MHz range,” IEEE Trans. Biomed. Eng., Vol. 50, 295–304, 2003. Wainwright, P. R., “The relationship of temperature rise to specific absorption rate and current in the human leg for exposure to electromagnetic radiation in the high frequency band,” Phys. Med. Biol., Vol. 48, 3143–3155, 2003. Bit-Babik, G., A. Faraone, C.-K. Chou, A. Radmadze, and R. Zaridze, “Correlation between locally averaged SAR distribution and related temperature rise in human body exposed to RF field,” Proc. BEMS 2007, 2–5, 2007. Pennes, H. H., “Analysis of tissue and arterial blood temperatures in resting forearm,” J. Appl. Physiol., Vol. 1, 93–122, 1948.
Progress In Electromagnetics Research, PIER 99, 2009
69
22. Follow, B. and E. Neil, Circulation, Oxford Univ. Press, New York, USA, 1971. 23. Mohsin, S. A., N. M. Sheikh, and U. Saeed, “MRI induced heating of deep brain stimulation leads: Effect of the air-tissue interface,” Progress In Electromagnetics Research, PIER 83, 81–91, 2008. 24. Hirata, A., S. Watanabe, M. Kojima, I. Hata, K. Wake, M. Taki, K. Sasaki, O. Fujiwara, and T. Shiozawa, “Computational verification of anesthesia effect on temperature variations in rabbit eyes exposed to 2.45-GHz microwave energy,” Bioelectromagnetics, Vol. 27, 602–612, 2006. 25. Ibrahiem, A., C. Dale, W. Tabbara, and J. Wiart, “Analysis of the temperature increase linked to the power induced by RF source,” Progress In Electromagnetics Research, PIER 52, 23–46, 2005. 26. Liu, Y., Z. Liang, and Z. Yang, “Computation of electromagnetic dosimetry for human body using parallel FDTD algorithm combined with interpolation technique,” Progress In Electromagnetics Research, PIER 82, 95–107, 2008. 27. Hirata, A., K. Shirai, and O. Fujiwara, “On averaging mass of SAR correlating with temperature elevation due to a dipole antenna,” Progress In Electromagnetics Research, PIER 84, 221– 237, 2008. 28. Foster, K. R. and R. Glaser, “Thermal mechanisms of interaction of radiofrequency energy with biological systems with relevance to exposure guidelines,” Health Phys., Vol. 92, 609–620, 2007. 29. Hoque, M. and O. P. Gandhi, “Temperature distribution in the human leg for VLF-VHF exposure at the ANSI recommended safety levels,” IEEE Trans. Biomed. Eng., Vol. 35, 442–449, 1988. 30. Spiegel, R. J., “A review of numerical models for predicting the energy deposition and resultant thermal responses of humans exposed to electromagnetic fields,” IEEE Trans. Microwave Theory & Tech., Vol. 32, 730–746, Aug. 1984. 31. Marai, I. F. M., A. A. M. Habeeb, and A. E. Gad, “Rabbits’ productive, reproductive and physiological performance traits as affected by heat stress: A review,” Livestock Prod. Sci., Vol. 78, 71–90, 2002. 32. Ebert, S., S. J. Eom, J. Schuderer, U. Spostel, T. Tillmann, C. Dasenbrock, and N. Kuster, “Response, thermal regulatory threshold of restrained RF-exposed mice at 905 MHz.,” Phys. Med. Biol., Vol. 50, 5203–5215, 2005. 33. Nakayama, T. and M. Iriki, “Physiology of energy exchange and thermoregulation,” Handbook of Physiological Science, Vol. 18,
70
Hirata, Sugiyama, and Fujiwara
Igaku-Shoin Ltd., Tokyo, 1987. 34. Wang, J., S. Kodera, O. Fujiwara, and S. Watanabe, “FDTD calculation of whole-body average SAR in adult and child models for frequencies from 30 MHz to 3 GHz,” Phys. Med. Biol., Vol. 51, 4119–4127, 2005. 35. WHO, “RF research agenda,” 2006.