12th International Conference on Information Fusion Seattle, WA, USA, July 6-9, 2009
Estimation of Crowd Behavior Using Sensor Networks and Sensor Fusion Maria Andersson, Joakim Rydell, Jörgen Ahlberg FOI Swedish Defence Research Agency SE 581 11 Linköping, Sweden
[email protected] [email protected] [email protected] in practice implies that we need a learning system that can adapt to the normal behaviors in the current context. In spite of the growing need and market for efficient surveillance, much research in this area has a touch of technology push, i.e., focusing on what can be done, and not what needs to be done. For example, analysis of video imagery is very popular, since it is easy to get access to such data (there are numerous public datasets [1, 2, 3]). However, important indicators of threats are not easily revealed by video data alone, and this is the reason why we work on heterogeneous sensors, as described below. In this article, we propose to process the data from a set of heterogeneous sensors in order to extract binary observations (e.g. is there a crowd present?) and feed these observations to a Hidden Markov Model (HMM), where the hidden states represent the behavior of the crowd. The article is organized as follows. In section 2, the various sensors and their purpose are briefly described. Section 3 treats sensor fusion and crowd modeling using the HMM. Section 4 describes work done on analysis of sensor data in order to extract the binary observations that can reveal threats or abnormal behavior. Section 5 describes our experimental results. Conclusions and future work are discussed in sections 6 and 7.
Abstract – Commonly, surveillance operators are today monitoring a large number of CCTV screens, trying to solve the complex cognitive tasks of analyzing crowd behavior and detecting threats and other abnormal behavior. Information overload is a rule rather than an exception. Moreover, CCTV footage lacks important indicators revealing certain threats, and can also in other respects be complemented by data from other sensors. This article presents an approach to automatically interpret sensor data and estimate behaviors of groups of people in order to provide the operator with relevant warnings. We use data from distributed heterogeneous sensors (visual cameras and a thermal infrared camera), and process the sensor data using detection algorithms. The extracted features are fed into a Hidden Markov Model in order to model normal behavior and detect deviations. We also discuss the use of radars for weapon detection. Keywords: Behavior analysis, heterogeneous sensors, distributed network, image processing, sensor fusion, Hidden Markov Models.
1
Introduction
In order to protect citizens, property and infrastructure, surveillance systems are increasingly being fielded. Typically, such a system consists of a large amount (often hundreds) of CCTV cameras, monitored by operators in a control room. The human operators are usually able to watch only a fraction of the imagery being presented to them. Moreover, to detect abnormal or threatening events is a complex cognitive task requiring a focus that humans can uphold for only a short time. As a consequence, surveillance video is often used for post-analysis rather than detection. Thus, there is a need for persistent systems for proactive surveillance, i.e. systems which give early warnings for threats or abnormal behavior. There are a number of technical problems to be solved in order to enable such systems. First, the (popular) computer vision topic of detecting and tracking humans in surveillance video. Second, the extraction of features that can indicate the presence of and/or classify threats or types of behavior. Third, the modeling of behaviors in order to know what to look for. Since we cannot anticipate all possible threats, this
978-0-9824438-0-4 ©2009 ISIF
1.1
Previous work
Work on detection and tracking algorithms for dense crowds can be found in the literature. In [4] a method is suggested for simultaneously tracking all people in a dense crowd using a set of cameras with overlapping fields of view. To overcome occlusion the cameras are placed at a high elevation and only the heads of the people are tracked. The method was tested on data from indoor and outdoor scenarios under challenging illumination conditions. It was possible to successfully track up to twenty people walking in a small area, in spite of severe occlusions. In [5] a realtime system for detection of moving crowds is presented. A scheme is proposed that looks at the motion patterns of the crowd in the spatio-temporal domain. Experiments show that crowds can be detected at distances up to 70 m. Extraction of features for classification of behavior in video is a current research topic, see, for example, [6, 7, 8]. HMM has been used in various applications for behavior
396
recognition, see for example [9] for facial action recognition and [10] for crowd behavior analysis with data from a single visual camera.
2
Sensors for urban monitoring
As mentioned above, other sensors than surveillance cameras can provide complementary information and indicators of threats and abnormal behavior. It can be argued that ordinary visual video cameras (CCTV) are inexpensive and already abundant, and that additional sensor types results in additional costs. However, these extra costs are expected to result in higher efficiency of the total system. Complementary sensors that can be used are described below. Thermal infrared (TIR) cameras, i.e. cameras operating in the long wave infrared band (8–12 micrometers) are sensitive to the emitted radiation from objects with temperatures common around us (approx. -30 to 100 degrees Celsius). Since the amount of reflected radiation is very small in this band, the cameras are useful in total darkness, and the imagery contains no cast shadows or variation in illumination – both common problems in analysis of visual imagery. Historically thermal cameras have been too expensive to be used in other than special applications. However, this situation is now changing with the advent of inexpensive high-resolution un-cooled thermal cameras in the market. Radars can potentially give clues of high value for security applications. Not only do radars give range data, but, more important in our application, they can also see through materials that optical sensors cannot. Thus, radar sensors can, potentially, be used to reveal concealed objects, like weapons hidden under clothing. Stand-off detection of weapons using imaging radar is currently a research topic by its own, and will hit the market somewhat later. It is obvious that acoustic sensors can provide indicators for abnormal behavior that are hard to extract from images, for example screaming. Moreover, acoustic sensors can also be used for localization of sound sources, which is especially useful in combination with image data (that person is shouting, firing a gun, etc.).
3
in a next step confirm the estimated behavior and decide whether further actions need to be taken.
Crowd behavior modeling
Detecting and tracking people in dense crowds is a challenging problem because of e.g. occlusion and the fact that individuals can often not be segmented properly. The idea in this paper is instead to regard the crowd as one unit that emits observations which can be used to estimate the behavior of the crowd as being normal or abnormal (see Figure 1). In this application there is no need of identifying specific persons in the crowd, or to determine their exact positions in the scene. We only want to know if the crowd can be assumed as normal, if there is an increased threat level or if something abnormal has occurred. This is expected to be enough information for an operator, who can
Figure 1. The crowd is viewed as a single unit that emits observations obtained from the different sensors.
3.1
Hidden Markov Model
The Hidden Markov Model (HMM) λ is a useful tool for automatic classification of behaviors and patterns. It is a doubly embedded stochastic process which has an underlying stochastic process that is not observable. λ is described by the following parameters:
λ = ( A, B, π , S , O i )
(1)
where A B
π
S Oi
= probability distribution of state transitions = probability distribution of observations in each state = initial state distribution = states in the model = discrete observation symbols per state
The underlying process can be observed through another stochastic process that produces sequences of observations Oi. The states S represent some unobservable conditions of the system. In each state there is a certain probability of producing any observable system outputs Oi together with a probability indicating the likely next states. The parameters A, B, and π can be obtained by training λ on relevant training data. The training can be performed using the EM algorithm [11]. In this application we use λ to model normal behavior. If λ yields a high likelihood value for a specific observation sequence O, it is likely that O represents normal behavior. But if λ yields a low likelihood value it is likely that O does not represents normal behavior.
3.2
HMM for normal crowd behavior
Normal behavior of a crowd can be expected to correspond to relatively calm movements, for example associated with walking and standing. Generally, there should seldom be persons falling or lying down on the ground, at least for longer time periods. There should not be any weapons present. There should not be any loud sounds. However, unusual observations should be allowed for shorter time periods since they may occur also for normal behavior, or
397
can be the result from incorrect sensor detections. The types of observations that we have used in this article are presented in Table 1. These observations are binary and extracted from sensor data using the methods described in section 4. They are useful especially for visual and TIR cameras. Table 1: Explanation of the different crowd observations. Observation Explanation of the observation O1 Normal activities, calm movements, persons are standing and walking O2 Increased activities (e.g. walking), intensive activities by a few O3 Strongly intensive activities by many O4 A person is not standing. The person may be sitting or lying down O5 A crowd exists (has been formed) within a certain area O6 The crowd is large i.e. exceeds a certain amount of detections O7 The crowd size is rapidly increasing
⎛ S1 ⎞ ⎛ 0.41⎞ ⎟⎟ = ⎜⎜ ⎟⎟ ⎝ S 2 ⎠ ⎝ 0.59 ⎠
π = ⎜⎜
⎛ ⎜ A = ⎜ S1 ⎜S ⎝ 2
3.3
Computation of the likelihood
α t (i ) = P(O1 , O 2 ,...Ot , q t = S i | λ )
(4)
where qt is the current state. Eq. 4 is iterated for the whole observation sequence, i.e. t = 1, 2,…, T-1. The final result is given by the sum of the forward variables αt(i) for the different states, at time T. N
P (O | λ ) = ∑ α T (i ) i =1
(5)
To be able to handle very small numbers the scaling factor ct is introduced [11].
ct =
1 N
∑ α (i) t
(6)
i =1
The final equation for calculating the likelihood is: T
log[ P (O | λ )] = −∑ log ct
1
Observation probability B
(3)
An observation sequence O = O1, O2, …Ot; Oi ∈ {O1..O7} to λ is created by collecting the emitted observations as they arrive to the fusion node. Each observation Ot corresponds to the value of one of the alternatives in Table 1. When O has reached enough observations, the likelihood that O belongs to the model λ is calculated. For calculating the likelihood the Forward algorithm is used:
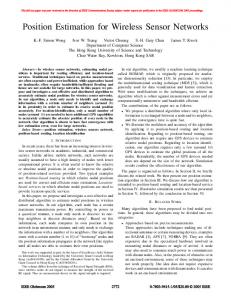
Since we do not have enough recorded training data we have derived training data based on knowledge and experience of what often is associated with normal behavior. The training data also include observations that are mostly regarded as abnormal or unusual in order to reflect the fact that they may appear occasionally also for normal behavior. The training data consist of 100 observation sequences, with 10 observations per sequence. For λ we selected two states, which refer to calm motions (standing and walking) for S1, and slightly increased activities (predominantly walking) for S2, still belonging to normal behavior. Both states include certain segments of unusual observations from e.g. incorrect sensor detections and the fact that unusual observations may occur occasionally also for normal behavior. We also selected the seven types of observations (O1 – O7), presented in Table 1. Figure 2 and Eqs. 2-3 present the parameters that were obtained from the training process.
(7)
t =1
0.9
S1
0.8 0.7
4
0.6 0.5 0.4
S2
0.3 0.2 0.1 0
S1 S2 ⎞ ⎟ 0.52 0.48 ⎟ 0.22 0.78 ⎟⎠
(2)
1
2
3
4
5
6
7
Observation symbol of the crowd
Figure 2. Probability distribution of observations (B) for the states S1 and S2.
From sensor data to observations
As input to the crowd behavior analysis described in Section 3, we need to extract a number of observation variables. As a preliminary step, we also need to detect the presence of persons in the monitored area. Then, we extract the intensity of the motion of the detected persons, the pose of the persons and the size and growth rate of the crowd. These extractions use different sensor data as input, and are described in the following.
398
4.1
Motion activity measurement
The level of activity of persons in a crowd provides information which can be used to detect anomalous crowd behavior. Normal behavior often corresponds to calm movements, i.e. people standing or moving relatively slowly through the scene, without making excessive gestures. An anomalous event, however, is likely to be accompanied by more rapid movements. We define three levels of activity: normal activity (calm motion), intensive activities by a few and intensive activities by several. These three levels of activity correspond to three binary observations to be fed into the crowd behavior analysis. The level of activity is measured by computing the optical flow (in this case in the visual image) in the vicinity of each detected person. If a person is walking quickly, running or moving his or her arms rapidly, the magnitude of the optical flow will be large compared to when a person is moving slowly or standing still. An average value of the magnitude of the optical flow is obtained. The measurement requires detection of persons in the scene. Since we focus on surveillance scenarios with static cameras, we employ a foreground and background segmentation algorithm similar to that proposed in [12]. Persons are detected in the foreground image using a head detector [13]. By thresholding the level of activity, as explained in Section 5.1, the binary observations O1, O2, and O3 are extracted.
4.2
Rough pose estimation
TIR data make possible a robust detection of people, since the data are relatively insensitive to variations in the environment, such as shadows and illumination. Detected persons in a TIR image are shown in Figure 3. Objects are automatically detected by performing background segmentation. The derived foreground pixels are used for confirming the detection of people. This confirmation is performed by using image gradients∇I(x,y), which are defined by a vector whose individual components are given by the two partial derivatives [14]:
I x ( x, y ) =
∂I ( x, y ) ∂x
(8)
I y ( x, y ) =
∂I ( x, y ) ∂y
(9)
where I represents the image with the foreground objects, where the foreground objects are represented in color (i. e. I is not a binary image). Ix and Iy are compared with the thresholds ΔT1 and ΔT2, after the background segmentation, to classify the head (ΔT1) and the body (ΔT2,) respectively. For especially lower surrounding temperatures ΔT1 > ΔT2.
90
100
110
120
130
140 120
130
140
150
160
170
180
190
Figure 3. Foreground objects (a small crowd) in a TIR image. The surrounding temperature is around 0 oC. Once a pixel where Ix or Iy exceed ΔT1 has been found, the lower neighboring area is investigated to see if Ix or Iy exceed ΔT2 in a sufficient number of pixels. If this larger area can be found it is assumed that a standing person has been detected. If this larger area can not found the person may be sitting or lying down. The expected size of a person in the image is assumed to be known, since the cameras have been calibrated for the scene. The pose estimation is used for the extraction of observation O4.
4.3
Estimation of the crowd size
The existence and size of a crowd can be estimated by detecting persons and counting the number of detections. This can be done with both visual and TIR data. However, counting the number of detections may be difficult if the crowd is dense and specific individuals can not be separated. Another way of approximating the size of the crowd is to estimate the part of the image where foreground objects are present, and divide this number with the total amount of pixels. With calibrated cameras, and the head detection as described above, the distance to the crowd can be known. This improves the estimation of the crowd size. A threshold value is used to indicate when a crowd is assumed to be present. Sometimes it is of interest to estimate the existence and size of a crowd within a specific area in the image. This can be done by limiting the search for foreground objects to this specific area. What is considered as a large crowd will differ from case to case. To obtain a realistic estimation of the crowd size, measurements should be performed over a certain time period. The crowd size is used for extraction of observations O5, O6 and O7.
4.4
Weapon detection
In addition to optical sensors, a radar sensor can provide important information about a crowd, especially concerning the estimated threat level. A high-resolution radar has the capability to detect weapons carried by a person. The weapons could also be hidden under clothing. Work is going on to develop radar image processing techniques for detection of hidden weapons [15].
399
Figure 4 shows radar reflections of four persons in two images. In the image to the left the persons do not carry any weapons. But in the image to the right the persons carry weapons. As can be seen there are differences in radar reflections, especially for the outermost persons. In the right image these persons carry larger weapons such as a bomb belt and a rifle. The persons in the middle carry a pistol and a grenade, which are quite small objects. The body itself causes radar reflections. Hence, it can be difficult to distinguish between natural reflections and reflections that come from weapons, especially small weapons. The false alarm rate for weapon detection can therefore be relatively high.
150
200
250
300
350
200
250
300
350
400
450
500
Figure 6. The view from the other visual camera. A fight is just about to start.
Figure 4. In the left radar image the persons do not carry weapons. In the right image the persons carry weapons.
The radar is not present in the experiment described in section 5. However, if a radar was present and a weapon was detected the HMM should indicate a large deviation from normal behavior. This is important since weapon detection indicates a high threat level that requires a quick measure from the operator. Since weapons are associated with high threat level, a higher false alarm rate for weapon detection could be acceptable.
5
Experimental results
A film sequence of a fight illustrates the detection and HMM algorithms as alert functions. Two small crowds approach each other on a road and meet at an open space. 50 100 150 200 250 300 350 400 450 500 550 100
200
300
400
500
600
700
Figure 5. The view from one of the visual cameras. The two small groups of people meet.
A fight starts and after a while the fight is over and one of the persons has been hurt and remains lying, as the others are leaving. The event is observed by three cameras: two visual cameras and one TIR camera. All cameras observe the scene from different positions. In Figures 5 - 7 parts of the event are shown from the different cameras.
Figure 7. The view from the TIR camera. The fight is over and one person remains lying on the ground as the others soon will leave the area.
5.1
Sensor detections
Applying the activity level measurement presented in section 4.1 to images from the two visual cameras, the results shown in Figure 8 and 9 are obtained. Two thresholds have been applied (red lines) to define the three types of observations O1, O2 and O3. The first value (y = 5) indicates the transition from normal activities/calm motions to more intensive activities performed by a few. The next value (y = 12.5) indicates the transition to strongly intensive activities by many. The thresholds are based on knowledge and experience of what can be expected as normal. However, for motion activity estimation there is a risk that there will be a relatively large amount of false alarms, since it is often difficult to measure separate motions in a crowd. The results from camera 1 shows that most of the time the activity represents normal behaviors. The fight starts at t ≈ 20 and ends at t ≈ 27, and the estimated activity level clearly rises in this interval. The results from camera 2 show that the variation in activity is somewhat different compared to camera 1. This is because the cameras observe from different angles and hence will observe different activities. A peak is however obtained at around the same time as in camera 1, which indicates the increased activities associated with the fight.
400
30
2
25
1.5
Rough pose estimation
Motion activity (visual camera 1)
Person not standing, O4 = 1
20
15
Intensive activities by many, O3 = 1
10
Intensive activities by a few, O2 = 1
5
1
0.5
0
-0.5 Person standing Normal activities, O1 = 1
0 0
5
10
15
20
25
30
-1 0
35
5
10
Time (t)
15
20
25
30
35
Time (t)
Figure 8. Motion activity from camera 1. The red lines represent the different activity levels. The time interval between observations is 0.1 s.
Figure 10. Rough pose estimation according to TIR data. 2 Crowd, O5 = 1 1.5
Existence of crowd
Motion activity (visual camera 2)
30
25
20
15
Intensive activities by many, O3 = 1
10
Intensive activities by a few, O2 = 1
0.5
0
-0.5 No crowd -1 0
5 Normal activities, O1 = 1 0 0
1
5
10
15
20
25
30
35
5
10
15
20
Time (t)
25
30
35
Figure 11. Estimation of the presence of a crowd.
Time (t)
Figure 9. Motion activity from camera 2, which has another position compared to camera 1. The red lines represent the different activity levels.
The rough pose estimation according to the TIR camera is presented in Figure 10 (and derived according to section 4.2). The TIR observations are obtained with longer time intervals compared to the visual cameras. At t ≈ 23 a person falls down as a result of the fight. This is observed by the TIR camera (O4 = 1). At t ≈ 27 the lying person is hidden behind another person (i.e. occlusion) and there is no indication from the TIR camera on a lying person. If there are incorrect head detections the pose estimation may also be incorrect. This happens here just before t ≈ 15.
The presence of the crowd is estimated by dividing the detected foreground pixels with the total amount of pixels in the TIR image (according to section 4.3). At t ≈ 20 a crowd is formed and O5 = 1. The result of the crowd estimation is illustrated in Figure 11. In this case the crowd is not estimated as large and it is not rapidly increasing in size. Therefore O6 and O7 will not be equal to 1 during the film sequence.
5.2
Crowd behavior analysis
The estimation of the crowd behavior is presented in Figure 12. Thirty-five observation sequences, each with 10 observations, are analyzed with HMM. The observations O1 - O3 are reported by both visual cameras and O4 – O7 are reported by the TIR camera. If there are only normal activities reported from the sensors (i.e. predominantly O1 = 1 and O2 = 1) for the
401
Loglikelihood for normal/abnormal behavior
whole observation sequence, the log-likelihood for normal behavior is -8.2. To be able to consider a certain number of false alarms, also at this stage, the threshold for abnormal behavior has been set lower than -8.2, in this case -10 (red line in Figure 12).
We have tested this approach for another scenario with a similar fight scene. This other scenario describes a check-in disk at an airport, where a fight takes place. Data are collected from two distributed visual cameras and one TIR camera. Two of them report motion activities and the third reports rough pose estimations. The approach shows also for the airport scenario that the log likelihood for normal behavior is strongly reduced during the fight. For the airport scenario the same representation for normal behavior was used as in the experiment described in this article. To obtain good results also for other typical airport events the HMM should be adapted to typical airport activities. Hence, to get representative HMM parameters for the airport environment the training data should reflect normal activities at airports.
0 -2
Normal behavior
-4 -6 -8 -10 -12
6
-14 -16
Abnormal behavior
-18 -20 0
5
10
15
20
25
30
35
Time (t)
Figure 12: The likelihood of normal behavior during the film sequence. For t > 20 s the behavior can be clearly estimated as abnormal.
The crowd behavior can be estimated as abnormal especially for t > 20. Before that there are also shorter time intervals when the behavior is estimated as abnormal. These intervals may indicate the more threatening event that is to come. They also indicate some incorrect sensor detections. When t > 20 there are two or more cameras that simultaneously, or just after another, detect abnormalities and consequently the log-likelihood for normal behavior is strongly reduced.
5.3
Discussions
It is important to have a representative description of the normal behavior for the specific monitoring application. This description is the basis for how well the HMM can give indications on deviations from the normal behavior. Some monitoring environments are easier to handle for an automatic algorithm than others. It is easier to handle environments where the persons are expected to move according to specific movement patterns. In environments with less specific movement patterns the analysis will be more complicated. Airports and ports represent environments that include areas with expected movement patterns, e.g. areas with check-in and security controls (that must be passed). Monitoring areas with more degrees of freedom are for example school yards and also open public outdoor spaces (which was used in this experiment). Furthermore, on a school yard intensive movements belong to normal behavior to a larger extent than in many other environments.
Conclusions
As presented in this article the HMM is a useful tool for estimating behaviors of a crowd. Observations to the HMM are derived from distributed and heterogeneous sensors. There is no need of identifying specific persons or decide their exact positions in the scene. The aim is to become aware of that something abnormal has occurred. The concept is used for automatically alerting operators when abnormal behaviors occur, or are about to occur. The experiment shows how the contributions from different sensors affect the overall opinion on the crowd behavior. The different sensors indicate abnormality at different times and during different time periods. A reason for this is that the sensors observe the scene from different angles and in different ranges of the electromagnetic spectrum. With the HMM the different observations can be evaluated simultaneously, and over time, and be compared to expected normal behaviors. This is useful when abnormality can be indicated by several different observations, which may not necessarily indicate abnormality if they are analyzed one at a time. The capability of the HMM is strongly dependent on its parameters. Relevant HMM parameters are obtained by training the model with relevant training data. It is preferable to model only the normal behavior, instead of different abnormal behaviors, since it is easier to get accurate training data for normal behavior. Moreover, it is often unknown how abnormal behaviors can appear. The HMM is also suitable for handling false sensor alarms. Reduction of false alarms can be obtained by allowing false alarms to be present in the training data. False alarms can also be reduced by applying a time-based threshold for the HMM, i.e. large deviations from normal behaviors should last for a certain time period before alerting the operator.
7
Further work
The approach will be tested and evaluated also with other experimental data representing other security scenarios. The fusion of acoustic and optical sensor data will be investigated to see whether acoustic data can improve the
402
performance of the detection and behavior models. Fusion of optical data and radar data will also be further investigated to see whether the detection of hidden weapons can be improved. The authors also participate in the on-going EU funded project Prometheus (FP7-214901) [16]. Prometheus aims at establishing a general framework which links fundamental sensing tasks to automated cognition processes. The framework will enable interpretation and short-term prediction of individual and crowd behaviors. An important task is the definition and design of fusion models, tracking models and behavioral models that will be used to automatically detect persons and interpret their behavior as well as the behavior of groups of people. The work that has been presented in this article will, among other things, be further developed in the continuing work of Prometheus.
[8] H. Uemura, S. Ishikawa and K. Mikolajczyk. “Feature tracking and motion compensation for action recognition”, In Proc. of BMVA British Machine Vision Conference (BMVC), Leeds, UK, 1-4 April, 2008.
References
[11] L. R. Rabiner, “A tutorial on hidden Markov models and selected applications in speech recognition”, In Proc. of the IEEE, Vol. 77, No. 2, 1989, pp. 257-286.
[1] CAVIAR, Context aware vision using image-based active recognition, EU IST programme project IST 2001 37540, http://homepages.inf.ed.ac.uk/rbf/CAVIARDATA1. [2] KTH Action Database, http://www.nada.kth.se/cvap/ actions/. [3] PETS, Performance evaluation of tracking and surveillance, http://www.cvg.cs.rdg.ac.uk/slides/pets.html. [4] R. Eshel and Y. Moses, “Homography based multiple camera detection and tracking of people in a dense crowd”, IEEE Conf. on Computer Vision and Patterns Recognition, Anchorage, AK, 23-28 June, 2008, pp. 1-8. [5] P. Reisman, O. Mano, S. Avidan and A. Shashua, “Crowd detection in video sequences”, IEEE Intelligent Vehicle Symposium, 14-17 June, 2004, pp. 66–71. [6] A. Gilbert, J. Illingworth and R. Bowden, “Scale invariant action recognition using compound features mined from dense spatio-temporal corners”, In Proc. of the European Conference on Computer Vision (ECCV’08), Marseille, France, 12-18 October, 2008, pp. 222–233. [7] I. Laptev, M. Marszalek, C. Schmid and B. Rozenfeld. "Learning realistic human actions from movies", In Proc. of IEEE International Conference on Computer Vision and Pattern Recognition (CVPR), Anchorage, USA, 24-25, June, 2008, pp. 1–8.
[9] D. Arsic´, J. Schenk, B. Schuller, F. Wallhof and G. Rigoll, “Submotions for hidden Markov model based dynamic facial action recognition”, In Proc. of International Conference on Image Processing (ICIP 2006), Atlanta, Georgia, USA, 8-11 October, pp. 673-676. [10] E. L. Andrade, S. Blundsen and R. B. Fisher, ”Hidden Markov models for optical flow analysis in crowds”, In Proc. of the 18th International Conference on Pattern Recognition (ICPR 2006), Hong Kong, China, 20-24 August, pp. 460-463.
[12] C. Stauffer and W. E. L. Grimson, “Adaptive background mixture models for real-time tracking”, IEEE Computer Society Conference on Computer Vision and Pattern Recognition (CVPR), Volume 2, 1999. [13] T. Zhao, R. Nevatia, “Tracking multiple humans in complex situations”, IEEE Trans. on Pattern Analysis and Machine Intelligence, 26 (9), 2004, pp. 1208-1221. [14] Y. Ma, S. Soatto, J. Košecká and S. Sastry, “An invitation to 3-D vision – from images to geometric models”, Springer Science + Business Media, LLC, New York, USA, 2004. [15] J. Kjellgren, “On 3D-radar data visualization and merging with camera images”, Proc. SPIE, Millimeters Wave and Terahertz Sensors and Technology, Vol. 7117, Cardiff, UK, 17-18 September, 2008, pp. G1-G12. [16] J. Ahlberg, D. Arsic, T. Ganchev, A. Linderhed, P. Menezes, S. Ntalampiras, T. Olma, I. Potamitis and J. Ros, “Prometheus: Prediction and interpretation of human behavior based on probabilistic structures and heterogeneous sensors”, In Proc. of the 18th European Conf. on Artificial Intelligence, ECAI (2008), Patras, Greece, 21-25 July, 2008.
403